 Multi-family
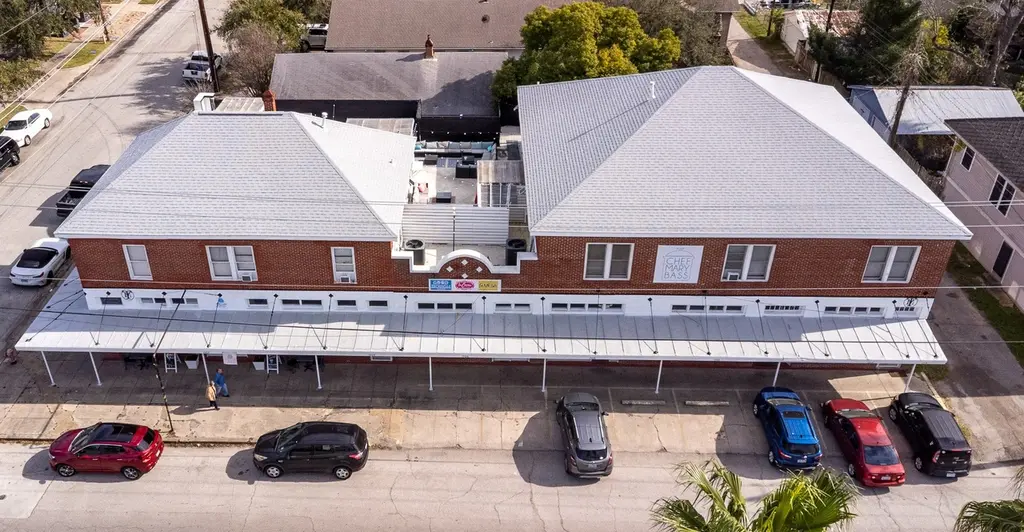
1502 39th St · Galveston, TX
Flood risk No data
- FEMA flood zone
- —
- Chance of flooding over 30 yrs
- —
- Est. flood insurance / yr
- —
Fire risk No data
- Est. fire insurance / yr
- —
Heat risk No data
- Hot days now (above threshold)
- —
- Hot days in 30 yrs
- —
Wind risk No data
- Chance of severe wind over 30 yrs
- —
Air-quality risk No data
- Unhealthy air days now
- —
- Unhealthy air days in 30 yrs
- —
Risk factors via First Street. Map © Google.
Why this score? — see what drove the B grade
The composite is a weighted blend of 9 inputs, each scored 0–100. Each bar is that input's sub-score; the figure is the points it added to the 100-point composite (weight × sub-score).
- Cash flow +28.3/30.0
- ARV discount +15.0/15.0
- DSCR +10.0/10.0
- 1% rule +7.8/10.0
- Condition / age +4.0/5.0
- Livability +3.8/5.0
- Schools +3.0/10.0
- Rent growth +2.2/5.0
- Appreciation +0.0/10.0
$1,175,000
🖨 Deal sheet 📄 Offer letter ✓ Due diligence
Multi-family units
County records classify this as Multi-Family (2-4 Unit). Listing-text estimate: 1 unit. estimate disagrees with records
Listing remarks MLS
Large two story prominent corner historic brick building, circa 1924, with 9 first floor rental areas: 7 facing 39th Street and two facing Avenue N. The upstairs has two large condo-type areas with one having 7 bedrooms surrounding two common areas, a kitchen and 1 1/2 baths and the other having 4 bedrooms and a kitchen and bath. A large private roof patio area, with covered bar area, separates the two upstairs living areas. Hot tub area, with patio and private staircase downstairs. The property is among the many up and coming 39th Street establishments.
Key facts
- Private staircase
- Covered bar area
- Hot tub area
Tags
Neighborhood map
What this means for you Summary
Snapshot
- This is a 11-bed/?-bath multifamily listed at $1.18M. Condition is rated good.
Deal economics
- At list price, monthly cash flow is $4k ($45k/yr) — positive.
- The deal already cash-flows at list — no discount required.
- Meets the 1% rule at list price ($15k rent vs $1.18M).
- Recommended offer: $1.03M (12.0% below list) — sets the bar for market timing.
- Cap rate 10.2% vs local median 0.1% in Galveston — top-decile yield for the area; either an underpriced asset or a hidden risk that comps aren't pricing in. Stress-test before assuming the spread holds.
Location & tenants
- Location reads 76/100 on livability (#108 in TX, #3,559 nationally) — a middle-class / working-renter tenant base. Strengths: commute A+, cost of living A+, housing A+; Watch: amenities D+, employment D, crime F.
- Galveston ISD (town): math 33% / reading 39% proficiency, ranked #514 of 826 in TX (top 62%) — families likely to look elsewhere, expect single-tenant / working-renter base with shorter leases; 68% free/reduced lunch — lower-income household profile, screen leases tightly.
- Market conditions: Rents soft (-1.1%/yr); 622 active listings in the ZIP; 3,258 units permitted in Galveston County in 2024 (0 in 5+ unit buildings).
- At $15,063/mo this rent would consume 401% of the median local household income ($45k/yr) (locally 2193% of renters already pay >50% of income on rent) — very limited rent-growth headroom before tenants either downsize or default.
Forward outlook
- Local home prices are declining (-3.0%/yr); year-one equity from $8k of loan paydown is wiped out by about $35k of value loss. Plan a longer hold.
- Galveston County population projected at +43% by 2050 — long-run rental-demand tailwind backs the buy-and-hold thesis.
Negotiation context
- It's been on market 147 days — a 12% lower offer ($1.03M) is reasonable based on typical stale-listing flexibility.
- 6 sale attempts since 5y ago; this cycle's ask has dropped $75k (6%) from the opening price — seller is motivated, your offer sets the floor, not the list.
Risks & watch-outs
- Watch-outs: built in 1924 — expect roof / HVAC / electrical / plumbing capex.
Questions for the listing agent
- It's been on market 147 days. Have you received any prior offers? Is the seller open to a 12% concession, seller financing, or rate buy-down credit?
- Built in 1924 — when were the roof, HVAC, electrical panel, plumbing, and water heater last replaced?
- Why hasn't it sold? Are there any deal-killer items the seller is aware of (foundation, flood, title, zoning, code violations)?
- Is there a deadline driving the sale (1031 exchange, divorce, estate, relocation)? That informs how much negotiation room exists.
- Crime grade is F in this area — have there been break-ins, vandalism, or insurance claims at this property in the last 3 years? What carrier currently insures it and at what premium?
- What's the average days-on-market for RENTAL listings here right now (not sales)? A rising rental-DOM trend means longer vacancies and softer asking-rent achievability than the comps imply.
- What's the recent tenant-quality profile in this submarket — average credit score on applications, eviction rate, late-payment / NSF rate, and stable-employment percentage? A property-management company in the area should have these aggregated.
- How much new apartment / multifamily construction is in the pipeline within 1–3 miles? Heavy new supply (>2% of stock underway) typically softens rents 12–24 months out; light construction supports rent growth.
Investment metrics
- 1% rule
- 1.28% ✓
- Cap rate
- 10.15%
- Cash-on-cash
- 13.79%
- DSCR
- 1.61
- GRM
- 6.5
CMA / ARV
- ARV (median comp)
- $1,617,657
- List price
- $1,175,000
- Delta
- -27.36%
- Verdict
- UNDERPRICED
- Comps
- 4 within 2.0 mi
Projected returns pro-forma
-3.0% appreciation · 0.0% rent growth · sell at horizon
- IRR
- 0.5%
- Equity multiple
- 1.02×
- Total profit
- $6,408
- Equity at exit
- $175,196
- IRR
- 6.8%
- Equity multiple
- 1.44×
- Total profit
- $145,878
- Equity at exit
- $101,593
Cash invested: $329,000 (down + closing). Projections, not guarantees.
Landlord ↔ Tenant lean methodology
- Overall (STATE)
- 87 Strongly Landlord-Friendly
- State Texas
- 87 Strongly Landlord-Friendly · R+5
- County
- — inherits STATE
- City
- — inherits STATE
ZIP-level market 77550
- Home prices YoY
- -32.9%
- Rents YoY
- -1.1%
- Active inventory
- 622
- Price-to-rent
- 47.1×
Monthly cashflow live
- Estimated rent
- $15,063 medium interval (Pro) →
- Mortgage (P&I)
- −$6,162
- Tax est. 1.5%
- −$1,469 /mo · $17,625/yr
- Insurance
- −$490
- HOA
- −$0
- Vacancy / Maint / Mgmt
- −$3,163
- Net cashflow
- $3,780
Break-even live
9-unit breakdown (identical units grouped — click to expand)
| Units | Beds | Baths | Est. rent |
|---|---|---|---|
| 1× unit | 7 | 1.5 | $2,080 |
| 1× unit | 4 | 1 | $1,990 |
| 7× units | 0 | 0 | $10,990 |
| #3 | 0 | 0 | $1,570 |
| #4 | 0 | 0 | $1,570 |
| #5 | 0 | 0 | $1,570 |
| #6 | 0 | 0 | $1,570 |
| #7 | 0 | 0 | $1,570 |
| #8 | 0 | 0 | $1,570 |
| #9 | 0 | 0 | $1,570 |
| Total (9 units) | $15,063 | ||
UW: 25.0% down · 7.5% · 30yr · 1.5% tax · 5.0% vac · 8.0% maint · 8.0% mgmt
Financing live
Cash to close
- Down payment
- $293,750
- Closing costs
- $35,250
- Reserves months
- —
- Total cash needed
- —
Loan-product check · same deal, 3 products live
Conventional
25% down · 7.5% · 30yr
- Down + closing
- —
- Monthly P&I
- —
- Monthly cashflow
- —
- DSCR
- —
- Eligible?
- —
Personal DTI + credit; lowest rate.
DSCR
20% down · 8.5% · 30yr
- Down + closing
- —
- Monthly P&I
- —
- Monthly cashflow
- —
- DSCR
- —
- Eligible?
- —
No personal income docs; deal must DSCR.
Hard money
10% down · 12.0% · 12mo
- Down + closing
- —
- Monthly P&I
- —
- Monthly cashflow
- —
- DSCR
- —
- Eligible?
- —
Short-term bridge; refi at stabilization.
Listing history 33 events
-
2026-06-18days on market $1,175,000 Active 147 DOM
-
2026-06-17days on market $1,175,000 Active 146 DOM
-
2026-06-16days on market $1,175,000 Active 145 DOM
-
2026-06-15days on market $1,175,000 Active 144 DOM
-
2026-06-13days on market $1,175,000 Active 142 DOM
-
2026-06-09days on market $1,175,000 Active 138 DOM
-
2026-06-08days on market $1,175,000 Active 137 DOM
-
2026-06-07days on market $1,175,000 Active 136 DOM
-
2026-06-04days on market $1,175,000 Active 133 DOM
-
2026-06-03days on market $1,175,000 Active 132 DOM
-
2026-06-02days on market $1,175,000 Active 131 DOM
-
2026-06-01days on market $1,175,000 Active 130 DOM
-
2026-05-31days on market $1,175,000 Active 129 DOM
-
2026-03-13price $1,175,000 560-char remark
Show marketing remark (560 chars)
Large two story prominent corner historic brick building, circa 1924, with 9 first floor rental areas: 7 facing 39th Street and two facing Avenue N. The upstairs has two large condo-type areas with one having 7 bedrooms surrounding two common areas, a kitchen and 1 1/2 baths and the other having 4 bedrooms and a kitchen and bath. A large private roof patio area, with covered bar area, separates the two upstairs living areas. Hot tub area, with patio and private staircase downstairs. The property is among the many up and coming 39th Street establishments.
-
2026-01-20$1,250,000 Active 560-char remark
Show marketing remark (560 chars)
Large two story prominent corner historic brick building, circa 1924, with 9 first floor rental areas: 7 facing 39th Street and two facing Avenue N. The upstairs has two large condo-type areas with one having 7 bedrooms surrounding two common areas, a kitchen and 1 1/2 baths and the other having 4 bedrooms and a kitchen and bath. A large private roof patio area, with covered bar area, separates the two upstairs living areas. Hot tub area, with patio and private staircase downstairs. The property is among the many up and coming 39th Street establishments.
-
2026-01-02historical
-
2025-08-11price $1,250,000
-
2025-06-11price $1,399,000
-
2025-04-04$1,499,000 Active
-
2025-04-04historical
-
2025-04-01price $1,499,000
-
2024-11-13$1,599,900 Active
-
2024-11-12historical
-
2022-08-08soldstatus Sold
-
2022-06-16status Pending
-
2022-06-06status Option Pending
-
2022-05-18$825,000 Active
-
2022-05-16historical
-
2022-05-04status Active
-
2022-04-26status Pending, Continue to Show
-
2022-01-11price $825,000
-
2021-09-07price $875,000
-
2021-07-27$950,000 Active
ⓘ Source: listings_history table (triggers on properties + properties_extension) + one-shot
backfill from property_details.listing_events for pre-trigger history.
Nearby sold comps map
Loading sold comps map…
Walkable amenities ~0.75 mi
Loading nearby amenities…
Taxation est. · year 1
- Rental income
- $180,756
- − Mortgage interest
- −$65,818
- − Property taxes
- −$17,625
- − Insurance
- −$5,875
- − Repairs & maintenance
- −$14,460
- − Management
- −$14,460
- − Depreciation
- −$34,182
- Taxable income
- $28,335
- Est. tax owed @ 24.0%
- −$6,800
- After-tax cash flow
- $38,555/yr
For passive investors: Depreciation is non-cash, so a rental often shows a tax loss while cash-flowing — sheltering income. Rental losses are passive: they offset passive income freely, and up to $25,000/yr can offset ordinary (W-2) income if you actively participate and your MAGI is under $100k (phasing out to $0 by $150k); unused losses carry forward. On sale, claimed depreciation is recaptured at up to 25%, and gains may owe capital-gains tax (a 1031 exchange can defer both). Figures are a year-1 estimate at your 24.0% rate — not tax advice; consult a CPA.
Condition & rehab AI · 13 photos
This multi-family property is in good condition with a good condition score of 80. It has a cosmetic rehab level and requires minor maintenance. The property has a good resale and rental value with high ROI updates such as updating landscaping and installing smart home technology.
Value-add opportunities
- Both Update landscaping and add curb appeal — Enhances curb appeal and can attract more tenants
- Both Install smart home technology — Improves convenience and can be marketed as a modern feature
Renovation cost estimate screening
Value-add ROI direction
- Both Update landscaping and add curb appeal — Enhances curb appeal and can attract more tenants ↑
- Both Install smart home technology — Improves convenience and can be marketed as a modern feature ↑
ⓘ Cost ranges are severity-bucket heuristics (US national rule-of-thumb). Get contractor quotes + a written scope before underwriting a rehab budget.
Schools (NCES district)
- District
- Galveston ISD
- NCES district ID
- 4820280
- Math proficiency
- 33% ▼ -14.00%
- Reading proficiency
- 39% ▼ -4.00%
- Median HH income
- $40,162
- Composite
- 30.22/100
- National rank
- #6299
- State rank
- #514 of 826 in TX
Livability — Galveston
- Score
- 76/100
- State rank
- #108
- US rank
- #3559
Category grades
Schools grade is shown separately in the Schools card above.
Census & demographics
- Census place
- Galveston, TX
- County
- Galveston County · 357,330 people
- City population
- 55,599
- Metro
- Houston-The Woodlands-Sugar Land, TX
- Population (ZIP)
- 23,489
- Household income
- $45,047
- Rent vs Own
- Severe rent burden
- 2193.0
Population outlook (Galveston County) Hauer SSP2
- Today (2025)
- 390,640 people
- By 2030
- 425,226 · +8.9%
- By 2040
- 493,765 · +26.4%
- By 2050
- 559,698 · +43.3%
- By 2075
- 719,260 · +84.1%
- By 2100
- 819,628 · +109.8%
Race, ethnicity, and origin ACS 2023
- Neighborhood character
- Diverse neighborhood (Simpson 0.66)
- Race & ethnicity
- White 46% Hispanic / Latino 30% Two or more races 19% Black 19% Asian 3%
- Hispanic origin (detail)
- Mexican 21% Puerto Rican 1%
- Common ancestry
- Lithuanian 2% Italian 2% Romanian 1%
- Foreign-born
- 11% · Canada, Jamaica
- Languages at home
- 75% English-only · Spanish 18% Other Asian/Pacific 2% Russian/Polish/Slavic 1%
Political lean MEDSL · Galveston
- 2024 margin
- Strong R (+27.4) · D 35.7% · R 63.1% · Other 1.2%
- 2008→2024 swing
- -7.9pp toward R · 2008: -19.5pp · 2024: -27.4pp
- All cycles
- 2024: R+27.4 2020: R+22.6 2016: R+22.6 2012: R+26.9 2008: R+19.5
Not yet ingested
- Civics
- —
Market trends
- HPI YoY
- ▼ -158.96%
- Current HPI
- 324.2159
- Rent YoY
- ▼ -1.12%
- Metro
- Houston-The Woodlands-Sugar Land, TX
- State GDP YoY
- ▲ 3.95%
- F500 in state
- 110
Industry mix (Fortune 500 HQ in TX)
| Industry | F500 HQs | Revenue |
|---|---|---|
| Energy | 16 | $1,198B |
|
||
| Technology | 5 | $198B |
|
||
| Engineering / Construction | 4 | $72B |
|
||
| Energy Services | 3 | $60B |
|
||
| Utilities | 3 | $41B |
|
||
| Healthcare | 2 | $330B |
|
||
Price history
+23.7% since first listed20 events — show timeline
- 2026-03-13 Price Changed $1,175,000 HARMLS
- 2026-01-20 Listed $1,250,000 HARMLS
- 2026-01-02 Listing Removed — HARMLS
- 2025-08-11 Price Changed $1,250,000 HARMLS
- 2025-06-11 Price Changed $1,399,000 HARMLS
- 2025-04-04 Listing Removed — HARMLS
- 2025-04-04 Listed $1,499,000 HARMLS
- 2025-04-01 Price Changed $1,499,000 HARMLS
- 2024-11-13 Listed $1,599,900 HARMLS
- 2024-11-12 Coming Soon — HARMLS
- 2022-08-08 Sold (MLS) — HARMLS
- 2022-06-16 Pending — HARMLS
- 2022-06-06 Pending — HARMLS
- 2022-05-18 Listed $825,000 HARMLS
- 2022-05-16 Listing Removed — HARMLS
- 2022-05-04 Relisted — HARMLS
- 2022-04-26 Pending — HARMLS
- 2022-01-11 Price Changed $825,000 HARMLS
- 2021-09-07 Price Changed $875,000 HARMLS
- 2021-07-27 Listed $950,000 HARMLS
Cash-flow waterfall
monthlySold comps — $/sqft
last 12 mo · ≤1 miLoading sold comps…