11 Wildwood Ln · Port Deposit, MD
Flood risk No data
- FEMA flood zone
- —
- Chance of flooding over 30 yrs
- —
- Est. flood insurance / yr
- —
Fire risk No data
- Est. fire insurance / yr
- —
Heat risk No data
- Hot days now (above threshold)
- —
- Hot days in 30 yrs
- —
Wind risk No data
- Chance of severe wind over 30 yrs
- —
Air-quality risk No data
- Unhealthy air days now
- —
- Unhealthy air days in 30 yrs
- —
Risk factors via First Street. Map © Google.
Why this score? — see what drove the B- grade
The composite is a weighted blend of 9 inputs, each scored 0–100. Each bar is that input's sub-score; the figure is the points it added to the 100-point composite (weight × sub-score).
- Cash flow +30.0/30.0
- 1% rule +10.0/10.0
- DSCR +10.0/10.0
- ARV discount +6.4/15.0
- Condition / age +3.8/5.0
- Livability +2.8/5.0
- Rent growth +2.5/5.0
- Schools +2.2/10.0
- Appreciation +0.0/10.0
$89,500
🖨 Deal sheet 📄 Offer letter ✓ Due diligence
Listing remarks
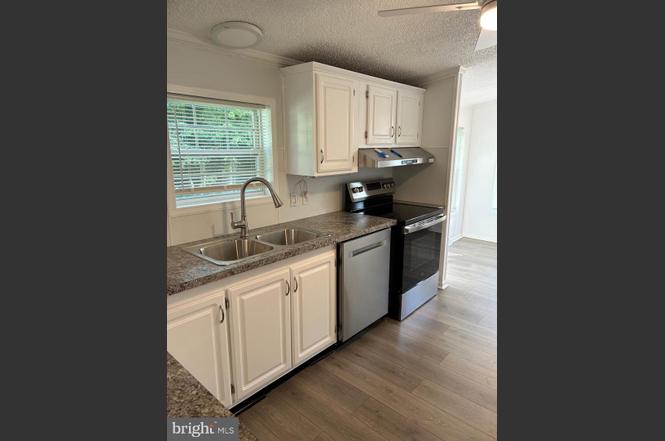
Well maintained 1995 Skyline manufactured home offering 3 bedrooms and 2 full baths in a beautiful setting. This spacious 48X28 home has been extensively updated and features new HVAC system, new flooring throughout, updated plumbing and new countertops. The kitchen is equipped with all new appliances, including dishwasher and exhaust fans. The cabinets feature pull out shelving. Additional improvements include LED lighting; new ceiling fans and the master bath have a separate shower. Enjoy outdoor living on the new 12X10 deck overlooking the attractive lot. A storage shed with electric provides extra tool space, hobby or workshop. Move in ready with numerous updates. MUST BE PARK APPROVED!
Key facts
- Pull out shelving
- New flooring
- New appliances
Tags
Property features AI
Finance
- HOA & community: Monthly land lease of $420
Exterior
- Parking: Driveway parking; Two driveway spaces (total of 2 garage/parking spaces)
- Utilities: Well water; Septic system (capacity related to number of bedrooms); Electric hot water
- Home design: Manufactured home; Vinyl siding exterior; Estimated effective year of major remodel: 2025; Land lease ownership (99 years remaining)
- Construction: Skyline make mobile home; Approximately 28 by 28 feet; Above-grade structure
- Exterior features: Located in the Running Brook park; Tidal waters not present
Interior
- Bedrooms: Three bedrooms on the main level
- Bathrooms: Two full bathrooms (both on the main level)
- Heating & cooling: Forced air heating; Propane (leased) heating fuel; Central air conditioning (electric)
- Interior features: Estimated living area; No basement
Neighborhood map
What this means for you Summary
Snapshot
- This is a 3-bed/2.0-bath single-family listed at $90k. Condition is rated good.
Deal economics
- At list price, monthly cash flow is $741 ($9k/yr) — positive.
- The deal already cash-flows at list — no discount required.
- Meets the 1% rule at list price ($2k rent vs $90k).
- Cap rate 16.2% vs local median 2.8% in Port Deposit — top-decile yield for the area; either an underpriced asset or a hidden risk that comps aren't pricing in. Stress-test before assuming the spread holds.
Location & tenants
- Location reads 56/100 on livability (#406 in MD) — a working-class tenant base; expect higher turnover. Strengths: housing A+, cost of living A, employment B+; Watch: schools F, crime F, amenities F.
- Cecil County Public Schools (rural): math 15% / reading 30% proficiency, ranked #15 of 24 in MD (top 62%) — low school quality limits family demand, transient renter base, plan for 1-2y turnover.
- Market conditions: 26 active listings in the ZIP; 563 units permitted in Cecil County in 2024 (330 in 5+ unit buildings).
Forward outlook
- Local home prices are declining (-3.0%/yr); year-one equity from $619 of loan paydown is wiped out by about $3k of value loss. Plan a longer hold.
- At projected returns (-3.0% appreciation + 3.0% rent growth), your $25k cash investment doubles in ~4 years — after that, you're playing with house money.
Negotiation context
- Only 2 days on market — expect competitive offers; lowballing is unlikely to land.
Questions for the listing agent
- Is there a deadline driving the sale (1031 exchange, divorce, estate, relocation)? That informs how much negotiation room exists.
- Schools are F-rated, which usually means shorter tenancies and higher turnover. Who's the typical renter profile here, and what's been the actual vacancy rate?
- Crime grade is F in this area — have there been break-ins, vandalism, or insurance claims at this property in the last 3 years? What carrier currently insures it and at what premium?
- What's the average days-on-market for RENTAL listings here right now (not sales)? A rising rental-DOM trend means longer vacancies and softer asking-rent achievability than the comps imply.
- What's the recent tenant-quality profile in this submarket — average credit score on applications, eviction rate, late-payment / NSF rate, and stable-employment percentage? A property-management company in the area should have these aggregated.
- How much new for-sale + rental construction is in the pipeline within 1–3 miles? Heavy new supply typically softens prices + rents 12–24 months out; constrained supply supports both.
Investment metrics
- 1% rule
- 1.92% ✓
- Cap rate
- 16.23%
- Cash-on-cash
- 35.51%
- DSCR
- 2.58
- GRM
- 4.3
CMA / ARV
- ARV (on-the-fly)
- $87,360
- Comps found
- 3
Show comp detail 3 sales within ~0.75 mi
| Address | Dist | Beds/Ba | Sqft | Sold | Price | $/sf | Match |
|---|---|---|---|---|---|---|---|
| 1 Garden Dr | 0.12mi | 3/2.0 | 1,456 (+8%) | 3mo | $95,000 | $65 | 78 |
| 1 Wildwood Ln | 0.05mi | 3/2.0 | 1,200 (-11%) | 3mo | $75,000 | $63 | 77 |
| 95 Jackson Park Rd | 0.63mi | 3/2.0 | 1,344 (0%) | 8mo | $95,000 | $71 | 64 |
Match score weights: distance 35% · size 25% · config 20% · recency 20%. Top-matched comps best support the ARV.
Projected returns pro-forma
-3.0% appreciation · 3.0% rent growth · sell at horizon
- IRR
- 31.1%
- Equity multiple
- 2.31×
- Total profit
- $32,749
- Equity at exit
- $13,345
- IRR
- 38.3%
- Equity multiple
- 4.57×
- Total profit
- $89,434
- Equity at exit
- $7,738
Cash invested: $25,060 (down + closing). Projections, not guarantees.
Landlord ↔ Tenant lean methodology
- Overall (STATE)
- 27 Tenant-Leaning
- State Maryland
- 27 Tenant-Leaning · D+14
- County
- — inherits STATE
- City
- — inherits STATE
ZIP-level market 21904
- Home prices YoY
- -35.0%
- Active inventory
- 26
- Price-to-rent
- 4.3×
Monthly cashflow live
- Estimated rent
- $1,722 medium interval (Pro) →
- Mortgage (P&I)
- −$469
- Tax est. 1.5%
- −$112 /mo · $1,342/yr
- Insurance
- −$37
- HOA
- −$0
- Vacancy / Maint / Mgmt
- −$362
- Net cashflow
- $741
Break-even live
UW: 25.0% down · 7.5% · 30yr · 1.5% tax · 5.0% vac · 8.0% maint · 8.0% mgmt
Financing live
Cash to close
- Down payment
- $22,375
- Closing costs
- $2,685
- Reserves months
- —
- Total cash needed
- —
Loan-product check · same deal, 3 products live
Conventional
25% down · 7.5% · 30yr
- Down + closing
- —
- Monthly P&I
- —
- Monthly cashflow
- —
- DSCR
- —
- Eligible?
- —
Personal DTI + credit; lowest rate.
DSCR
20% down · 8.5% · 30yr
- Down + closing
- —
- Monthly P&I
- —
- Monthly cashflow
- —
- DSCR
- —
- Eligible?
- —
No personal income docs; deal must DSCR.
Hard money
10% down · 12.0% · 12mo
- Down + closing
- —
- Monthly P&I
- —
- Monthly cashflow
- —
- DSCR
- —
- Eligible?
- —
Short-term bridge; refi at stabilization.
Listing history 3 events
-
2026-06-18days on market $89,500 Active 2 DOM
-
2026-06-17remarks 699-char remark
-
2026-06-17$89,500 Active 1 DOM
ⓘ Source: listings_history table (triggers on properties + properties_extension) + one-shot
backfill from property_details.listing_events for pre-trigger history.
Nearby sold comps map
Loading sold comps map…
Walkable amenities ~0.75 mi
Loading nearby amenities…
Taxation est. · year 1
- Rental income
- $20,658
- − Mortgage interest
- −$5,013
- − Property taxes
- −$1,342
- − Insurance
- −$448
- − Repairs & maintenance
- −$1,653
- − Management
- −$1,653
- − Depreciation
- −$2,604
- Taxable income
- $7,946
- Est. tax owed @ 24.0%
- −$1,907
- After-tax cash flow
- $6,991/yr
For passive investors: Depreciation is non-cash, so a rental often shows a tax loss while cash-flowing — sheltering income. Rental losses are passive: they offset passive income freely, and up to $25,000/yr can offset ordinary (W-2) income if you actively participate and your MAGI is under $100k (phasing out to $0 by $150k); unused losses carry forward. On sale, claimed depreciation is recaptured at up to 25%, and gains may owe capital-gains tax (a 1031 exchange can defer both). Figures are a year-1 estimate at your 24.0% rate — not tax advice; consult a CPA.
Condition & rehab AI · 2 photos
This well-maintained 1995 Skyline manufactured home is move-in ready with extensive updates, including new appliances, flooring, and HVAC system. It offers a good condition score and is ready for a new owner or tenant.
Value-add opportunities
- Both Painting exterior siding — Enhances curb appeal and can increase both resale and rental value.
- Both Landscaping — Improves curb appeal and can increase both resale and rental value.
- Both New window treatments — Enhances curb appeal and can increase both resale and rental value.
- Both New flooring in bathrooms — Improves functionality and can increase both resale and rental value.
- Both New countertops in bathrooms — Improves functionality and can increase both resale and rental value.
Renovation cost estimate screening
Value-add ROI direction
- Both Painting exterior siding — Enhances curb appeal and can increase both resale and rental value. ↑
- Both Landscaping — Improves curb appeal and can increase both resale and rental value. ↑
- Both New window treatments — Enhances curb appeal and can increase both resale and rental value. ↑
- Both New flooring in bathrooms — Improves functionality and can increase both resale and rental value. ↑
- Both New countertops in bathrooms — Improves functionality and can increase both resale and rental value. ↑
ⓘ Cost ranges are severity-bucket heuristics (US national rule-of-thumb). Get contractor quotes + a written scope before underwriting a rehab budget.
Schools (NCES district)
- District
- Cecil County Public Schools
- NCES district ID
- 2400240
- Math proficiency
- 15% ▼ -21.00%
- Reading proficiency
- 30% ▼ -15.00%
- Median HH income
- $66,544
- Composite
- 21.51/100
- National rank
- #8322
- State rank
- #15 of 24 in MD
Livability — Port Deposit
- Score
- 56/100
- State rank
- #406
- US rank
- #22434
Category grades
Schools grade is shown separately in the Schools card above.
Census & demographics
- Population (ZIP)
- 6,401
Population outlook (Cecil County) Hauer SSP2
- Today (2025)
- 105,877 people
- By 2030
- 106,905 · +1.0%
- By 2040
- 107,156 · +1.2%
- By 2050
- 104,170 · -1.6%
- By 2075
- 95,771 · -9.5%
- By 2100
- 82,381 · -22.2%
Race, ethnicity, and origin ACS 2023
- Neighborhood character
- Predominantly White (84%)
- Race & ethnicity
- White 84% Hispanic / Latino 9% Two or more races 6% Black 6%
- Hispanic origin (detail)
- Mexican 8%
- Common ancestry
- Romanian 3% Italian 3% Serbian 2%
- Foreign-born
- 3% · Canada, Guatemala
- Languages at home
- 95% English-only · Spanish 3% Other Indo-European 1% German/W. Germanic 1%
Political lean MEDSL · Cecil
- 2024 margin
- Solid R (+30.9) · D 33.5% · R 64.4% · Other 2.1%
- 2008→2024 swing
- -16.3pp toward R · 2008: -14.6pp · 2024: -30.9pp
- All cycles
- 2024: R+30.9 2020: R+26.6 2016: R+35.3 2012: R+20.4 2008: R+14.6
Not yet ingested
- Civics
- —
Market trends
- HPI YoY
- ▼ -134.21%
- Current HPI
- 249.2215
- Rent YoY
- —
- Metro
- —
- State GDP YoY
- ▲ 2.97%
- F500 in state
- 12
Industry mix (Fortune 500 HQ in MD)
| Industry | F500 HQs | Revenue |
|---|---|---|
| Aerospace / Defense | 1 | $71B |
|
||
| Utilities | 1 | $25B |
|
||
| Hotels | 1 | $24B |
|
||
| Consumer Goods | 1 | $7B |
|
||
| Real Estate | 1 | $6B |
|
||
| Chemicals | 1 | $2B |
|
||
Price history
1 event — show timeline
- 2026-06-16 Listed $89,500 BRIGHT MLS
Cash-flow waterfall
monthlySold comps — $/sqft
last 12 mo · ≤1 miLoading sold comps…