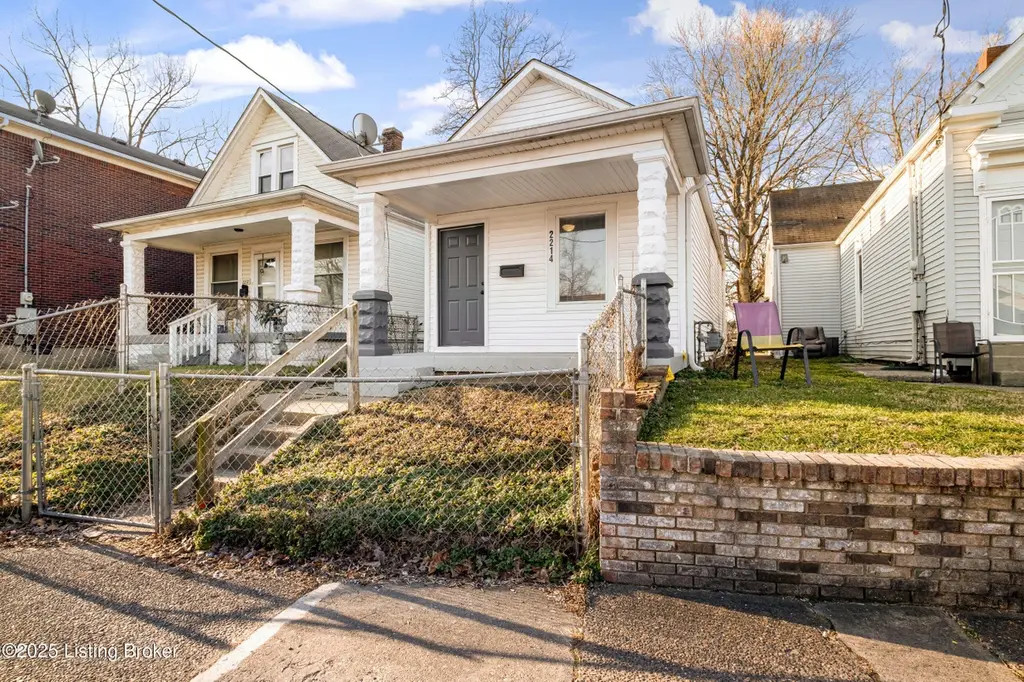
2214 Wilson Ave · Louisville, KY
Flood risk 1/10 · Minimal
- FEMA flood zone
- X (unshaded)
- Chance of flooding over 30 yrs
- 0.0%
- Est. flood insurance / yr
- $507 – $1,088
Fire risk 1/10 · Minimal
- Est. fire insurance / yr
- $839 – $1,559
Heat risk 5/10 · Moderate
- Hot days now (above 105°F)
- 7 days/yr
- Hot days in 30 yrs
- 20 days/yr
Wind risk 2/10 · Minimal
- Chance of severe wind over 30 yrs
- 1.0%
Air-quality risk 2/10 · Minimal
- Unhealthy air days now
- 1 days/yr
- Unhealthy air days in 30 yrs
- 3 days/yr
Risk factors via First Street. Map © Google.
Why this score? — see what drove the B+ grade
The composite is a weighted blend of 9 inputs, each scored 0–100. Each bar is that input's sub-score; the figure is the points it added to the 100-point composite (weight × sub-score).
- Cash flow +30.0/30.0
- DSCR +10.0/10.0
- Appreciation +10.0/10.0
- 1% rule +8.5/10.0
- ARV discount +7.5/15.0
- Rent growth +4.5/5.0
- Livability +3.2/5.0
- Condition / age +2.5/5.0
- Schools +2.3/10.0
$69,900
🖨 Deal sheet 📄 Offer letter ✓ Due diligence
Listing remarks
Welcome to this beautifully updated 1-bedroom, 1-bath home in the heart of the Park Hill neighborhood—perfect for first-time buyers, downsizers, or anyone seeking a low-maintenance space. Inside, enjoy gorgeous new flooring, fresh paint, and a fully renovated kitchen and bathroom. The spacious bedroom was once two rooms and could easily be converted back if desired. The renovated bathroom and laundry room are conveniently located off the bedroom, with the laundry room featuring a brand-new water heater and laundry hookups. A cellar beneath the bedroom offers additional storage or a safe place during storms. Recent updates include: new HVAC in 2025, updated electric, plumbing, PVC sewe
Key facts
- 3,485 sq ft lot
- Built 1900
- Listed 44 days
Property features AI
Finance
- Other: Lot dimensions approximately 25 x 140
- HOA & community: No association fee; Located in the Park Hill subdivision
Exterior
- Utilities: Electricity connected; Public water and sewer not explicitly listed
- Home design: Single family residence (Shotgun style); One story; Entry and main living areas on the first floor; Facing direction not specified
- Construction: Built in 1900; Vinyl siding with wood frame construction; Shingle roof; Poured concrete foundation
- Exterior features: Chain link full fencing; Sidewalk; Level lot
Interior
- Kitchen: Kitchen on the first floor
- Bedrooms: One bedroom on the first floor; First-floor primary bedroom
- Bathrooms: One full bathroom on the first floor
- Heating & cooling: Forced air electric heating; Central air conditioning; One HVAC unit
- Interior features: Five total rooms; One closet; Cellar basement; Attic space accessible via the kitchen; Could be divided (flex space)
- Laundry & utility: First-floor laundry
Neighborhood map
What this means for you Summary
Snapshot
- This is a 1-bed/1.0-bath single-family listed at $70k.
Deal economics
- At list price, monthly cash flow is $327 ($4k/yr) — positive.
- The deal already cash-flows at list — no discount required.
- Meets the 1% rule at list price ($946 rent vs $70k).
- Recommended offer: $68k (3.0% below list) — sets the bar for market timing.
- Cap rate 11.9% vs local median 5.0% in Louisville — top-decile yield for the area; either an underpriced asset or a hidden risk that comps aren't pricing in. Stress-test before assuming the spread holds.
Location & tenants
- Location reads 63/100 on livability (#333 in KY) — a middle-class / working-renter tenant base. Strengths: cost of living A+, housing A+; Watch: employment C-, health & safety D+, schools D-.
- Jefferson County (urban): math 19% / reading 35% proficiency, ranked #121 of 165 in KY (top 73%) — low school quality limits family demand, transient renter base, plan for 1-2y turnover.
- Market conditions: Rents rising fast (+8.1%/yr); 91 active listings in the ZIP; 40 comparable units currently listed for rent nearby; rentals at typical pace (median 17d on market — plan ~3-4 weeks tenant-placement turnaround); lower-income renter base — watch delinquency; 2,836 units permitted in Jefferson County in 2024 (1,558 in 5+ unit buildings).
Forward outlook
- In year one you build about $7k of equity ($483 loan paydown + $7k appreciation (10.0% local appreciation)).
- Jefferson County population projected at +13% by 2050 — modest demand growth; plan on rents tracking national, not racing it.
- At projected returns (10.0% appreciation + 8.0% rent growth), your $20k cash investment doubles in ~2 years — after that, you're playing with house money.
- By year 5, paydown + projected appreciation supports a ~$35k cash-out refi (75% LTV) — recoverable capital for the next deal without selling this one.
Negotiation context
- It's been on market 44 days — a 3% lower offer ($68k) is reasonable based on typical stale-listing flexibility.
- 9 sale attempts since 5y ago with the ask held roughly flat each time — persistent listings suggest the price (not the market) is what's stuck; bring a comps-based counter.
- Current owner paid $55k; 27% above their basis — modest negotiation headroom, anchor on the comps not their cost.
Risks & watch-outs
- Watch-outs: built in 1900 — expect roof / HVAC / electrical / plumbing capex.
- Climate carrying-cost: extreme-heat days projected 7→20/yr by 2055 (HVAC capex compounding) — expect insurance premiums to compound above CPI over the hold.
Questions for the listing agent
- It's been on market 44 days. Have you received any prior offers? Is the seller open to a 3% concession, seller financing, or rate buy-down credit?
- Built in 1900 — when were the roof, HVAC, electrical panel, plumbing, and water heater last replaced?
- Is there a deadline driving the sale (1031 exchange, divorce, estate, relocation)? That informs how much negotiation room exists.
- Schools are D-rated, which usually means shorter tenancies and higher turnover. Who's the typical renter profile here, and what's been the actual vacancy rate?
- Crime grade is F in this area — have there been break-ins, vandalism, or insurance claims at this property in the last 3 years? What carrier currently insures it and at what premium?
- What's the average days-on-market for RENTAL listings here right now (not sales)? A rising rental-DOM trend means longer vacancies and softer asking-rent achievability than the comps imply.
- What's the recent tenant-quality profile in this submarket — average credit score on applications, eviction rate, late-payment / NSF rate, and stable-employment percentage? A property-management company in the area should have these aggregated.
- How much new for-sale + rental construction is in the pipeline within 1–3 miles? Heavy new supply typically softens prices + rents 12–24 months out; constrained supply supports both.
Investment metrics
- 1% rule
- 1.35% ✓
- Cap rate
- 11.90%
- Cash-on-cash
- 20.03%
- DSCR
- 1.89
- GRM
- 6.2
CMA / ARV
- ARV (on-the-fly)
- $42,294
- Comps found
- 12
Show comp detail 12 sales within ~0.75 mi
| Address | Dist | Beds/Ba | Sqft | Sold | Price | $/sf | Match |
|---|---|---|---|---|---|---|---|
| 2519 Standard Ave | 0.29mi | 2/1.0 (+1) | 783 (-2%) | 1mo | $87,000 | $111 | 77 |
| 1333 S 22nd St | 0.12mi | 2/1.0 (+1) | 744 (-7%) | 11mo | $87,000 | $117 | 69 |
| 2012 St. Louis Ave | 0.16mi | 2/1.0 (+1) | 784 (-2%) | 20mo | $75,000 | $96 | 68 |
| 1739 Dumesnil St | 0.43mi | 2/1.0 (+1) | 800 (+0%) | 9mo | $70,000 | $88 | 67 |
| 1335 S 22nd St | 0.12mi | 2/1.0 (+1) | 705 (-12%) | 6mo | $27,000 | $38 | 65 |
| 2306 Standard Ave | 0.22mi | 2/1.0 (+1) | 900 (+13%) | 4mo | $38,000 | $42 | 60 |
| 1637 W Oak St | 0.56mi | 1/1.0 | 854 (+7%) | 7mo | $27,000 | $32 | 56 |
| 1724 Wilson Ave | 0.48mi | 2/1.0 (+1) | 813 (+2%) | 18mo | $38,500 | $47 | 54 |
| 1546 Gallagher St | 0.71mi | 1/1.0 | 800 (+0%) | 16mo | $41,000 | $51 | 53 |
| 1741 Hale Ave | 0.45mi | 2/1.0 (+1) | 700 (-12%) | 15mo | $20,500 | $29 | 41 |
| 1615 Wilson Ave | 0.60mi | 1/1.0 | 894 (+12%) | 14mo | $47,500 | $53 | 40 |
| 1731 W Hill St | 0.57mi | 2/1.0 (+1) | 733 (-8%) | 20mo | $100,000 | $136 | 39 |
Match score weights: distance 35% · size 25% · config 20% · recency 20%. Top-matched comps best support the ARV.
Projected returns pro-forma
10.0% appreciation · 8.0% rent growth · sell at horizon
- IRR
- 41.7%
- Equity multiple
- 4.26×
- Total profit
- $63,853
- Equity at exit
- $62,971
- IRR
- 37.9%
- Equity multiple
- 10.40×
- Total profit
- $184,017
- Equity at exit
- $135,800
Cash invested: $19,572 (down + closing). Projections, not guarantees.
Landlord ↔ Tenant lean methodology
- Overall (STATE)
- 83 Strongly Landlord-Friendly
- State Kentucky
- 83 Strongly Landlord-Friendly · R+16
- County
- — inherits STATE
- City
- — inherits STATE
ZIP-level market 40210
- Home prices YoY
- 12.1%
- Rents YoY
- 8.1%
- Active inventory
- 91
- Price-to-rent
- 6.2×
Monthly cashflow live
- Estimated rent
- $946 high interval (Pro) →
- Mortgage (P&I)
- −$367
- Tax from tax record
- −$25 /mo · $303/yr
- Insurance
- −$29
- HOA
- −$0
- Vacancy / Maint / Mgmt
- −$199
- Net cashflow
- $327
Break-even live
UW: 25.0% down · 7.5% · 30yr · 1.5% tax · 5.0% vac · 8.0% maint · 8.0% mgmt
Financing live
Cash to close
- Down payment
- $17,475
- Closing costs
- $2,097
- Reserves months
- —
- Total cash needed
- —
Loan-product check · same deal, 3 products live
Conventional
25% down · 7.5% · 30yr
- Down + closing
- —
- Monthly P&I
- —
- Monthly cashflow
- —
- DSCR
- —
- Eligible?
- —
Personal DTI + credit; lowest rate.
DSCR
20% down · 8.5% · 30yr
- Down + closing
- —
- Monthly P&I
- —
- Monthly cashflow
- —
- DSCR
- —
- Eligible?
- —
No personal income docs; deal must DSCR.
Hard money
10% down · 12.0% · 12mo
- Down + closing
- —
- Monthly P&I
- —
- Monthly cashflow
- —
- DSCR
- —
- Eligible?
- —
Short-term bridge; refi at stabilization.
Rent comps 40 comps
| Address | Beds | Baths | Sqft | Rent | $/sqft | DOM | Units | Dist |
|---|---|---|---|---|---|---|---|---|
| 1333 S 22nd St Louisville, KY | 2.0 | 1.0 | 744 | $1,200 | $1.61 | 23d | 1 | 0.15mi |
| 1854 W Ormsby Ave Louisville, KY | 2.0 | 2.0 | 1094 | $800 | $0.73 | 16d | 1 | 0.16mi |
| 2614 Virginia Ave Louisville, KY | 2.0 | 1.0 | 975 | $925 | $0.95 | 23d | 1 | 0.28mi |
| 1349 Olive St Unit 4 Louisville, KY | 1.0 | 1.0 | 600 | $725 | $1.21 | 23d | 1 | 0.33mi |
| 1349 Olive St Unit 4 Louisville, KY | 1.0 | 1.0 | 550 | $650 | $1.18 | 3d | 1 | 0.33mi |
| 1349 Olive St Unit 3 Louisville, KY | 1.0 | 1.0 | 600 | $695 | $1.16 | 3d | 1 | 0.33mi |
| 1842 Bolling Ave Louisville, KY | 1.0 | 1.0 | 900 | $895 | $0.99 | 14d | 1 | 0.38mi |
| 2706 Hale Ave Unit 2 Louisville, KY | 2.0 | 1.0 | 900 | $1,250 | $1.39 | 23d | 1 | 0.40mi |
| 1710 Saint Louis Ave Louisville, KY | 2.0 | 1.0 | 720 | $1,000 | $1.39 | 3d | 1 | 0.41mi |
| 2807 Dumesnil St Unit 101 Louisville, KY | 1.0 | 1.0 | 750 | $950 | $1.27 | 23d | 1 | 0.45mi |
| 1768 W Hill St Louisville, KY | 2.0 | 1.0 | 675 | $925 | $1.37 | 23d | 1 | 0.54mi |
| 1792 W Gaulbert Ave Louisville, KY | 2.0 | 1.0 | 915 | $950 | $1.04 | 23d | 1 | 0.56mi |
| 1305 S 17th St Louisville, KY | 2.0 | 1.0 | 750 | $950 | $1.27 | 23d | 1 | 0.59mi |
| 2400 Burwell Ave Louisville, KY | 2.0 | 1.0 | 972 | $895 | $0.92 | 16d | 1 | 0.61mi |
| 2513 Date St Unit 2 Louisville, KY | 1.0 | 1.0 | 700 | $745 | $1.06 | 3d | 1 | 0.61mi |
| 1418 Beech St Unit 2 Louisville, KY | 2.0 | 1.0 | 1000 | $980 | $0.98 | 21d | 1 | 0.67mi |
| 2724 Garland Ave Unit 202 Louisville, KY | 2.0 | 1.0 | 950 | $745 | $0.78 | 3d | 1 | 0.73mi |
| 1816 Gregg Ave Louisville, KY | 2.0 | 2.0 | 773 | $1,100 | $1.42 | 16d | 1 | 0.76mi |
| 1443 S 32nd St Unit 2 Louisville, KY | 1.0 | 1.0 | 550 | $780 | $1.42 | 23d | 1 | 0.83mi |
| 1836 Algonquin Pkwy Unit 1 Louisville, KY | 1.0 | 1.0 | 650 | $650 | $1.00 | 14d | 1 | 0.83mi |
| 1836 Algonquin Pkwy Unit 2 Louisville, KY | 1.0 | 1.0 | 600 | $650 | $1.08 | 23d | 1 | 0.83mi |
| 2706 Wyandotte Ave Louisville, KY | 2.0 | 1.0 | 756 | $1,295 | $1.71 | 3d | 1 | 0.86mi |
| 2310 W Broadway Unit 1 Louisville, KY | 1.0 | 1.0 | 1100 | $975 | $0.89 | 3d | 1 | 0.97mi |
| 1145 Louis Coleman Jr Dr Louisville, KY | 2.0 | 1.0 | 913 | $875 | $0.96 | 23d | 1 | 0.97mi |
| 3004 Wyandotte Ave Louisville, KY | 2.0 | 1.0 | 700 | $1,200 | $1.71 | 16d | 1 | 0.98mi |
| 832 Hazel St Louisville, KY | 2.0 | 1.0 | 720 | $1,095 | $1.52 | 3d | 1 | 0.99mi |
| 1606 Algonquin Pkwy Unit 22 Louisville, KY | 2.0 | 1.0 | 626 | $750 | $1.20 | 23d | 1 | 1.03mi |
| 1927 S 28th St Louisville, KY | 2.0 | 1.0 | 700 | $1,200 | $1.71 | 23d | 1 | 1.06mi |
| 2411 Elliott Ave Louisville, KY | 2.0 | 1.0 | 892 | $895 | $1.00 | 23d | 1 | 1.07mi |
| 2733 Chase Ct Louisville, KY | 2.0 | 1.0 | 900 | $900 | $1.00 | 16d | 1 | 1.11mi |
| 3019 Penway Ave Louisville, KY | 2.0 | 1.0 | 700 | $960 | $1.37 | 11d | 1 | 1.13mi |
| 3005 Linwood Ave Louisville, KY | 2.0 | 1.0 | 700 | $1,025 | $1.46 | 16d | 1 | 1.14mi |
| 701 Hazel St Unit 3 Louisville, KY | 2.0 | 1.0 | 832 | $800 | $0.96 | 10d | 1 | 1.18mi |
| 3515 W Kentucky St Unit 3515-12 Louisville, KY | 1.0 | 1.0 | 700 | $695 | $0.99 | 23d | 1 | 1.21mi |
| 1700 Magazine St Unit 3 Louisville, KY | 2.0 | 1.0 | 900 | $1,150 | $1.28 | 17d | 1 | 1.25mi |
| 2300 W Madison St Louisville, KY | 2.0 | 1.0 | 900 | $850 | $0.94 | 23d | 1 | 1.28mi |
| 666 Eastlawn Ave Louisville, KY | 2.0 | 1.0 | 936 | $895 | $0.96 | 16d | 1 | 1.30mi |
| 2221 W Madison St Louisville, KY | 2.0 | 1.0 | 1000 | $1,350 | $1.35 | 21d | 1 | 1.31mi |
| 515 S 20th St Louisville, KY | 2.0 | 1.0 | 1000 | $995 | $0.99 | 16d | 1 | 1.35mi |
| 2631 W Madison St Unit 2 Louisville, KY | 2.0 | 1.0 | 928 | $850 | $0.92 | 23d | 1 | 1.35mi |
Listing history 41 events
-
2026-06-18days on market $69,900 Active 44 DOM
-
2026-06-17days on market $69,900 Active 43 DOM
-
2026-06-16days on market $69,900 Active 42 DOM
-
2026-06-15days on market $69,900 Active 41 DOM
-
2026-06-13days on market $69,900 Active 39 DOM
-
2026-06-10days on market $69,900 Active 36 DOM
-
2026-06-09days on market $69,900 Active 35 DOM
-
2026-06-08days on market $69,900 Active 34 DOM
-
2026-06-07days on market $69,900 Active 33 DOM
-
2026-06-03days on market $69,900 Active 29 DOM
-
2026-06-02days on market $69,900 Active 28 DOM
-
2026-06-01days on market $69,900 Active 27 DOM
-
2026-05-31days on market $69,900 Active 26 DOM
-
2026-05-05$69,900 Active
-
2026-04-29historical
-
2026-04-06status Active
-
2026-04-06price $72,900
-
2026-04-01historical Active Under Contract
-
2026-03-30price $74,900
-
2026-03-11price $79,900
-
2025-10-29$83,500 Active
-
2025-06-11status Active
-
2025-05-31historical Contingent
-
2025-05-31historical
-
2025-04-25price $85,000
-
2025-04-03price $89,000
-
2025-03-12$96,000 Active
-
2025-03-04soldstatus $55,000
-
2025-02-26soldstatus $55,000 Closed
-
2025-02-17status Pending
-
2025-01-20price $69,000
-
2025-01-06$75,000 Active
-
2024-12-29historical
-
2024-11-14historical Active Under Contract
-
2024-10-16$68,000 Active
-
2024-09-11historical
-
2024-09-06historical Active Under Contract
-
2024-08-02$75,000 Active
-
2021-09-16historical
-
2021-08-24price $15,000
-
2021-08-24$20,000 Active
ⓘ Source: listings_history table (triggers on properties + properties_extension) + one-shot
backfill from property_details.listing_events for pre-trigger history.
Tax reassessment forecast KY · Resets to sale price
- Current annual tax
- $303 · $25/mo
- Projected year-2 tax
- $601 · $50/mo
- Expected delta
- +$298/yr (+$25/mo · 98.2%)
ⓘ Screening estimate from a state-policy table — verify with the county assessor before closing.
Climate risk First Street
- Flood 1/10 Low FEMA zone X (unshaded) · 0% chance over 30 yrs
- Wildfire 1/10 Low
- Heat 5/10 Major 7 d/yr ≥105°F today · 20 d/yr by 30 yrs out
- Wind 2/10 Low 100% chance of damaging wind over 30 yrs
- Air quality 2/10 Low 1 unhealthy d/yr today · 3 by 30 yrs out
Nearby sold comps map
Loading sold comps map…
Walkable amenities ~0.75 mi
Loading nearby amenities…
Taxation est. · year 1
- Rental income
- $11,356
- − Mortgage interest
- −$3,915
- − Property taxes
- −$303
- − Insurance
- −$350
- − Repairs & maintenance
- −$909
- − Management
- −$909
- − Depreciation
- −$2,033
- Taxable income
- $2,938
- Est. tax owed @ 24.0%
- −$705
- After-tax cash flow
- $3,215/yr
For passive investors: Depreciation is non-cash, so a rental often shows a tax loss while cash-flowing — sheltering income. Rental losses are passive: they offset passive income freely, and up to $25,000/yr can offset ordinary (W-2) income if you actively participate and your MAGI is under $100k (phasing out to $0 by $150k); unused losses carry forward. On sale, claimed depreciation is recaptured at up to 25%, and gains may owe capital-gains tax (a 1031 exchange can defer both). Figures are a year-1 estimate at your 24.0% rate — not tax advice; consult a CPA.
Schools (NCES district)
- District
- Jefferson County
- NCES district ID
- 2102990
- Math proficiency
- 19% ▼ -17.00%
- Reading proficiency
- 35% ▼ -11.00%
- Median HH income
- $47,885
- Composite
- 23.45/100
- National rank
- #7884
- State rank
- #121 of 165 in KY
Livability — Louisville
- Score
- 63/100
- State rank
- #333
- US rank
- #15887
Category grades
Schools grade is shown separately in the Schools card above.
Census & demographics
- Census place
- Louisville, KY
- County
- Jefferson County · 790,184 people
- City population
- 769,292
- Metro
- Louisville/Jefferson County, KY-IN
- Population (ZIP)
- 13,518
- Household income
- $35,347
- Rent vs Own
- Severe rent burden
- 815.0
Population outlook (Jefferson County) Hauer SSP2
- Today (2025)
- 823,112 people
- By 2030
- 849,343 · +3.2%
- By 2040
- 895,696 · +8.8%
- By 2050
- 933,630 · +13.4%
- By 2075
- 1,028,262 · +24.9%
- By 2100
- 1,072,675 · +30.3%
Race, ethnicity, and origin ACS 2023
- Neighborhood character
- Predominantly Black (84%)
- Race & ethnicity
- Black 84% White 8% Two or more races 5% Hispanic / Latino 3%
- Common ancestry
- Iranian 1%
- Foreign-born
- 4% · Canada
- Languages at home
- 93% English-only · Spanish 3%
Political lean MEDSL · Jefferson
- 2024 margin
- D (+16.6) · D 57.4% · R 40.9% · Other 1.7%
- 2008→2024 swing
- +4.5pp toward D · 2008: 12.0pp · 2024: 16.6pp
- All cycles
- 2024: D+16.6 2020: D+20.1 2016: D+13.3 2012: D+11.1 2008: D+12.0
Not yet ingested
- Civics
- —
Market trends
- HPI YoY
- ▲ 28.45%
- Current HPI
- 264.0146
- Rent YoY
- ▲ 8.05%
- Metro
- Louisville/Jefferson County, KY-IN
- State GDP YoY
- ▲ 1.81%
- F500 in state
- 4
Industry mix (Fortune 500 HQ in KY)
| Industry | F500 HQs | Revenue |
|---|---|---|
| Healthcare | 1 | $118B |
|
||
| Food / Beverage | 1 | $7B |
|
||
Price history
+366.0% since first listed28 events — show timeline
- 2026-05-05 Listed $69,900 Metro Search MLS
- 2026-04-29 Listing Removed — Metro Search MLS
- 2026-04-06 Relisted — Metro Search MLS
- 2026-04-06 Price Changed $72,900 Metro Search MLS
- 2026-04-01 Contingent — Metro Search MLS
- 2026-03-30 Price Changed $74,900 Metro Search MLS
- 2026-03-11 Price Changed $79,900 Metro Search MLS
- 2025-10-29 Listed $83,500 Metro Search MLS
- 2025-06-11 Relisted — ImagineMLS
- 2025-05-31 Contingent — ImagineMLS
- 2025-05-31 Listing Removed — ImagineMLS
- 2025-04-25 Price Changed $85,000 ImagineMLS
- 2025-04-03 Price Changed $89,000 ImagineMLS
- 2025-03-12 Listed $96,000 ImagineMLS
- 2025-03-04 Sold (Public Records) $55,000 Public Records
- 2025-02-26 Sold (MLS) $55,000 Metro Search MLS
- 2025-02-17 Pending — Metro Search MLS
- 2025-01-20 Price Changed $69,000 Metro Search MLS
- 2025-01-06 Listed $75,000 Metro Search MLS
- 2024-12-29 Listing Removed — Metro Search MLS
- 2024-11-14 Contingent — Metro Search MLS
- 2024-10-16 Listed $68,000 Metro Search MLS
- 2024-09-11 Listing Removed — Metro Search MLS
- 2024-09-06 Contingent — Metro Search MLS
- 2024-08-02 Listed $75,000 Metro Search MLS
- 2021-09-16 Listing Removed — Metro Search MLS
- 2021-08-24 Listed $20,000 Metro Search MLS
- 2021-08-24 Price Changed $15,000 Metro Search MLS
Cash-flow waterfall
monthlySold comps — $/sqft
last 12 mo · ≤1 miLoading sold comps…