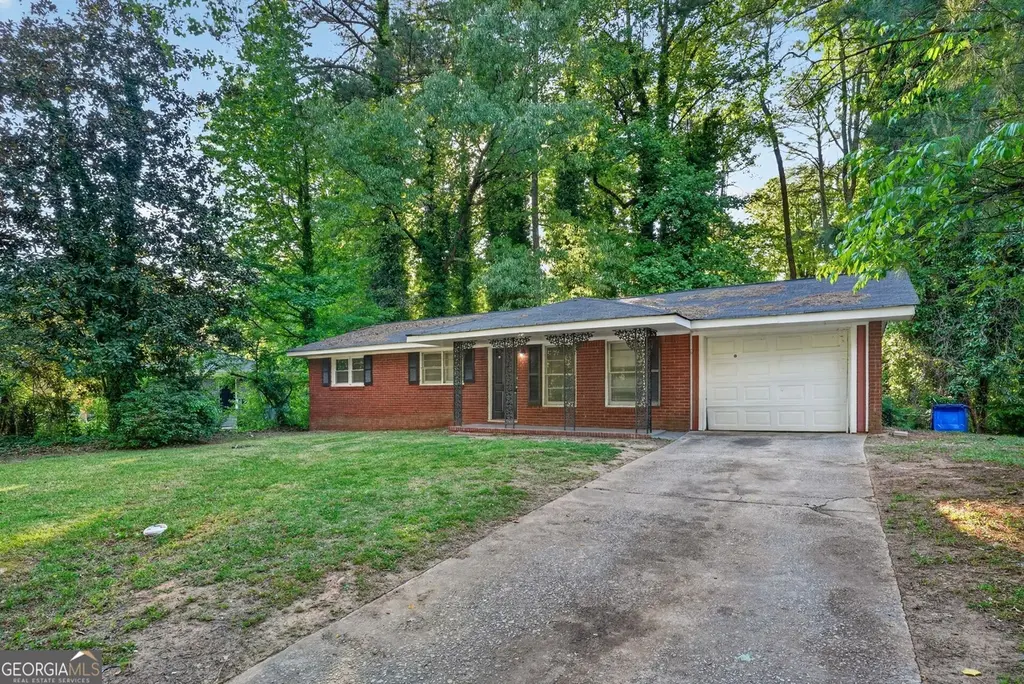
2333 Omaha Rd SW · Atlanta, GA
Flood risk 1/10 · Minimal
- FEMA flood zone
- X (unshaded)
- Chance of flooding over 30 yrs
- 0.0%
- Est. flood insurance / yr
- $473 – $860
Fire risk 1/10 · Minimal
- Est. fire insurance / yr
- $963 – $1,789
Heat risk 5/10 · Moderate
- Hot days now (above 103°F)
- 7 days/yr
- Hot days in 30 yrs
- 18 days/yr
Wind risk 6/10 · Moderate
- Chance of severe wind over 30 yrs
- 27.0%
Air-quality risk 3/10 · Minor
- Unhealthy air days now
- 3 days/yr
- Unhealthy air days in 30 yrs
- 3 days/yr
Risk factors via First Street. Map © Google.
Why this score? — see what drove the C grade
The composite is a weighted blend of 9 inputs, each scored 0–100. Each bar is that input's sub-score; the figure is the points it added to the 100-point composite (weight × sub-score).
- Cash flow +20.0/30.0
- ARV discount +15.0/15.0
- DSCR +6.4/10.0
- 1% rule +5.3/10.0
- Livability +4.2/5.0
- Rent growth +3.2/5.0
- Schools +2.7/10.0
- Condition / age +2.5/5.0
- Appreciation +0.0/10.0
$174,900
🖨 Deal sheet 📄 Offer letter ✓ Due diligence
Listing remarks MLS
This charming 3-bedroom classic home features a blend of traditional elements and modern comforts. The spacious living room welcomes you with and a cozy home feeling, while large windows allow natural light to fill the space. The adjacent dining area flows into a well-appointed kitchen. Each bedroom offers ample closet space, with the primary suite boasting direct access to a shared bathroom featuring a vanity and tub/shower combo. A convenient half bathroom serves guests and adds functionality to the living space. The outdoor area includes a spacious lawn and a deck, perfect for entertaining or enjoying quiet evenings.
Key facts
- Large windows
- Ample closet space
- Spacious lawn
Tags
Neighborhood map
What this means for you Summary
Snapshot
- This is a 3-bed/1.5-bath single-family listed at $175k.
Deal economics
- At list price, monthly cash flow is $216 ($3k/yr) — positive.
- The deal already cash-flows at list — no discount required.
- Meets the 1% rule at list price ($2k rent vs $175k).
- Recommended offer: $170k (3.0% below list) — sets the bar for market timing.
- Cap rate 7.8% vs local median 3.1% in Atlanta — top-decile yield for the area; either an underpriced asset or a hidden risk that comps aren't pricing in. Stress-test before assuming the spread holds.
Location & tenants
- Location reads 83/100 on livability (#6 in GA, #919 nationally) — a professional / high-income tenant draw. Strengths: amenities A+, commute A+, housing A+; Watch: schools C-, cost of living C-.
- Atlanta Public Schools (urban): math 28% / reading 35% proficiency, ranked #80 of 174 in GA (top 46%) — families likely to look elsewhere, expect single-tenant / working-renter base with shorter leases; 71% free/reduced lunch — lower-income household profile, screen leases tightly.
- Market conditions: Rents rising (+2.6%/yr); 483 active listings in the ZIP; 22 comparable units currently listed for rent nearby; rentals at typical pace (median 24d on market — plan ~3-4 weeks tenant-placement turnaround); 11,565 units permitted in Fulton County in 2024 (8,159 in 5+ unit buildings).
- This rent runs 34% of the median local income ($63k/yr) — at the standard rent-burdened threshold; future hikes will face affordability resistance.
Forward outlook
- Local home prices are declining (-3.0%/yr); year-one equity from $1k of loan paydown is wiped out by about $5k of value loss. Plan a longer hold.
- Fulton County population projected at +38% by 2050 — long-run rental-demand tailwind backs the buy-and-hold thesis.
Negotiation context
- It's been on market 58 days — a 3% lower offer ($170k) is reasonable based on typical stale-listing flexibility.
- 3 sale attempts since 13y ago; this cycle's ask has dropped $10k (5%) from the opening price — seller is motivated, your offer sets the floor, not the list.
Risks & watch-outs
- Climate carrying-cost: major wind risk, 27% chance of damaging wind over 30y; extreme-heat days projected 7→18/yr by 2055 (HVAC capex compounding) — expect insurance premiums to compound above CPI over the hold.
Questions for the listing agent
- It's been on market 58 days. Have you received any prior offers? Is the seller open to a 3% concession, seller financing, or rate buy-down credit?
- Built in 1960 — when were the roof, HVAC, electrical panel, plumbing, and water heater last replaced?
- Is there a deadline driving the sale (1031 exchange, divorce, estate, relocation)? That informs how much negotiation room exists.
- What's the average days-on-market for RENTAL listings here right now (not sales)? A rising rental-DOM trend means longer vacancies and softer asking-rent achievability than the comps imply.
- What's the recent tenant-quality profile in this submarket — average credit score on applications, eviction rate, late-payment / NSF rate, and stable-employment percentage? A property-management company in the area should have these aggregated.
- How much new for-sale + rental construction is in the pipeline within 1–3 miles? Heavy new supply typically softens prices + rents 12–24 months out; constrained supply supports both.
Investment metrics
- 1% rule
- 1.03% ✓
- Cap rate
- 7.77%
- Cash-on-cash
- 5.28%
- DSCR
- 1.24
- GRM
- 8.1
CMA / ARV
- ARV (median comp)
- $212,979
- List price
- $174,900
- Delta
- -17.88%
- Verdict
- UNDERPRICED
- Comps
- 20 within 1.0 mi
Show comp detail 12 sales within ~0.75 mi
| Address | Dist | Beds/Ba | Sqft | Sold | Price | $/sf | Match |
|---|---|---|---|---|---|---|---|
| 2364 El Paso Rd SW | 0.11mi | 3/2.5 | 1,265 (-2%) | 9mo | $25,000 | $20 | 80 |
| 2494 Fairway Cir SW | 0.32mi | 3/2.0 | 1,368 (+6%) | 0mo | $234,999 | $172 | 73 |
| 2356 County Line Rd SW | 0.22mi | 3/1.0 | 1,360 (+5%) | 10mo | $112,551 | $83 | 71 |
| 4728 Apache Trl SW | 0.51mi | 3/1.5 | 1,269 (-2%) | 5mo | $185,000 | $146 | 69 |
| 4748 Carson Pass SW | 0.49mi | 3/1.5 | 1,269 (-2%) | 7mo | $195,000 | $154 | 68 |
| 2392 Ozark Trl SW | 0.38mi | 3/2.5 | 1,356 (+5%) | 3mo | $170,000 | $125 | 68 |
| 4732 Carson Pass SW | 0.47mi | 4/1.5 (+1) | 1,269 (-2%) | 4mo | $192,000 | $151 | 67 |
| 4572 Sahara Dr SW | 0.42mi | 3/2.0 | 1,328 (+3%) | 9mo | $220,000 | $166 | 66 |
| 4595 Sahara Dr SW | 0.39mi | 3/2.0 | 1,191 (-8%) | 8mo | $137,000 | $115 | 60 |
| 4268 Kimball Rd SW | 0.44mi | 4/2.5 (+1) | 1,212 (-6%) | 1mo | $115,000 | $95 | 59 |
| 4601 Wilson James Rd SW | 0.43mi | 3/1.0 | 1,200 (-7%) | 9mo | $70,000 | $58 | 59 |
| 4369 Kimball Rd SW | 0.44mi | 3/1.5 | 1,125 (-13%) | 8mo | $215,000 | $191 | 51 |
Match score weights: distance 35% · size 25% · config 20% · recency 20%. Top-matched comps best support the ARV.
Projected returns pro-forma
-3.0% appreciation · 2.63% rent growth · sell at horizon
- IRR
- -8.5%
- Equity multiple
- 0.69×
- Total profit
- $-15,253
- Equity at exit
- $26,078
- IRR
- 0.5%
- Equity multiple
- 1.04×
- Total profit
- $1,782
- Equity at exit
- $15,122
Cash invested: $48,972 (down + closing). Projections, not guarantees.
Landlord ↔ Tenant lean methodology
- Overall (STATE)
- 90 Strongly Landlord-Friendly
- State Georgia
- 90 Strongly Landlord-Friendly · R+3
- County
- — inherits STATE
- City
- — inherits STATE
ZIP-level market 30331
- Home prices YoY
- -34.2%
- Rents YoY
- 2.6%
- Active inventory
- 483
- Price-to-rent
- 8.1×
Monthly cashflow live
- Estimated rent
- $1,798 high interval (Pro) →
- Mortgage (P&I)
- −$917
- Tax from tax record
- −$214 /mo · $2,574/yr
- Insurance
- −$73
- HOA
- −$0
- Vacancy / Maint / Mgmt
- −$378
- Net cashflow
- $216
Break-even live
UW: 25.0% down · 7.5% · 30yr · 1.5% tax · 5.0% vac · 8.0% maint · 8.0% mgmt
Financing live
Cash to close
- Down payment
- $43,725
- Closing costs
- $5,247
- Reserves months
- —
- Total cash needed
- —
Loan-product check · same deal, 3 products live
Conventional
25% down · 7.5% · 30yr
- Down + closing
- —
- Monthly P&I
- —
- Monthly cashflow
- —
- DSCR
- —
- Eligible?
- —
Personal DTI + credit; lowest rate.
DSCR
20% down · 8.5% · 30yr
- Down + closing
- —
- Monthly P&I
- —
- Monthly cashflow
- —
- DSCR
- —
- Eligible?
- —
No personal income docs; deal must DSCR.
Hard money
10% down · 12.0% · 12mo
- Down + closing
- —
- Monthly P&I
- —
- Monthly cashflow
- —
- DSCR
- —
- Eligible?
- —
Short-term bridge; refi at stabilization.
Rent comps 22 comps
| Address | Beds | Baths | Sqft | Rent | $/sqft | DOM | Units | Dist |
|---|---|---|---|---|---|---|---|---|
| 2356 County Line Rd SW Atlanta, GA | 3.0 | 1.0 | 1360 | $1,695 | $1.25 | 24d | 1 | 0.23mi |
| 4515 Doral Dr SW Atlanta, GA | 3.0 | 1.5 | 1184 | $1,700 | $1.44 | 15d | 1 | 0.30mi |
| 4545 Sahara Dr SW Atlanta, GA | 3.0 | 2.0 | 1075 | $1,665 | $1.55 | 5d | 1 | 0.43mi |
| 4596 Sahara Dr SW Atlanta, GA | 4.0 | 1.5 | 1475 | $1,200 | $0.81 | 24d | 1 | 0.45mi |
| 4596 Sahara Dr SW Atlanta, GA | 4.0 | 1.5 | 1375 | $1,500 | $1.09 | 4d | 1 | 0.45mi |
| 4211 Campbellton Rd SW Atlanta, GA | 3.0 | 2.0 | 1384 | $2,050 | $1.48 | 22d | 1 | 0.75mi |
| 4720 Edwina Ln SW Atlanta, GA | 4.0 | 2.0 | 1400 | $1,873 | $1.34 | 2d | 1 | 0.80mi |
| 4610 Greenbriar Trl SW Unit 204 Atlanta, GA | 3.0 | 2.0 | 1206 | $1,950 | $1.62 | 12d | 1 | 0.86mi |
| 2111 Kimberly Rd SW Atlanta, GA | 2.0 | 1.0 | 996 | $1,600 | $1.61 | 7d | 1 | 0.86mi |
| 2111 Sandtree Ct SW Unit 2 Atlanta, GA | 2.0 | 1.0 | 1100 | $1,500 | $1.36 | 24d | 1 | 0.88mi |
| 2243 Butner Rd Unit NA Atlanta, GA | 4.0 | 2.5 | 1518 | $2,350 | $1.55 | 24d | 1 | 0.93mi |
| 4058 Blanton Ave SW Atlanta, GA | 4.0 | 2.0 | 1476 | $1,750 | $1.19 | 17d | 1 | 0.97mi |
| 2211 Butner Rd SW Atlanta, GA | 4.0 | 2.0 | 1336 | $1,875 | $1.40 | 24d | 1 | 0.97mi |
| 4037 Braxton Pl SW Unit 4037 Atlanta, GA | 4.0 | 3.0 | 1397 | $2,100 | $1.50 | 24d | 1 | 1.04mi |
| 4043 Avalon Rd SW Atlanta, GA | 4.0 | 3.0 | 1434 | $2,300 | $1.60 | 24d | 1 | 1.04mi |
| 1960 W Kimberly Rd SW Atlanta, GA | 3.0 | 2.5 | 1852 | $2,105 | $1.14 | 24d | 1 | 1.05mi |
| 2100 Southwood Blvd SW Atlanta, GA | 1.0–2.0 | 1.0–2.0 | 942 | $1,537 | $1.63 | 1d | 15 | 1.12mi |
| 1928 Grant Rd SW Atlanta, GA | 3.0 | 2.0 | 1160 | $1,823 | $1.57 | 22d | 1 | 1.28mi |
| 3901 Campbellton Rd SW Unit 3909-K01 Atlanta, GA | 2.0 | 1.5 | 1093 | $1,199 | $1.10 | 24d | 1 | 1.31mi |
| 3901 Campbellton Rd SW Unit 3909-M06 Atlanta, GA | 2.0 | 1.5 | 1093 | $1,150 | $1.05 | 24d | 1 | 1.31mi |
| 3901 Campbellton Rd SW Unit 3901-L04 Atlanta, GA | 2.0 | 1.5 | 1093 | $1,140 | $1.04 | 24d | 1 | 1.31mi |
| 2164 Camp Ground Rd SW Atlanta, GA | 3.0 | 1.5 | 1128 | $1,595 | $1.41 | 24d | 1 | 1.46mi |
Listing history 26 events
-
2026-06-18days on market $174,900 Active 58 DOM
-
2026-06-17days on market $174,900 Active 57 DOM
-
2026-06-16days on market $174,900 Active 56 DOM
-
2026-06-15days on market $174,900 Active 55 DOM
-
2026-06-13days on market $174,900 Active 53 DOM
-
2026-06-13days on market $174,900 Active 52 DOM
-
2026-06-09statusdays on market $174,900 Active 49 DOM
-
2026-06-08days on market $174,900 Price Change 48 DOM
-
2026-06-07pricestatusdays on market $174,900 Price Change 47 DOM
-
2026-06-04days on market $184,900 Active 44 DOM
-
2026-06-03days on market $184,900 Active 43 DOM
-
2026-06-02days on market $184,900 Active 42 DOM
-
2026-06-01days on market $184,900 Active 41 DOM
-
2026-05-31days on market $184,900 Active 40 DOM
-
2026-04-21$184,900 New 627-char remark
Show marketing remark (627 chars)
This charming 3-bedroom classic home features a blend of traditional elements and modern comforts. The spacious living room welcomes you with and a cozy home feeling, while large windows allow natural light to fill the space. The adjacent dining area flows into a well-appointed kitchen. Each bedroom offers ample closet space, with the primary suite boasting direct access to a shared bathroom featuring a vanity and tub/shower combo. A convenient half bathroom serves guests and adds functionality to the living space. The outdoor area includes a spacious lawn and a deck, perfect for entertaining or enjoying quiet evenings.
-
2022-02-16soldstatus $342,500
-
2022-02-03price $1,225
-
2013-08-02soldstatus $33,000 Sold 41-char remark
Show marketing remark (41 chars)
Short Sale. Great area. Motivated Seller.
-
2013-07-01historical 41-char remark
Show marketing remark (41 chars)
Short Sale. Great area. Motivated Seller.
-
2013-06-21price $33,000 41-char remark
Show marketing remark (41 chars)
Short Sale. Great area. Motivated Seller.
-
2013-04-24status Active 41-char remark
Show marketing remark (41 chars)
Short Sale. Great area. Motivated Seller.
-
2013-04-23price $39,000 41-char remark
Show marketing remark (41 chars)
Short Sale. Great area. Motivated Seller.
-
2013-04-16status Pending 41-char remark
Show marketing remark (41 chars)
Short Sale. Great area. Motivated Seller.
-
2013-03-29$59,900 Active 41-char remark
Show marketing remark (41 chars)
Short Sale. Great area. Motivated Seller.
-
1991-07-31soldstatus $57,000
-
1983-05-13soldstatus $43,750
ⓘ Source: listings_history table (triggers on properties + properties_extension) + one-shot
backfill from property_details.listing_events for pre-trigger history.
Tax reassessment forecast GA · Resets to sale price
- Current annual tax
- $2,574 · $214/mo
- Projected year-2 tax
- $2,574 · $214/mo
- Expected delta
- $0/yr ($0/mo · 0.0%)
ⓘ Screening estimate from a state-policy table — verify with the county assessor before closing.
Climate risk First Street
- Flood 1/10 Low FEMA zone X (unshaded) · 0% chance over 30 yrs
- Wildfire 1/10 Low
- Heat 5/10 Major 7 d/yr ≥103°F today · 18 d/yr by 30 yrs out
- Wind 6/10 Major 27% chance of damaging wind over 30 yrs
- Air quality 3/10 Moderate 3 unhealthy d/yr today · 3 by 30 yrs out
Nearby sold comps map
Loading sold comps map…
Walkable amenities ~0.75 mi
Loading nearby amenities…
Taxation est. · year 1
- Rental income
- $21,572
- − Mortgage interest
- −$9,797
- − Property taxes
- −$2,574
- − Insurance
- −$874
- − Repairs & maintenance
- −$1,726
- − Management
- −$1,726
- − Depreciation
- −$5,088
- Taxable loss
- −$213
- Est. tax savings @ 24.0%
- +$51
- After-tax cash flow
- $2,638/yr
For passive investors: Depreciation is non-cash, so a rental often shows a tax loss while cash-flowing — sheltering income. Rental losses are passive: they offset passive income freely, and up to $25,000/yr can offset ordinary (W-2) income if you actively participate and your MAGI is under $100k (phasing out to $0 by $150k); unused losses carry forward. On sale, claimed depreciation is recaptured at up to 25%, and gains may owe capital-gains tax (a 1031 exchange can defer both). Figures are a year-1 estimate at your 24.0% rate — not tax advice; consult a CPA.
Schools (NCES district)
- District
- Atlanta Public Schools
- NCES district ID
- 1300120
- Math proficiency
- 28% ▼ -6.00%
- Reading proficiency
- 35% ▼ -2.00%
- Median HH income
- $48,306
- Composite
- 27.27/100
- National rank
- #7006
- State rank
- #80 of 174 in GA
Livability — Atlanta
- Score
- 83/100
- State rank
- #6
- US rank
- #919
Category grades
Schools grade is shown separately in the Schools card above.
Census & demographics
- Census place
- Atlanta, GA
- County
- Fulton County · 1,094,430 people
- City population
- 629,525
- Metro
- Atlanta-Sandy Springs-Alpharetta, GA
- Population (ZIP)
- 62,567
- Household income
- $62,623
- Rent vs Own
- Severe rent burden
- 3748.0
Population outlook (Fulton County) Hauer SSP2
- Today (2025)
- 1,203,707 people
- By 2030
- 1,299,706 · +8.0%
- By 2040
- 1,488,256 · +23.6%
- By 2050
- 1,664,580 · +38.3%
- By 2075
- 2,036,072 · +69.2%
- By 2100
- 2,222,402 · +84.6%
Race, ethnicity, and origin ACS 2023
- Neighborhood character
- Predominantly Black (94%)
- Race & ethnicity
- Black 94% Two or more races 3% Hispanic / Latino 2%
- Common ancestry
- Hispanic 1%
- Foreign-born
- 4% · Canada
- Languages at home
- 95% English-only · Spanish 1% French/Haitian/Cajun 1%
Political lean MEDSL · Fulton
- 2024 margin
- Solid D (+44.9) · D 71.9% · R 27.0% · Other 1.1%
- 2008→2024 swing
- +9.8pp toward D · 2008: 35.0pp · 2024: 44.9pp
- All cycles
- 2024: D+44.9 2020: D+46.4 2016: D+42.1 2012: D+29.6 2008: D+35.0
Not yet ingested
- Civics
- —
Market trends
- HPI YoY
- ▼ -106.38%
- Current HPI
- 204.5402
- Rent YoY
- ▲ 2.63%
- Metro
- Atlanta-Sandy Springs-Alpharetta, GA
- State GDP YoY
- ▲ 2.66%
- F500 in state
- 28
Industry mix (Fortune 500 HQ in GA)
| Industry | F500 HQs | Revenue |
|---|---|---|
| Paper / Packaging | 2 | $29B |
|
||
| Retail | 1 | $160B |
|
||
| Transportation / Logistics | 1 | $91B |
|
||
| Airlines | 1 | $62B |
|
||
| Consumer Goods | 1 | $47B |
|
||
| Utilities | 1 | $25B |
|
||
Price history
+322.6% since first listed12 events — show timeline
- 2026-04-21 Listed $184,900 GAMLS
- 2022-02-16 Sold (Public Records) $342,500 Public Records
- 2022-02-03 Price Changed $1,225 RENT.
- 2013-08-02 Sold (MLS) $33,000 FMLS
- 2013-07-01 Listing Removed — FMLS
- 2013-06-21 Price Changed $33,000 FMLS
- 2013-04-24 Relisted — FMLS
- 2013-04-23 Price Changed $39,000 FMLS
- 2013-04-16 Pending — FMLS
- 2013-03-29 Listed $59,900 FMLS
- 1991-07-31 Sold (Public Records) $57,000 Public Records
- 1983-05-13 Sold (Public Records) $43,750 Public Records
Property tax history
+6.4%/yrLatest (2025): $2,574 · -0.1% YoY. Source: county tax records.
Cash-flow waterfall
monthlySold comps — $/sqft
last 12 mo · ≤1 miLoading sold comps…