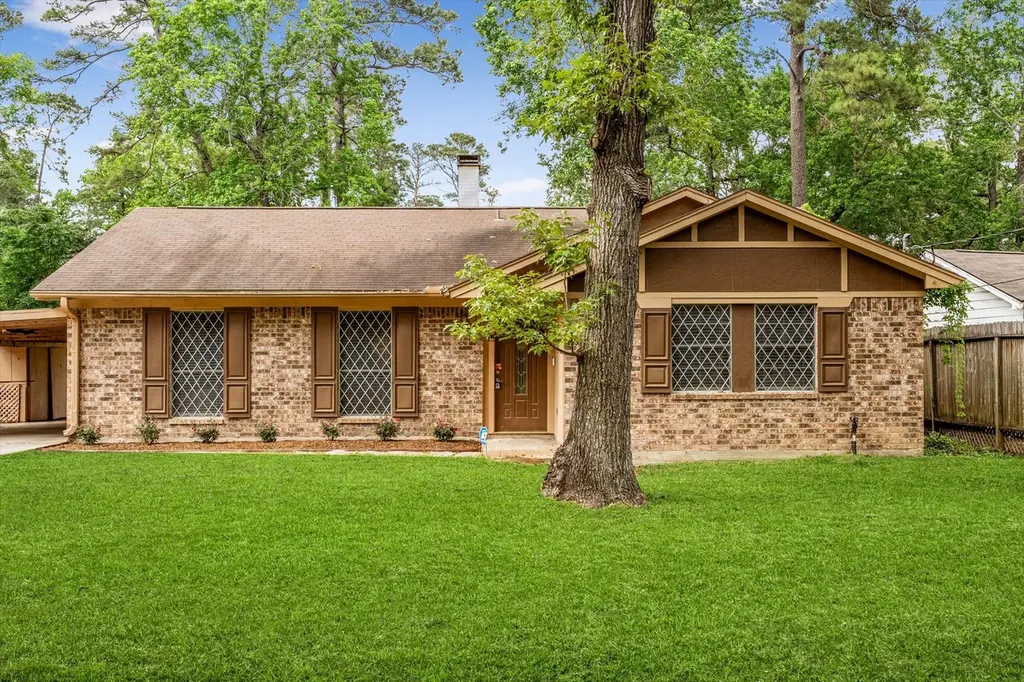
12118 Quail Hollow Ln · Pinehurst, TX
Flood risk 5/10 · Moderate
- FEMA flood zone
- X (shaded)
- Chance of flooding over 30 yrs
- 0.51%
- Est. flood insurance / yr
- $507 – $1,088
Fire risk 5/10 · Moderate
- Est. fire insurance / yr
- $1,222 – $2,270
Heat risk 8/10 · Major
- Hot days now (above 110°F)
- 7 days/yr
- Hot days in 30 yrs
- 23 days/yr
Wind risk 8/10 · Major
- Chance of severe wind over 30 yrs
- 99.0%
Air-quality risk 2/10 · Minimal
- Unhealthy air days now
- 2 days/yr
- Unhealthy air days in 30 yrs
- 2 days/yr
Risk factors via First Street. Map © Google.
Why this score? — see what drove the C grade
The composite is a weighted blend of 9 inputs, each scored 0–100. Each bar is that input's sub-score; the figure is the points it added to the 100-point composite (weight × sub-score).
- Cash flow +18.4/30.0
- ARV discount +15.0/15.0
- DSCR +5.8/10.0
- Schools +5.8/10.0
- 1% rule +4.9/10.0
- Livability +2.8/5.0
- Rent growth +2.5/5.0
- Condition / age +2.5/5.0
- Appreciation +0.0/10.0
$214,900
🖨 Deal sheet 📄 Offer letter ✓ Due diligence
Listing remarks
Amazing location! 12118 Quail Hollow sits on over 1/2 acre of land and features a Whole Home Generator! This charming ranch-style home is 3-bedrooms, 1.5-bath, and sits on just over a 1/2 acre fenced lot. New survey just done and included. With 1,383 sq ft, the home has an open feel, a spacious layout, and a kitchen that flows right into the living area, perfect for everyday living and get-togethers. The primary bedroom is a cozy retreat, and the extra rooms are great for guests or a home office. Enjoy the big yard with plenty of room to spread out. Washer and dryer included. Awesome location right off Hwy 249 with quick access to Tomball, Magnolia, Hwy 99 and so much more. Incredible oppo
Key facts
- 0.52 acre lot
- 4 parking spots
- Community pool
Property features AI
Finance
- HOA & community: Cripple Creek POA with an annual fee of $125; Community pool; Gutters
Exterior
- Parking: Attached carport; Carport with 4 spaces
- Security: Smoke detector(s)
- Utilities: Public water; Public sewer and septic tank
- Home design: Residential property; Faces south; Built in 1978; Slab foundation
- Construction: Brick construction; Composition roof
- Exterior features: Deck; Patio; Partial fencing; Corner lot; Subdivision setting; Wooded lot
Interior
- Kitchen: Dishwasher; Disposal; Microwave
- Bedrooms: Three bedrooms on the first floor (approx. 15x13, 13x9, 10x9)
- Flooring: Carpet; Tile
- Bathrooms: One full bathroom; One half bathroom
- Heating & cooling: Central heating (electric); Central air (electric)
- Interior features: High ceilings; Kitchen/family room combo; Kitchen/dining combo; Pantry; Tub with shower; Wood-burning fireplace
- Laundry & utility: Washer hookup; Electric dryer hookup
Neighborhood map
What this means for you Summary
Snapshot
- This is a 3-bed/1.5-bath single-family listed at $215k.
Deal economics
- At list price, monthly cash flow is $202 ($2k/yr) — positive.
- The deal already cash-flows at list — no discount required.
- To meet the 1% rule (rent ≥ 1% of price), the offer needs to be $214k (0.6% below list).
- Recommended offer: $212k (1.5% below list) — sets the bar for market timing.
- Cap rate 7.4% vs local median 2.0% in Pinehurst — top-decile yield for the area; either an underpriced asset or a hidden risk that comps aren't pricing in. Stress-test before assuming the spread holds.
Location & tenants
- Location reads 55/100 on livability (#1,350 in TX) — a working-class tenant base; expect higher turnover. Strengths: cost of living A+, housing B+; Watch: employment C-, crime D-, amenities F.
- Tomball ISD (suburban): math 66% / reading 63% proficiency, ranked #25 of 826 in TX (top 3%) — acceptable for families but not a draw, mixed tenant base, ~2y average lease.
- Zoned schools: Decker Prairie El (math 29% / reading 34%, grade F, #2,396 of 4,322 statewide, top 56%, 755 students, 40% FRL); Tomball H S (math 74% / reading 69%, grade B+, #111 of 1,632 statewide, top 7%, 2,801 students, 34% FRL).
- Zoned-school proficiency averages 52% at this address vs 64% district-wide (-13 pts) — the specific schools serving this property underperform the Tomball ISD average; the district grade overstates school quality for this exact location.
- Market conditions: 170 active listings in the ZIP; 13,259 units permitted in Montgomery County in 2024 (1,402 in 5+ unit buildings).
Forward outlook
- Local home prices are declining (-3.0%/yr); year-one equity from $1k of loan paydown is wiped out by about $6k of value loss. Plan a longer hold.
- Montgomery County population projected at +65% by 2050 — long-run rental-demand tailwind backs the buy-and-hold thesis.
Negotiation context
- It's been on market 17 days — a 2% lower offer ($212k) is reasonable based on typical stale-listing flexibility.
- 2 sale attempts with the ask held roughly flat each time — persistent listings suggest the price (not the market) is what's stuck; bring a comps-based counter.
- Current owner paid $59k; list at $215k implies a 265% gain — meaningful room to come down on a strong offer.
Risks & watch-outs
- Climate carrying-cost: moderate flood risk; severe wind risk, 99% chance of damaging wind over 30y; moderate wildfire risk; extreme-heat days projected 7→23/yr by 2055 (HVAC capex compounding) — expect insurance premiums to compound above CPI over the hold.
Questions for the listing agent
- Built in 1978 — when were the roof, HVAC, electrical panel, plumbing, and water heater last replaced?
- What does the HOA fee cover, when was the last increase, and are there any pending special assessments or reserve-fund shortfalls?
- Is there a deadline driving the sale (1031 exchange, divorce, estate, relocation)? That informs how much negotiation room exists.
- Schools are F-rated, which usually means shorter tenancies and higher turnover. Who's the typical renter profile here, and what's been the actual vacancy rate?
- Crime grade is D in this area — have there been break-ins, vandalism, or insurance claims at this property in the last 3 years? What carrier currently insures it and at what premium?
- What's the average days-on-market for RENTAL listings here right now (not sales)? A rising rental-DOM trend means longer vacancies and softer asking-rent achievability than the comps imply.
- What's the recent tenant-quality profile in this submarket — average credit score on applications, eviction rate, late-payment / NSF rate, and stable-employment percentage? A property-management company in the area should have these aggregated.
- How much new for-sale + rental construction is in the pipeline within 1–3 miles? Heavy new supply typically softens prices + rents 12–24 months out; constrained supply supports both.
Investment metrics
- 1% rule
- 0.99% ✗
- Cap rate
- 7.42%
- Cash-on-cash
- 4.03%
- DSCR
- 1.18
- GRM
- 8.4
CMA / ARV
- ARV (median comp)
- $259,906
- List price
- $214,900
- Delta
- -17.32%
- Verdict
- UNDERPRICED
- Comps
- 20 within 1.0 mi
Show comp detail 12 sales within ~0.75 mi
| Address | Dist | Beds/Ba | Sqft | Sold | Price | $/sf | Match |
|---|---|---|---|---|---|---|---|
| 12118 Quail Hollow Ln | 0.00mi | 3/1.5 | 1,383 (0%) | 0mo | $214,900 | $155 | 100 |
| 12035 Fairquarter Ln | 0.27mi | 3/2.0 | 1,414 (+2%) | 1mo | $240,000 | $170 | 81 |
| 12050 Quartersawn Ln | 0.19mi | 3/2.0 | 1,556 (+12%) | 0mo | $269,000 | $173 | 68 |
| 12038 Powderhorn Ln | 0.29mi | 3/2.0 | 1,556 (+12%) | 5mo | $265,000 | $170 | 59 |
| 12063 Quartersawn Ln | 0.20mi | 3/2.0 | 1,556 (+12%) | 13mo | $264,990 | $170 | 57 |
| 12035 Powderhorn Ln | 0.32mi | 3/2.0 | 1,556 (+12%) | 9mo | $260,000 | $167 | 55 |
| 32002 Sue Ln | 0.65mi | 3/2.0 | 1,464 (+6%) | 6mo | $260,000 | $178 | 53 |
| 11843 Belle Ct | 0.66mi | 3/2.0 | 1,534 (+11%) | 2mo | $249,900 | $163 | 48 |
| 11726 Elizabeth Ct | 0.57mi | 3/2.0 | 1,216 (-12%) | 5mo | $223,000 | $183 | 47 |
| 32211 Decker Oaks Dr | 0.64mi | 3/2.0 | 1,556 (+12%) | 2mo | $249,300 | $160 | 46 |
| 32214 Annice Ln | 0.65mi | 3/2.0 | 1,530 (+11%) | 6mo | $240,000 | $157 | 45 |
| 11727 Elizabeth Ct | 0.59mi | 3/2.0 | 1,565 (+13%) | 18mo | $252,500 | $161 | 33 |
Match score weights: distance 35% · size 25% · config 20% · recency 20%. Top-matched comps best support the ARV.
Projected returns pro-forma
-3.0% appreciation · 3.0% rent growth · sell at horizon
- IRR
- -10.0%
- Equity multiple
- 0.64×
- Total profit
- $-21,927
- Equity at exit
- $32,042
- IRR
- -0.6%
- Equity multiple
- 0.96×
- Total profit
- $-2,400
- Equity at exit
- $18,581
Cash invested: $60,172 (down + closing). Projections, not guarantees.
Landlord ↔ Tenant lean methodology
- Overall (STATE)
- 87 Strongly Landlord-Friendly
- State Texas
- 87 Strongly Landlord-Friendly · R+5
- County
- — inherits STATE
- City
- — inherits STATE
ZIP-level market 77362
- Home prices YoY
- -29.1%
- Active inventory
- 170
- Price-to-rent
- 8.4×
Monthly cashflow live
- Estimated rent
- $2,135 medium interval (Pro) →
- Mortgage (P&I)
- −$1,127
- Tax from tax record
- −$258 /mo · $3,101/yr
- Insurance
- −$90
- HOA
- −$10
- Vacancy / Maint / Mgmt
- −$448
- Net cashflow
- $202
Break-even live
UW: 25.0% down · 7.5% · 30yr · 1.5% tax · 5.0% vac · 8.0% maint · 8.0% mgmt
Financing live
Cash to close
- Down payment
- $53,725
- Closing costs
- $6,447
- Reserves months
- —
- Total cash needed
- —
Loan-product check · same deal, 3 products live
Conventional
25% down · 7.5% · 30yr
- Down + closing
- —
- Monthly P&I
- —
- Monthly cashflow
- —
- DSCR
- —
- Eligible?
- —
Personal DTI + credit; lowest rate.
DSCR
20% down · 8.5% · 30yr
- Down + closing
- —
- Monthly P&I
- —
- Monthly cashflow
- —
- DSCR
- —
- Eligible?
- —
No personal income docs; deal must DSCR.
Hard money
10% down · 12.0% · 12mo
- Down + closing
- —
- Monthly P&I
- —
- Monthly cashflow
- —
- DSCR
- —
- Eligible?
- —
Short-term bridge; refi at stabilization.
HOA detail
- Monthly dues
- $10 · $120/yr
Listing history 8 events
-
2026-05-15status Pending 745-char remark
-
2026-05-09status Pending 745-char remark
-
2026-05-04status Active 745-char remark
-
2026-04-30status Pending 745-char remark
-
2026-04-28$214,900 Active 745-char remark
-
2026-04-24historical $214,900 745-char remark
-
2001-11-30soldstatus
-
1992-01-14soldstatus $58,955
ⓘ Source: listings_history table (triggers on properties + properties_extension) + one-shot
backfill from property_details.listing_events for pre-trigger history.
Tax reassessment forecast TX · Resets to sale price
- Current annual tax
- $3,101 · $258/mo
- Projected year-2 tax
- $3,933 · $328/mo
- Expected delta
- +$832/yr (+$69/mo · 26.8%)
ⓘ Screening estimate from a state-policy table — verify with the county assessor before closing.
Climate risk First Street
- Flood 5/10 Major FEMA zone X (shaded) · 51% chance over 30 yrs
- Wildfire 5/10 Major
- Heat 8/10 Severe 7 d/yr ≥110°F today · 23 d/yr by 30 yrs out
- Wind 8/10 Severe 99% chance of damaging wind over 30 yrs
- Air quality 2/10 Low 2 unhealthy d/yr today · 2 by 30 yrs out
Nearby sold comps map
Loading sold comps map…
Walkable amenities ~0.75 mi
Loading nearby amenities…
Taxation est. · year 1
- Rental income
- $25,623
- − Mortgage interest
- −$12,038
- − Property taxes
- −$3,101
- − Insurance
- −$1,074
- − Repairs & maintenance
- −$2,050
- − Management
- −$2,050
- − HOA
- −$120
- − Depreciation
- −$6,252
- Taxable loss
- −$1,061
- Est. tax savings @ 24.0%
- +$255
- After-tax cash flow
- $2,678/yr
For passive investors: Depreciation is non-cash, so a rental often shows a tax loss while cash-flowing — sheltering income. Rental losses are passive: they offset passive income freely, and up to $25,000/yr can offset ordinary (W-2) income if you actively participate and your MAGI is under $100k (phasing out to $0 by $150k); unused losses carry forward. On sale, claimed depreciation is recaptured at up to 25%, and gains may owe capital-gains tax (a 1031 exchange can defer both). Figures are a year-1 estimate at your 24.0% rate — not tax advice; consult a CPA.
Schools (NCES district)
- District
- Tomball ISD
- NCES district ID
- 4842960
- Math proficiency
- 66% ▼ -6.00%
- Reading proficiency
- 63% ▼ -4.00%
- Median HH income
- $86,552
- Composite
- 58.32/100
- National rank
- #1014
- State rank
- #25 of 826 in TX
Livability — Pinehurst
- Score
- 55/100
- State rank
- #1350
- US rank
- #23272
Category grades
Schools grade is shown separately in the Schools card above.
Census & demographics
- Population (ZIP)
- 7,474
Population outlook (Montgomery County) Hauer SSP2
- Today (2025)
- 713,896 people
- By 2030
- 805,263 · +12.8%
- By 2040
- 992,708 · +39.1%
- By 2050
- 1,179,590 · +65.2%
- By 2075
- 1,628,084 · +128.1%
- By 2100
- 1,937,880 · +171.5%
Race, ethnicity, and origin ACS 2023
- Neighborhood character
- Predominantly White (68%)
- Race & ethnicity
- White 68% Hispanic / Latino 20% Two or more races 10% Black 7% Asian 3%
- Hispanic origin (detail)
- Mexican 15%
- Common ancestry
- Lithuanian 4% Slovak 4% Serbian 2%
- Foreign-born
- 10% · Canada, Jamaica
- Languages at home
- 78% English-only · Spanish 18% Other Indo-European 2%
Political lean MEDSL · Montgomery
- 2024 margin
- Solid R (+45.5) · D 26.8% · R 72.3%
- 2008→2024 swing
- +7.2pp toward D · 2008: -52.7pp · 2024: -45.5pp
- All cycles
- 2024: R+45.5 2020: R+43.8 2016: R+51.4 2012: R+60.7 2008: R+52.7
Not yet ingested
- Civics
- —
Market trends
- HPI YoY
- ▼ -116.65%
- Current HPI
- 284.6412
- Rent YoY
- —
- Metro
- —
- State GDP YoY
- ▲ 3.95%
- F500 in state
- 110
Industry mix (Fortune 500 HQ in TX)
| Industry | F500 HQs | Revenue |
|---|---|---|
| Energy | 16 | $1,198B |
|
||
| Technology | 5 | $198B |
|
||
| Engineering / Construction | 4 | $72B |
|
||
| Energy Services | 3 | $60B |
|
||
| Utilities | 3 | $41B |
|
||
| Healthcare | 2 | $330B |
|
||
Price history
+264.5% since first listed9 events — show timeline
- 2026-06-09 Sold (MLS) — HARMLS
- 2026-05-15 Pending — HARMLS
- 2026-05-09 Pending — HARMLS
- 2026-05-04 Relisted — HARMLS
- 2026-04-30 Pending — HARMLS
- 2026-04-28 Listed $214,900 HARMLS
- 2026-04-24 Coming Soon $214,900 HARMLS
- 2001-11-30 Sold (Public Records) — Public Records
- 1992-01-14 Sold (Public Records) $58,955 Public Records
Property tax history
+11.5%/yrLatest (2025): $3,101 · +9.9% YoY. Source: county tax records.
Cash-flow waterfall
monthlySold comps — $/sqft
last 12 mo · ≤1 miLoading sold comps…