 Multi-family
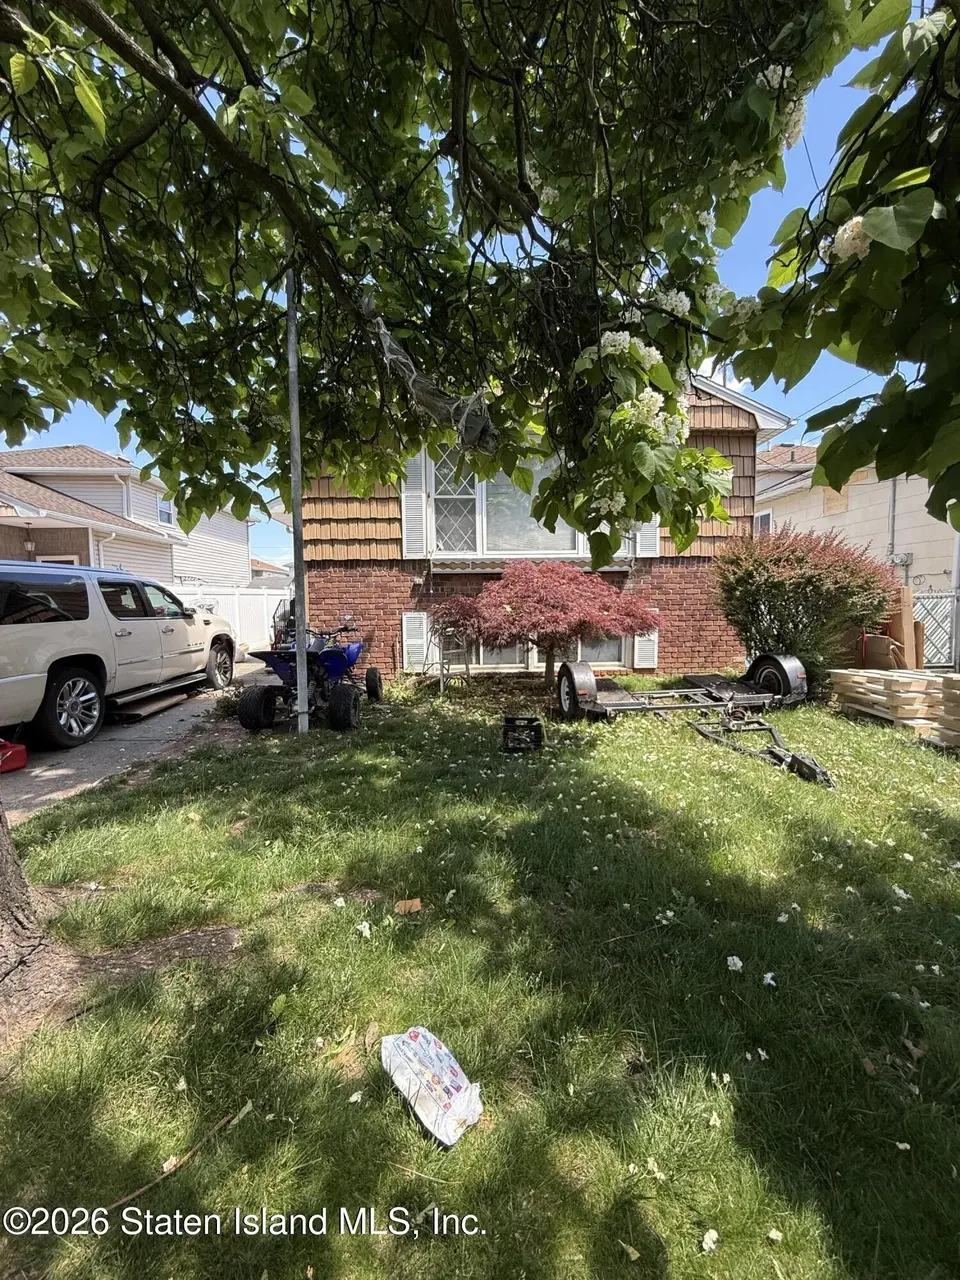
31 Oliver Pl · New York, NY
Flood risk 1/10 · Minimal
- FEMA flood zone
- X (unshaded)
- Chance of flooding over 30 yrs
- 0.0%
- Est. flood insurance / yr
- $507 – $1,088
Fire risk 4/10 · Minor
- Est. fire insurance / yr
- $691 – $1,283
Heat risk 7/10 · Major
- Hot days now (above 98°F)
- 7 days/yr
- Hot days in 30 yrs
- 15 days/yr
Wind risk 6/10 · Moderate
- Chance of severe wind over 30 yrs
- 51.0%
Air-quality risk 4/10 · Minor
- Unhealthy air days now
- 5 days/yr
- Unhealthy air days in 30 yrs
- 6 days/yr
Risk factors via First Street. Map © Google.
Why this score? — see what drove the C- grade
The composite is a weighted blend of 9 inputs, each scored 0–100. Each bar is that input's sub-score; the figure is the points it added to the 100-point composite (weight × sub-score).
- Cash flow +19.5/30.0
- ARV discount +7.5/15.0
- 1% rule +6.6/10.0
- DSCR +6.2/10.0
- Schools +5.0/10.0
- Livability +3.8/5.0
- Rent growth +3.5/5.0
- Condition / age +2.5/5.0
- Appreciation +0.0/10.0
$299,000
🖨 Deal sheet 📄 Offer letter ✓ Due diligence
Multi-family units
County records classify this as Multi-Family (2-4 Unit). Listing-text estimate: 1 unit. estimate disagrees with records
Listing remarks
Cash offers only. Do not contact the listing agent until a cash-for-keys agreement has been negotiated with the current squatters. Prospective buyers are encouraged to speak directly with the occupants and walk the property to assess its condition and estimate renovation costs. Property is being sold as a short sale and is subject to lender approval. Sold strictly "as is. " Seller and listing broker make no representations or warranties regarding the condition of the property or the functionality of any systems, appliances, or components.
Key facts
- 4,200 sq ft lot
- Garage
- Built 1970
Property features AI
Finance
- Other: Property condition listed as poor
- Financial info: Multi-family: 2 units
Exterior
- Parking: 1 garage space (attached garage: no)
- Utilities: 110V electric service
- Home design: Single-story building; Multi-family property with 2 units
- Construction: Vinyl siding construction; Built approximately (year not specified)
- Exterior features: Vinyl siding; Lot approximately 0.1 acre (40 x 105); Zoned R3X
Interior
- Bedrooms: Unit 1: 3 bedrooms; Unit 2: 1 bedroom
- Bathrooms: 2 total bathrooms (1 full, 1 half)
- Heating & cooling: Natural gas hot water heating; Has heating; Has cooling
- Interior features: Central air conditioning; Unfinished basement
Neighborhood map
What this means for you Summary
Snapshot
- This is a 3-bed/1.5-bath multifamily listed at $299k.
Deal economics
- At list price, monthly cash flow is $342 ($4k/yr) — positive.
- The deal already cash-flows at list — no discount required.
- Meets the 1% rule at list price ($3k rent vs $299k).
- Recommended offer: $295k (1.5% below list) — sets the bar for market timing.
- Cap rate 7.7% vs local median 2.6% in New York — top-decile yield for the area; either an underpriced asset or a hidden risk that comps aren't pricing in. Stress-test before assuming the spread holds.
Location & tenants
- Location reads 75/100 on livability (#268 in NY, #4,188 nationally) — a middle-class / working-renter tenant base. Strengths: amenities A+, commute A+, health & safety A; Watch: crime F, cost of living F.
- Market conditions: Rents rising (+3.9%/yr); 487 active listings in the ZIP; 3 comparable units currently listed for rent nearby; rentals at typical pace (median 25d on market — plan ~3-4 weeks tenant-placement turnaround); solid renter incomes; 480 units permitted in Richmond County in 2024 (22 in 5+ unit buildings).
- This rent runs 40% of the median local income ($105k/yr) — at the standard rent-burdened threshold; future hikes will face affordability resistance.
Forward outlook
- Local home prices are declining (-3.0%/yr); year-one equity from $2k of loan paydown is wiped out by about $9k of value loss. Plan a longer hold.
- Richmond County population projected to shrink 5% by 2050 — rents likely to lag national; underwrite the cash flow, not the appreciation.
Negotiation context
- It's been on market 20 days — a 2% lower offer ($295k) is reasonable based on typical stale-listing flexibility.
Risks & watch-outs
- Watch-outs: property tax is 2.8% of price.
- Climate carrying-cost: major wind risk, 51% chance of damaging wind over 30y; extreme-heat days projected 7→15/yr by 2055 (HVAC capex compounding) — expect insurance premiums to compound above CPI over the hold.
Questions for the listing agent
- Built in 1970 — when were the roof, HVAC, electrical panel, plumbing, and water heater last replaced?
- Property tax is high relative to price — has the assessment been appealed recently, and will the sale trigger a re-assessment?
- Is there a deadline driving the sale (1031 exchange, divorce, estate, relocation)? That informs how much negotiation room exists.
- Schools are B-rated — typically a magnet for longer-tenancy family renters. What's the average tenant stay here, and is there a school-zone premium baked into asking?
- Crime grade is F in this area — have there been break-ins, vandalism, or insurance claims at this property in the last 3 years? What carrier currently insures it and at what premium?
- What's the average days-on-market for RENTAL listings here right now (not sales)? A rising rental-DOM trend means longer vacancies and softer asking-rent achievability than the comps imply.
- What's the recent tenant-quality profile in this submarket — average credit score on applications, eviction rate, late-payment / NSF rate, and stable-employment percentage? A property-management company in the area should have these aggregated.
- How much new apartment / multifamily construction is in the pipeline within 1–3 miles? Heavy new supply (>2% of stock underway) typically softens rents 12–24 months out; light construction supports rent growth.
Investment metrics
- 1% rule
- 1.16% ✓
- Cap rate
- 7.67%
- Cash-on-cash
- 4.90%
- DSCR
- 1.22
- GRM
- 7.2
CMA / ARV
- ARV (on-the-fly)
- $982,800
- Comps found
- 6
Show comp detail 6 sales within ~0.75 mi
| Address | Dist | Beds/Ba | Sqft | Sold | Price | $/sf | Match |
|---|---|---|---|---|---|---|---|
| 8 Nadal Pl | 0.10mi | 4/2.0 (+1) | 2,100 (0%) | 8mo | $970,000 | $462 | 82 |
| 147 Kirshon Ave | 0.21mi | 4/3.5 (+1) | 2,114 (+1%) | 8mo | $990,000 | $468 | 69 |
| 11 Firth Rd | 0.16mi | 3/4.5 | 1,960 (-7%) | 2mo | $995,000 | $508 | 68 |
| 44 Oliver Pl | 0.03mi | 4/2.5 (+1) | 1,980 (-6%) | 16mo | $865,000 | $437 | 67 |
| 273 Arlene St | 0.11mi | 4/2.5 (+1) | 2,244 (+7%) | 10mo | $970,000 | $432 | 66 |
| 63 Dawson Cir | 0.63mi | 4/5.0 (+1) | 2,320 (+10%) | 2mo | $1,100,000 | $474 | 33 |
Match score weights: distance 35% · size 25% · config 20% · recency 20%. Top-matched comps best support the ARV.
Projected returns pro-forma
-3.0% appreciation · 3.93% rent growth · sell at horizon
- IRR
- -7.4%
- Equity multiple
- 0.72×
- Total profit
- $-23,130
- Equity at exit
- $44,582
- IRR
- 3.6%
- Equity multiple
- 1.27×
- Total profit
- $22,668
- Equity at exit
- $25,852
Cash invested: $83,720 (down + closing). Projections, not guarantees.
Landlord ↔ Tenant lean methodology
- Overall (CITY)
- 0 Strongly Tenant-Friendly
- State New York
- 15 Strongly Tenant-Friendly · D+10
- County
- — inherits STATE
- City New York
- 0 Strongly Tenant-Friendly · D+34
ZIP-level market 10314
- Rents YoY
- 3.9%
- Active inventory
- 487
- Price-to-rent
- 7.2×
Monthly cashflow live
- Estimated rent
- $3,472 medium interval (Pro) →
- Mortgage (P&I)
- −$1,568
- Tax from tax record
- −$708 /mo · $8,498/yr
- Insurance
- −$125
- HOA
- −$0
- Vacancy / Maint / Mgmt
- −$729
- Net cashflow
- $342
Break-even live
UW: 25.0% down · 7.5% · 30yr · 1.5% tax · 5.0% vac · 8.0% maint · 8.0% mgmt
Financing live
Cash to close
- Down payment
- $74,750
- Closing costs
- $8,970
- Reserves months
- —
- Total cash needed
- —
Loan-product check · same deal, 3 products live
Conventional
25% down · 7.5% · 30yr
- Down + closing
- —
- Monthly P&I
- —
- Monthly cashflow
- —
- DSCR
- —
- Eligible?
- —
Personal DTI + credit; lowest rate.
DSCR
20% down · 8.5% · 30yr
- Down + closing
- —
- Monthly P&I
- —
- Monthly cashflow
- —
- DSCR
- —
- Eligible?
- —
No personal income docs; deal must DSCR.
Hard money
10% down · 12.0% · 12mo
- Down + closing
- —
- Monthly P&I
- —
- Monthly cashflow
- —
- DSCR
- —
- Eligible?
- —
Short-term bridge; refi at stabilization.
Rent comps 3 comps
| Address | Beds | Baths | Sqft | Rent | $/sqft | DOM | Units | Dist |
|---|---|---|---|---|---|---|---|---|
| 581 W Caswell Ave Unit 2 Staten Island, NY | 3.0 | 2.0 | 2292 | $3,200 | $1.40 | 15d | 1 | 0.60mi |
| 110 Spartan Ave Unit 2 Staten Island, NY | 3.0 | 1.5 | 2400 | $3,500 | $1.46 | 24d | 1 | 0.95mi |
| 147 Vedder Ave Unit 1 Staten Island, NY | 3.0 | 3.0 | 2188 | $3,800 | $1.74 | 24d | 1 | 1.24mi |
Listing history 13 events
-
2026-06-18days on market $299,000 Active 20 DOM
-
2026-06-17days on market $299,000 Active 19 DOM
-
2026-06-16days on market $299,000 Active 18 DOM
-
2026-06-15days on market $299,000 Active 17 DOM
-
2026-06-13days on market $299,000 Active 15 DOM
-
2026-06-09days on market $299,000 Active 11 DOM
-
2026-06-08days on market $299,000 Active 10 DOM
-
2026-06-08days on market $299,000 Active 9 DOM
-
2026-06-04days on market $299,000 Active 6 DOM
-
2026-06-03days on market $299,000 Active 5 DOM
-
2026-06-02days on market $299,000 Active 4 DOM
-
2026-06-01days on market $299,000 Active 3 DOM
-
2026-05-31days on market $299,000 Active 2 DOM
ⓘ Source: listings_history table (triggers on properties + properties_extension) + one-shot
backfill from property_details.listing_events for pre-trigger history.
Tax reassessment forecast NY · Partial reset (capped growth)
- Current annual tax
- $8,498 · $708/mo
- Projected year-2 tax
- $8,498 · $708/mo
- Expected delta
- $0/yr ($0/mo · 0.0%)
ⓘ Screening estimate from a state-policy table — verify with the county assessor before closing.
Climate risk First Street
- Flood 1/10 Low FEMA zone X (unshaded) · 0% chance over 30 yrs
- Wildfire 4/10 Moderate
- Heat 7/10 Severe 7 d/yr ≥98°F today · 15 d/yr by 30 yrs out
- Wind 6/10 Major 51% chance of damaging wind over 30 yrs
- Air quality 4/10 Moderate 5 unhealthy d/yr today · 6 by 30 yrs out
Nearby sold comps map
Loading sold comps map…
Walkable amenities ~0.75 mi
Loading nearby amenities…
Taxation est. · year 1
- Rental income
- $41,663
- − Mortgage interest
- −$16,749
- − Property taxes
- −$8,498
- − Insurance
- −$1,495
- − Repairs & maintenance
- −$3,333
- − Management
- −$3,333
- − Depreciation
- −$8,698
- Taxable loss
- −$443
- Est. tax savings @ 24.0%
- +$106
- After-tax cash flow
- $4,211/yr
For passive investors: Depreciation is non-cash, so a rental often shows a tax loss while cash-flowing — sheltering income. Rental losses are passive: they offset passive income freely, and up to $25,000/yr can offset ordinary (W-2) income if you actively participate and your MAGI is under $100k (phasing out to $0 by $150k); unused losses carry forward. On sale, claimed depreciation is recaptured at up to 25%, and gains may owe capital-gains tax (a 1031 exchange can defer both). Figures are a year-1 estimate at your 24.0% rate — not tax advice; consult a CPA.
Schools (NCES district)
No district data.
Livability — New York
- Score
- 75/100
- State rank
- #268
- US rank
- #4188
Category grades
Schools grade is shown separately in the Schools card above.
Census & demographics
- Census place
- New York, NY
- County
- Richmond County · 404,174 people
- City population
- 7,731,280
- Metro
- New York-Newark-Jersey City, NY-NJ-PA
- Population (ZIP)
- 93,915
- Household income
- $104,613
- Rent vs Own
- Severe rent burden
- 2168.0
Population outlook (Richmond County) Hauer SSP2
- Today (2025)
- 482,784 people
- By 2030
- 481,831 · -0.2%
- By 2040
- 473,159 · -2.0%
- By 2050
- 457,242 · -5.3%
- By 2075
- 408,029 · -15.5%
- By 2100
- 341,459 · -29.3%
Race, ethnicity, and origin ACS 2023
- Neighborhood character
- Diverse neighborhood (Simpson 0.58)
- Race & ethnicity
- White 60% Asian 19% Hispanic / Latino 15% Two or more races 8% Black 4%
- Hispanic origin (detail)
- Mexican 3% Puerto Rican 7% Dominican 1%
- Common ancestry
- Romanian 4% Scotch-Irish 2% Subsaharan African 1%
- Foreign-born
- 28% · Canada, China, South Korea
- Languages at home
- 61% English-only · Spanish 9% Chinese 7% Other Indo-European 7%
Political lean MEDSL · Richmond
- 2024 margin
- Strong R (+29.8) · D 35.1% · R 64.9%
- 2008→2024 swing
- -25.7pp toward R · 2008: -4.0pp · 2024: -29.8pp
- All cycles
- 2024: R+29.8 2020: R+14.9 2016: R+16.8 2012: D+0.8 2008: R+4.0
Not yet ingested
- Civics
- —
Market trends
- HPI YoY
- ▼ -553.73%
- Current HPI
- 378.3872
- Rent YoY
- ▲ 3.93%
- Metro
- New York-Newark-Jersey City, NY-NJ-PA
- State GDP YoY
- ▲ 2.60%
- F500 in state
- 92
Industry mix (Fortune 500 HQ in NY)
| Industry | F500 HQs | Revenue |
|---|---|---|
| Financial Services | 10 | $950B |
|
||
| Consumer Goods | 9 | $162B |
|
||
| Insurance | 4 | $225B |
|
||
| Telecommunications | 2 | $144B |
|
||
| Pharmaceuticals | 2 | $112B |
|
||
| Media / Entertainment | 2 | $69B |
|
||
Price history
1 event — show timeline
- 2026-05-29 Listed $299,000 SIBORMLS
Property tax history
+5.1%/yrLatest (2025): $8,498 · +6.0% YoY. Source: county tax records.
Cash-flow waterfall
monthlySold comps — $/sqft
last 12 mo · ≤1 miLoading sold comps…