 Multi-family
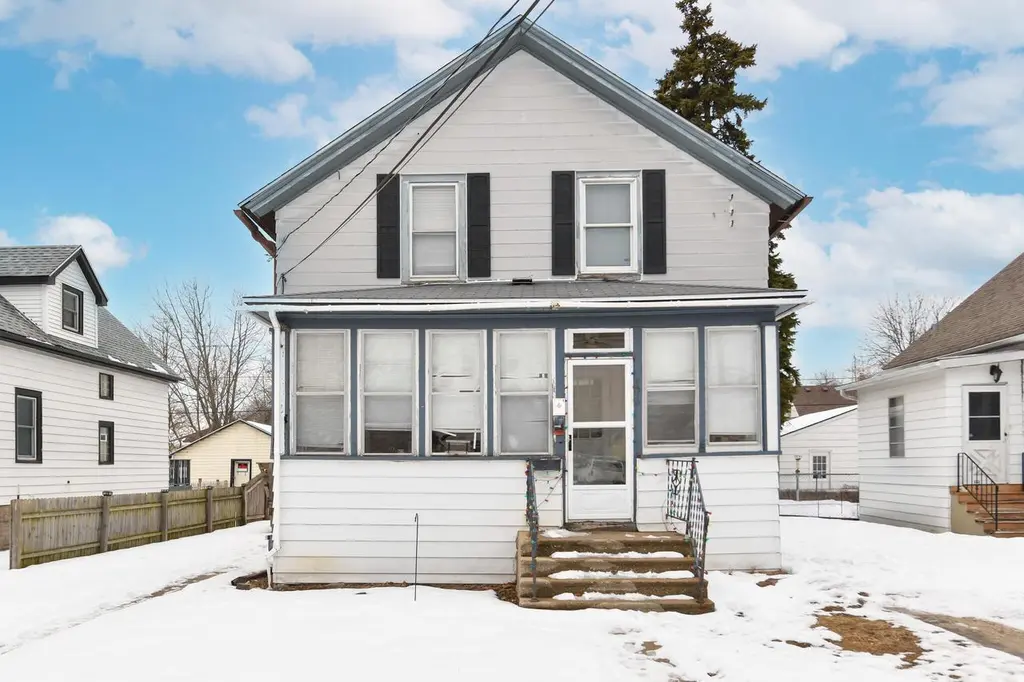
6810 23rd Ave · Kenosha, WI
Flood risk 3/10 · Minor
- FEMA flood zone
- X (unshaded)
- Chance of flooding over 30 yrs
- 0.1%
- Est. flood insurance / yr
- $473 – $860
Fire risk 1/10 · Minimal
- Est. fire insurance / yr
- $636 – $1,182
Heat risk 2/10 · Minimal
- Hot days now (above 96°F)
- 7 days/yr
- Hot days in 30 yrs
- 14 days/yr
Wind risk 2/10 · Minimal
- Chance of severe wind over 30 yrs
- —
Air-quality risk 3/10 · Minor
- Unhealthy air days now
- 2 days/yr
- Unhealthy air days in 30 yrs
- 3 days/yr
Risk factors via First Street. Map © Google.
Why this score? — see what drove the C- grade
The composite is a weighted blend of 9 inputs, each scored 0–100. Each bar is that input's sub-score; the figure is the points it added to the 100-point composite (weight × sub-score).
- Cash flow +25.0/30.0
- DSCR +8.1/10.0
- 1% rule +6.3/10.0
- Livability +4.2/5.0
- Rent growth +2.5/5.0
- Schools +2.5/10.0
- Condition / age +2.5/5.0
- ARV discount +0.0/15.0
- Appreciation +0.0/10.0
$225,000
🖨 Deal sheet (PDF) 📄 Offer letter ✓ Due diligence
Multi-family units
County records classify this as Multi-Family (2-4 Unit). Listing-text estimate: 1 unit. estimate disagrees with records
Listing remarks MLS
Great for owner occupied or investor. This property offers a solid investment opportunity with consistent rental income and long-term upside. Upper rent is $1100 MTM, Lower rent is $1100 MTM. Half of garage is rented for $100 for long term
Key facts
- 6,098 sq ft lot
- 2 garage spots
- Built 1895
Neighborhood map
What this means for you Summary
Snapshot
- This is a 4-bed/2.0-bath multifamily listed at $225k.
Deal economics
- At list price, monthly cash flow is $488 ($6k/yr) — positive.
- The deal already cash-flows at list — no discount required.
- Meets the 1% rule at list price ($3k rent vs $225k).
- Recommended offer: $205k (9.0% below list) — sets the bar for market timing.
- Cap rate 8.9% vs local median 4.0% in Kenosha — top-decile yield for the area; either an underpriced asset or a hidden risk that comps aren't pricing in. Stress-test before assuming the spread holds.
Location & tenants
- Location reads 84/100 on livability (#31 in WI, #680 nationally) — a professional / high-income tenant draw. Strengths: commute A+, cost of living A+, housing A+; Watch: employment C-, schools D+.
- Kenosha School District (suburban): math 26% / reading 31% proficiency, ranked #287 of 342 in WI (top 84%) — low school quality limits family demand, transient renter base, plan for 1-2y turnover.
- Market conditions: 35 active listings in the ZIP; 5 comparable units currently listed for rent nearby; rentals at typical pace (median 23d on market — plan ~3-4 weeks tenant-placement turnaround); 40% of comp listings sitting > 30 days — soft ceiling on asking rent; 259 units permitted in Kenosha County in 2024 (8 in 5+ unit buildings).
- This rent runs 45% of the median local income ($68k/yr) — at the standard rent-burdened threshold; future hikes will face affordability resistance.
Forward outlook
- Local home prices are declining (-3.0%/yr); year-one equity from $2k of loan paydown is wiped out by about $7k of value loss. Plan a longer hold.
Negotiation context
- It's been on market 109 days — a 9% lower offer ($205k) is reasonable based on typical stale-listing flexibility.
- 9 sale attempts since 14y ago with the ask held roughly flat each time — persistent listings suggest the price (not the market) is what's stuck; bring a comps-based counter.
- Current owner paid $135k; list at $225k implies a 67% gain — meaningful room to come down on a strong offer.
Risks & watch-outs
- Watch-outs: built in 1895 — expect roof / HVAC / electrical / plumbing capex.
Questions for the listing agent
- It's been on market 109 days. Have you received any prior offers? Is the seller open to a 9% concession, seller financing, or rate buy-down credit?
- Built in 1895 — when were the roof, HVAC, electrical panel, plumbing, and water heater last replaced?
- Why hasn't it sold? Are there any deal-killer items the seller is aware of (foundation, flood, title, zoning, code violations)?
- Is there a deadline driving the sale (1031 exchange, divorce, estate, relocation)? That informs how much negotiation room exists.
- Schools are D-rated, which usually means shorter tenancies and higher turnover. Who's the typical renter profile here, and what's been the actual vacancy rate?
- What's the average days-on-market for RENTAL listings here right now (not sales)? A rising rental-DOM trend means longer vacancies and softer asking-rent achievability than the comps imply.
- What's the recent tenant-quality profile in this submarket — average credit score on applications, eviction rate, late-payment / NSF rate, and stable-employment percentage? A property-management company in the area should have these aggregated.
- How much new apartment / multifamily construction is in the pipeline within 1–3 miles? Heavy new supply (>2% of stock underway) typically softens rents 12–24 months out; light construction supports rent growth.
Investment metrics
- 1% rule
- 1.13% ✓
- Cap rate
- 8.90%
- Cash-on-cash
- 9.30%
- DSCR
- 1.41
- GRM
- 7.4
CMA / ARV
- ARV (median comp)
- $179,246
- List price
- $225,000
- Delta
- 25.53%
- Verdict
- OVERPRICED
- Comps
- 20 within 1.0 mi
Show comp detail 5 sales within ~0.75 mi
| Address | Dist | Beds/Ba | Sqft | Sold | Price | $/sf | Match |
|---|---|---|---|---|---|---|---|
| 2428 71st St | 0.19mi | 4/2.0 | 1,344 (-0%) | 20mo | $190,000 | $141 | 74 |
| 6617 18th Ave | 0.36mi | 4/2.0 | 1,408 (+4%) | 20mo | $160,000 | $114 | 59 |
| 6218 32nd Ave | 0.73mi | 4/2.0 | 1,304 (-3%) | 21mo | $205,000 | $157 | 43 |
| 6046 31st Ave | 0.74mi | 3/2.0 (-1) | 1,477 (+9%) | 3mo | $212,000 | $144 | 42 |
| 1610 76th St | 0.65mi | 4/2.0 | 1,532 (+14%) | 9mo | $250,000 | $163 | 40 |
Match score weights: distance 35% · size 25% · config 20% · recency 20%. Top-matched comps best support the ARV.
Projected returns pro-forma
-3.0% appreciation · 3.0% rent growth · sell at horizon
- IRR
- -2.2%
- Equity multiple
- 0.92×
- Total profit
- $-5,339
- Equity at exit
- $33,548
- IRR
- 7.5%
- Equity multiple
- 1.56×
- Total profit
- $35,462
- Equity at exit
- $19,454
Cash invested: $63,000 (down + closing). Projections, not guarantees.
Landlord ↔ Tenant lean methodology
- Overall (STATE)
- 73 Landlord-Friendly
- State Wisconsin
- 73 Landlord-Friendly · R+2
- County
- — inherits STATE
- City
- — inherits STATE
ZIP-level market 53143
- Active inventory
- 35
- Price-to-rent
- 14.8×
Monthly cashflow live
- Estimated rent
- $2,537 high interval (Pro) →
- Mortgage (P&I)
- −$1,180
- Tax from tax record
- −$242 /mo · $2,906/yr
- Insurance
- −$94
- HOA
- −$0
- Vacancy / Maint / Mgmt
- −$533
- Net cashflow
- $488
Break-even live
Sensitivity live
| Price | -10% $616 | -5% $552 | +0% $488 | +5% $425 | +10% $361 |
|---|---|---|---|---|---|
| Rent | -10% $288 | -5% $388 | +0% $488 | +5% $589 | +10% $689 |
| Rate | -1.0pp $602 | -0.5pp $546 | base $488 | +0.5pp $430 | +1.0pp $371 |
2-unit breakdown (identical units grouped — click to expand)
| Units | Beds | Baths | Est. rent |
|---|---|---|---|
| 2× units | 2 | 1 | $2,538 |
| #1 | 2 | 1 | $1,269 |
| #2 | 2 | 1 | $1,269 |
| Total (2 units) | $2,537 | ||
UW: 25.0% down · 7.5% · 30yr · 1.5% tax · 5.0% vac · 8.0% maint · 8.0% mgmt
Financing live
Cash to close
- Down payment
- $56,250
- Closing costs
- $6,750
- Reserves months
- —
- Total cash needed
- —
Loan-product check · same deal, 3 products live
Conventional
25% down · 7.5% · 30yr
- Down + closing
- —
- Monthly P&I
- —
- Monthly cashflow
- —
- DSCR
- —
- Eligible?
- —
Personal DTI + credit; lowest rate.
DSCR
20% down · 8.5% · 30yr
- Down + closing
- —
- Monthly P&I
- —
- Monthly cashflow
- —
- DSCR
- —
- Eligible?
- —
No personal income docs; deal must DSCR.
Hard money
10% down · 12.0% · 12mo
- Down + closing
- —
- Monthly P&I
- —
- Monthly cashflow
- —
- DSCR
- —
- Eligible?
- —
Short-term bridge; refi at stabilization.
Rent comps 5 comps
| Address | Beds | Baths | Sqft | Rent | $/sqft | DOM | Units | Dist |
|---|---|---|---|---|---|---|---|---|
| 1809 60th St Kenosha, WI | 3.0 | 1.0 | 1100 | $1,500 | $1.36 | 44d | 1 | 0.65mi |
| 5807 20th Ave Unit 2 Kenosha, WI | 3.0 | 1.0 | 1064 | $2,400 | $2.26 | 19d | 1 | 0.70mi |
| 1510 57th St Unit 2 Kenosha, WI | 4.0 | 2.0 | 1700 | $1,800 | $1.06 | 44d | 1 | 0.87mi |
| 5432 23rd Ave Kenosha, WI | 4.0 | 2.0 | 1400 | $1,695 | $1.21 | 4d | 1 | 0.91mi |
| 2708 48th St Kenosha, WI | 4.0 | 2.0 | 1200 | $2,500 | $2.08 | 22d | 1 | 1.47mi |
Listing history 36 events
-
2026-06-18days on market $225,000 Active 109 DOM
-
2026-06-17days on market $225,000 Active 108 DOM
-
2026-06-16days on market $225,000 Active 107 DOM
-
2026-06-15days on market $225,000 Active 106 DOM
-
2026-06-13days on market $225,000 Active 104 DOM
-
2026-06-09days on market $225,000 Active 100 DOM
-
2026-06-08days on market $225,000 Active 99 DOM
-
2026-06-07days on market $225,000 Active 98 DOM
-
2026-06-04days on market $225,000 Active 95 DOM
-
2026-06-03days on market $225,000 Active 94 DOM
-
2026-06-02days on market $225,000 Active 93 DOM
-
2026-06-01days on market $225,000 Active 92 DOM
-
2026-05-31days on market $225,000 Active 91 DOM
-
2026-03-07price $225,000 239-char remark
Show marketing remark (239 chars)
Great for owner occupied or investor. This property offers a solid investment opportunity with consistent rental income and long-term upside. Upper rent is $1100 MTM, Lower rent is $1100 MTM. Half of garage is rented for $100 for long term
-
2026-03-06status Active 239-char remark
Show marketing remark (239 chars)
Great for owner occupied or investor. This property offers a solid investment opportunity with consistent rental income and long-term upside. Upper rent is $1100 MTM, Lower rent is $1100 MTM. Half of garage is rented for $100 for long term
-
2026-02-18status Pending 239-char remark
Show marketing remark (239 chars)
Great for owner occupied or investor. This property offers a solid investment opportunity with consistent rental income and long-term upside. Upper rent is $1100 MTM, Lower rent is $1100 MTM. Half of garage is rented for $100 for long term
-
2026-02-13$235,000 Active 239-char remark
Show marketing remark (239 chars)
Great for owner occupied or investor. This property offers a solid investment opportunity with consistent rental income and long-term upside. Upper rent is $1100 MTM, Lower rent is $1100 MTM. Half of garage is rented for $100 for long term
-
2021-01-25soldstatus $135,000
-
2020-07-13soldstatus $135,000 Sold 238-char remark
Show marketing remark (238 chars)
Great investment property or owner occupied 2 unit!! Both units in good condition. Tenants have all been there at least 4 years and would love to stay longer. Half the garage is also rented out for $50 per month extra. Great money maker!!
-
2020-06-05historical Contingent 238-char remark
Show marketing remark (238 chars)
Great investment property or owner occupied 2 unit!! Both units in good condition. Tenants have all been there at least 4 years and would love to stay longer. Half the garage is also rented out for $50 per month extra. Great money maker!!
-
2020-06-02price $134,900 238-char remark
Show marketing remark (238 chars)
Great investment property or owner occupied 2 unit!! Both units in good condition. Tenants have all been there at least 4 years and would love to stay longer. Half the garage is also rented out for $50 per month extra. Great money maker!!
-
2020-05-27$139,900 Active 238-char remark
Show marketing remark (238 chars)
Great investment property or owner occupied 2 unit!! Both units in good condition. Tenants have all been there at least 4 years and would love to stay longer. Half the garage is also rented out for $50 per month extra. Great money maker!!
-
2013-05-28soldstatus $66,500
-
2013-05-22$69,500
-
2013-05-22soldstatus $66,500
-
2013-03-06$74,900
-
2013-03-06historical
-
2012-10-09$89,000
-
2012-10-09historical
-
2012-10-09historical
-
2012-10-09$147,500
-
2012-10-09historical
-
2012-10-09$98,000
-
2012-10-09$124,900
-
2012-10-09historical
-
1990-11-01soldstatus $38,000
ⓘ Source: listings_history table (triggers on properties + properties_extension) + one-shot
backfill from property_details.listing_events for pre-trigger history.
Tax reassessment forecast WI · Partial reset (capped growth)
- Current annual tax
- $2,906 · $242/mo
- Projected year-2 tax
- $3,534 · $295/mo
- Expected delta
- +$628/yr (+$52/mo · 21.6%)
ⓘ Screening estimate from a state-policy table — verify with the county assessor before closing.
Climate risk First Street
- Flood 3/10 Moderate FEMA zone X (unshaded) · 10% chance over 30 yrs
- Wildfire 1/10 Low
- Heat 2/10 Low 7 d/yr ≥96°F today · 14 d/yr by 30 yrs out
- Wind 2/10 Low
- Air quality 3/10 Moderate 2 unhealthy d/yr today · 3 by 30 yrs out
Nearby sold comps map
Loading sold comps map…
Walkable amenities ~0.75 mi
Loading nearby amenities…
Taxation est. · year 1
- Rental income
- $30,444
- − Mortgage interest
- −$12,603
- − Property taxes
- −$2,906
- − Insurance
- −$1,125
- − Repairs & maintenance
- −$2,436
- − Management
- −$2,436
- − Depreciation
- −$6,545
- Taxable income
- $2,393
- Est. tax owed @ 24.0%
- −$574
- After-tax cash flow
- $5,286/yr
For passive investors: Depreciation is non-cash, so a rental often shows a tax loss while cash-flowing — sheltering income. Rental losses are passive: they offset passive income freely, and up to $25,000/yr can offset ordinary (W-2) income if you actively participate and your MAGI is under $100k (phasing out to $0 by $150k); unused losses carry forward. On sale, claimed depreciation is recaptured at up to 25%, and gains may owe capital-gains tax (a 1031 exchange can defer both). Figures are a year-1 estimate at your 24.0% rate — not tax advice; consult a CPA.
Schools (NCES district)
- District
- Kenosha School District
- NCES district ID
- 5507320
- Math proficiency
- 26% ▼ -9.00%
- Reading proficiency
- 31% ▼ -6.00%
- Median HH income
- $52,407
- Composite
- 25.17/100
- National rank
- #7516
- State rank
- #287 of 342 in WI
Livability — Kenosha
- Score
- 84/100
- State rank
- #31
- US rank
- #680
Category grades
Schools grade is shown separately in the Schools card above.
Census & demographics
- Census place
- Kenosha, WI
- County
- Kenosha County · 130,343 people
- City population
- 85,271
- Metro
- Chicago-Naperville-Elgin, IL-IN-WI
- Population (ZIP)
- 20,889
- Household income
- $68,343
- Rent vs Own
- Severe rent burden
- 813.0
Population outlook (Kenosha County) Hauer SSP2
- Today (2025)
- 174,032 people
- By 2030
- 174,923 · +0.5%
- By 2040
- 173,895 · -0.1%
- By 2050
- 170,102 · -2.3%
- By 2075
- 162,952 · -6.4%
- By 2100
- 154,781 · -11.1%
Race, ethnicity, and origin ACS 2023
- Neighborhood character
- Diverse neighborhood (Simpson 0.59)
- Race & ethnicity
- White 59% Hispanic / Latino 21% Two or more races 18% Black 11% Asian 1%
- Hispanic origin (detail)
- Mexican 16% Puerto Rican 2%
- Common ancestry
- Romanian 6% Portuguese 5% Lithuanian 2%
- Foreign-born
- 6% · Canada, China
- Languages at home
- 89% English-only · Spanish 10% Chinese 1%
Political lean MEDSL · Kenosha
- 2024 margin
- Lean R (+6.2) · D 46.2% · R 52.5% · Other 1.3%
- 2008→2024 swing
- -24.3pp toward R · 2008: 18.1pp · 2024: -6.2pp
- All cycles
- 2024: R+6.2 2020: R+3.1 2016: R+0.3 2012: D+12.3 2008: D+18.1
Not yet ingested
- Civics
- —
Market trends
- HPI YoY
- ▼ -220.75%
- Current HPI
- 229.2067
- Rent YoY
- —
- Metro
- Chicago-Naperville-Elgin, IL-IN-WI
- State GDP YoY
- ▲ 2.10%
- F500 in state
- 20
Industry mix (Fortune 500 HQ in WI)
| Industry | F500 HQs | Revenue |
|---|---|---|
| Industrial Machinery | 4 | $23B |
|
||
| Industrial Technology | 2 | $36B |
|
||
| Insurance | 1 | $36B |
|
||
| Professional Services | 1 | $19B |
|
||
| Utilities | 1 | $9B |
|
||
| Consumer Goods | 1 | $3B |
|
||
Price history
+492.1% since first listed23 events — show timeline
- 2026-03-07 Price Changed $225,000 METROMLS
- 2026-03-06 Relisted — METROMLS
- 2026-02-18 Pending — METROMLS
- 2026-02-13 Listed $235,000 METROMLS
- 2021-01-25 Sold (Public Records) $135,000 Public Records
- 2020-07-13 Sold (MLS) $135,000 METROMLS
- 2020-06-05 Contingent — METROMLS
- 2020-06-02 Price Changed $134,900 METROMLS
- 2020-05-27 Listed $139,900 METROMLS
- 2013-05-28 Sold (Public Records) $66,500 Public Records
- 2013-05-22 Listed $69,500 METROMLS
- 2013-05-22 Sold (MLS) $66,500 METROMLS
- 2013-03-06 Listing Removed — METROMLS
- 2013-03-06 Listed $74,900 METROMLS
- 2012-10-09 Listing Removed — METROMLS
- 2012-10-09 Listed $89,000 METROMLS
- 2012-10-09 Listed $147,500 METROMLS
- 2012-10-09 Listing Removed — METROMLS
- 2012-10-09 Listed $98,000 METROMLS
- 2012-10-09 Listing Removed — METROMLS
- 2012-10-09 Listing Removed — METROMLS
- 2012-10-09 Listed $124,900 METROMLS
- 1990-11-01 Sold (Public Records) $38,000 Public Records
Property tax history
+4.4%/yrLatest (2025): $2,906 · +6.5% YoY. Source: county tax records.
Cash-flow waterfall
monthlySold comps — $/sqft
last 12 mo · ≤1 miLoading sold comps…