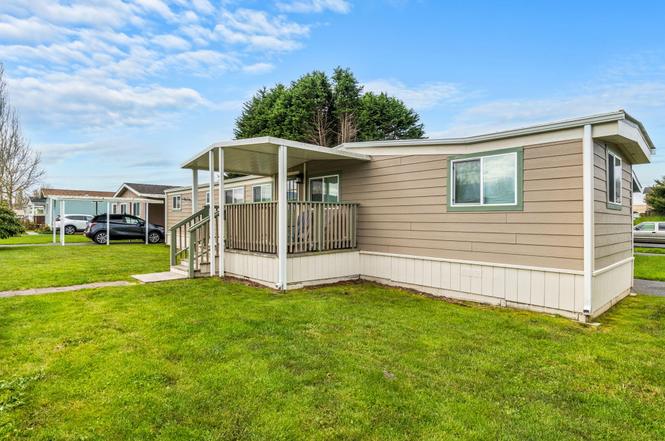
1283 Poplar Dr · Arcata, CA
Flood risk 1/10 · Minimal
- FEMA flood zone
- X (unshaded)
- Chance of flooding over 30 yrs
- 0.0%
- Est. flood insurance / yr
- $507 – $1,088
Fire risk 1/10 · Minimal
- Est. fire insurance / yr
- $659 – $1,223
Heat risk 2/10 · Minimal
- Hot days now (above 72°F)
- 9 days/yr
- Hot days in 30 yrs
- 23 days/yr
Wind risk 1/10 · Minimal
- Chance of severe wind over 30 yrs
- —
Air-quality risk 6/10 · Moderate
- Unhealthy air days now
- 9 days/yr
- Unhealthy air days in 30 yrs
- 9 days/yr
Risk factors via First Street. Map © Google.
Why this score? — see what drove the B- grade
The composite is a weighted blend of 9 inputs, each scored 0–100. Each bar is that input's sub-score; the figure is the points it added to the 100-point composite (weight × sub-score).
- Cash flow +27.0/30.0
- DSCR +9.3/10.0
- ARV discount +7.5/15.0
- 1% rule +7.3/10.0
- Rent growth +4.5/5.0
- Schools +4.1/10.0
- Livability +3.4/5.0
- Condition / age +2.5/5.0
- Appreciation +0.0/10.0
$119,500
🖨 Deal sheet 📄 Offer letter ✓ Due diligence
Listing remarks MLS
Entered for comp purposes only. This newly renovated inside and out corner unit is a two bedroom 2 bath single wide home located in a desirable Arcata family park.
Key facts
- Low maintenance yard
- Hardi plank siding
- Large corner lot
Tags
Property features AI
Finance
- Other: Located on a corner within the park; cross street Spruce
- Financial info: Not specified
- HOA & community: Located in Valley West mobile home park; Mobile home make: Clayton, model 2712
Exterior
- Parking: Enter park to access home (located last on the corner)
- Security: Not specified
- Utilities: Not specified
- Home design: Single family residence; Residential property
- Construction: Concrete construction
- Exterior features: Corner lot
Interior
- Kitchen: Dishwasher; Disposal; Microwave; Range; Refrigerator; Range hood
- Bedrooms: Not specified
- Flooring: Carpet; Wood
- Bathrooms: Not specified
- Heating & cooling: Forced air heating
- Interior features: Eat-in kitchen; Five total rooms
- Laundry & utility: Not specified
Neighborhood map
What this means for you Summary
Snapshot
- This is a 2-bed/2.0-bath manufactured listed at $120k.
Deal economics
- At list price, monthly cash flow is $334 ($4k/yr) — positive.
- The deal already cash-flows at list — no discount required.
- Meets the 1% rule at list price ($1k rent vs $120k).
- Recommended offer: $105k (12.0% below list) — sets the bar for market timing.
- Cap rate 9.6% vs local median 1.9% in Arcata — top-decile yield for the area; either an underpriced asset or a hidden risk that comps aren't pricing in. Stress-test before assuming the spread holds.
Location & tenants
- Location reads 68/100 on livability (#275 in CA) — a middle-class / working-renter tenant base. Strengths: amenities A+, health & safety A+, schools A-; Watch: housing C-, crime D-, commute F.
- Pacific Union Elementary (town): math 40% / reading 53% proficiency, ranked #560 of 1,400 in CA (top 40%) — families likely to look elsewhere, expect single-tenant / working-renter base with shorter leases.
- Market conditions: Rents rising fast (+8.1%/yr); 82 active listings in the ZIP; 188 units permitted in Humboldt County in 2024 (17 in 5+ unit buildings).
- This rent runs 33% of the median local income ($53k/yr) — at the standard rent-burdened threshold; future hikes will face affordability resistance.
Forward outlook
- Local home prices are declining (-3.0%/yr); year-one equity from $826 of loan paydown is wiped out by about $4k of value loss. Plan a longer hold.
- Humboldt County population projected to shrink 4% by 2050 — rents likely to lag national; underwrite the cash flow, not the appreciation.
- At projected returns (-3.0% appreciation + 8.0% rent growth), your $33k cash investment doubles in ~7 years — after that, you're playing with house money.
Negotiation context
- It's been on market 253 days — a 12% lower offer ($105k) is reasonable based on typical stale-listing flexibility.
- 5 sale attempts since 5y ago; this cycle's ask has dropped $24k (16%) from the opening price — seller is motivated, your offer sets the floor, not the list.
Questions for the listing agent
- It's been on market 253 days. Have you received any prior offers? Is the seller open to a 12% concession, seller financing, or rate buy-down credit?
- Built in 1973 — when were the roof, HVAC, electrical panel, plumbing, and water heater last replaced?
- Why hasn't it sold? Are there any deal-killer items the seller is aware of (foundation, flood, title, zoning, code violations)?
- Is there a deadline driving the sale (1031 exchange, divorce, estate, relocation)? That informs how much negotiation room exists.
- Schools are A-rated — typically a magnet for longer-tenancy family renters. What's the average tenant stay here, and is there a school-zone premium baked into asking?
- Crime grade is D in this area — have there been break-ins, vandalism, or insurance claims at this property in the last 3 years? What carrier currently insures it and at what premium?
- What's the average days-on-market for RENTAL listings here right now (not sales)? A rising rental-DOM trend means longer vacancies and softer asking-rent achievability than the comps imply.
- What's the recent tenant-quality profile in this submarket — average credit score on applications, eviction rate, late-payment / NSF rate, and stable-employment percentage? A property-management company in the area should have these aggregated.
- How much new for-sale + rental construction is in the pipeline within 1–3 miles? Heavy new supply typically softens prices + rents 12–24 months out; constrained supply supports both.
Investment metrics
- 1% rule
- 1.23% ✓
- Cap rate
- 9.64%
- Cash-on-cash
- 11.97%
- DSCR
- 1.53
- GRM
- 6.8
CMA / ARV
No comps found within radius.
Projected returns pro-forma
-3.0% appreciation · 8.0% rent growth · sell at horizon
- IRR
- 7.0%
- Equity multiple
- 1.29×
- Total profit
- $9,663
- Equity at exit
- $17,818
- IRR
- 20.3%
- Equity multiple
- 3.13×
- Total profit
- $71,169
- Equity at exit
- $10,332
Cash invested: $33,460 (down + closing). Projections, not guarantees.
Landlord ↔ Tenant lean methodology
- Overall (STATE)
- 18 Strongly Tenant-Friendly
- State California
- 18 Strongly Tenant-Friendly · D+13
- County
- — inherits STATE
- City
- — inherits STATE
ZIP-level market 95521
- Rents YoY
- 8.1%
- Active inventory
- 82
- Price-to-rent
- 6.8×
Monthly cashflow live
- Estimated rent
- $1,468 medium interval (Pro) →
- Mortgage (P&I)
- −$627
- Tax est. 1.5%
- −$149 /mo · $1,792/yr
- Insurance
- −$50
- HOA
- −$0
- Vacancy / Maint / Mgmt
- −$308
- Net cashflow
- $334
Break-even live
UW: 25.0% down · 7.5% · 30yr · 1.5% tax · 5.0% vac · 8.0% maint · 8.0% mgmt
Financing live
Cash to close
- Down payment
- $29,875
- Closing costs
- $3,585
- Reserves months
- —
- Total cash needed
- —
Loan-product check · same deal, 3 products live
Conventional
25% down · 7.5% · 30yr
- Down + closing
- —
- Monthly P&I
- —
- Monthly cashflow
- —
- DSCR
- —
- Eligible?
- —
Personal DTI + credit; lowest rate.
DSCR
20% down · 8.5% · 30yr
- Down + closing
- —
- Monthly P&I
- —
- Monthly cashflow
- —
- DSCR
- —
- Eligible?
- —
No personal income docs; deal must DSCR.
Hard money
10% down · 12.0% · 12mo
- Down + closing
- —
- Monthly P&I
- —
- Monthly cashflow
- —
- DSCR
- —
- Eligible?
- —
Short-term bridge; refi at stabilization.
Listing history 16 events
-
2026-06-19days on market $119,500 Active 253 DOM
-
2026-06-18days on market $119,500 Active 252 DOM
-
2026-06-17days on market $119,500 Active 251 DOM
-
2026-06-16days on market $119,500 Active 250 DOM
-
2026-06-15days on market $119,500 Active 249 DOM
-
2026-06-14days on market $119,500 Active 247 DOM
-
2026-06-13days on market $119,500 Active 246 DOM
-
2026-06-10days on market $119,500 Active 244 DOM
-
2026-06-09days on market $119,500 Active 243 DOM
-
2026-06-08days on market $119,500 Active 242 DOM
-
2026-06-07days on market $119,500 Active 241 DOM
-
2026-06-05days on market $119,500 Active 238 DOM
-
2026-06-02days on market $119,500 Active 237 DOM
-
2026-06-01days on market $119,500 Active 236 DOM
-
2026-05-31days on market $119,500 Active 235 DOM
-
2026-05-30days on market $119,500 Active 234 DOM
ⓘ Source: listings_history table (triggers on properties + properties_extension) + one-shot
backfill from property_details.listing_events for pre-trigger history.
Climate risk First Street
- Flood 1/10 Low FEMA zone X (unshaded) · 0% chance over 30 yrs
- Wildfire 1/10 Low
- Heat 2/10 Low 9 d/yr ≥72°F today · 23 d/yr by 30 yrs out
- Wind 1/10 Low
- Air quality 6/10 Major 9 unhealthy d/yr today · 9 by 30 yrs out
Nearby sold comps map
Loading sold comps map…
Walkable amenities ~0.75 mi
Loading nearby amenities…
Taxation est. · year 1
- Rental income
- $17,612
- − Mortgage interest
- −$6,694
- − Property taxes
- −$1,792
- − Insurance
- −$598
- − Repairs & maintenance
- −$1,409
- − Management
- −$1,409
- − Depreciation
- −$3,476
- Taxable income
- $2,234
- Est. tax owed @ 24.0%
- −$536
- After-tax cash flow
- $3,467/yr
For passive investors: Depreciation is non-cash, so a rental often shows a tax loss while cash-flowing — sheltering income. Rental losses are passive: they offset passive income freely, and up to $25,000/yr can offset ordinary (W-2) income if you actively participate and your MAGI is under $100k (phasing out to $0 by $150k); unused losses carry forward. On sale, claimed depreciation is recaptured at up to 25%, and gains may owe capital-gains tax (a 1031 exchange can defer both). Figures are a year-1 estimate at your 24.0% rate — not tax advice; consult a CPA.
Schools (NCES district)
- District
- Pacific Union Elementary
- NCES district ID
- 0629430
- Math proficiency
- 40% ▼ -2.00%
- Reading proficiency
- 53% ▲ 5.00%
- Median HH income
- $40,146
- Composite
- 41.08/100
- National rank
- #7442
- State rank
- #560 of 1400 in CA
Livability — Arcata
- Score
- 68/100
- State rank
- #275
- US rank
- #9258
Category grades
Schools grade is shown separately in the Schools card above.
Census & demographics
- Census place
- Arcata, CA
- County
- Humboldt County · 88,652 people
- City population
- 21,980
- Metro
- Eureka-Arcata, CA
- Population (ZIP)
- 21,980
- Household income
- $53,114
- Rent vs Own
- Severe rent burden
- 2139.0
Population outlook (Humboldt County) Hauer SSP2
- Today (2025)
- 135,550 people
- By 2030
- 134,798 · -0.6%
- By 2040
- 132,222 · -2.5%
- By 2050
- 130,850 · -3.5%
- By 2075
- 128,656 · -5.1%
- By 2100
- 120,238 · -11.3%
Race, ethnicity, and origin ACS 2023
- Neighborhood character
- Predominantly White (72%)
- Race & ethnicity
- White 72% Hispanic / Latino 15% Two or more races 13% Asian 2% Black 2% Native American 1%
- Hispanic origin (detail)
- Mexican 11% Puerto Rican 2%
- Common ancestry
- Lithuanian 5% Russian 5% Italian 4%
- Foreign-born
- 6% · Canada
- Languages at home
- 87% English-only · Spanish 8% Other Indo-European 2% Other Asian/Pacific 1%
Political lean MEDSL · Humboldt
- 2024 margin
- Strong D (+28.4) · D 62.0% · R 33.6% · Other 4.5%
- 2008→2024 swing
- +0.2pp no change · 2008: 28.2pp · 2024: 28.4pp
- All cycles
- 2024: D+28.4 2020: D+33.4 2016: D+25.9 2012: D+26.2 2008: D+28.2
Not yet ingested
- Civics
- —
Market trends
- HPI YoY
- ▼ -373.51%
- Current HPI
- 208.5938
- Rent YoY
- ▲ 8.08%
- Metro
- Eureka-Arcata, CA
- State GDP YoY
- ▲ 3.21%
- F500 in state
- 116
Industry mix (Fortune 500 HQ in CA)
| Industry | F500 HQs | Revenue |
|---|---|---|
| Technology | 27 | $1,492B |
|
||
| Financial Services | 3 | $174B |
|
||
| Retail | 3 | $44B |
|
||
| Insurance | 3 | $26B |
|
||
| Media / Entertainment | 2 | $115B |
|
||
| Pharmaceuticals / Biotech | 2 | $62B |
|
||
Price history
-14.0% since first listed11 events — show timeline
- 2026-05-27 Relisted — HAR
- 2026-01-23 Relisted — HAR
- 2026-01-23 Price Changed $119,500 HAR
- 2025-11-06 Price Changed $134,900 HAR
- 2025-09-02 Relisted — HAR
- 2025-06-02 Price Changed $137,900 HAR
- 2025-04-25 Price Changed $139,900 HAR
- 2025-04-25 Price Changed $140,000 HAR
- 2025-04-07 Listed $143,000 HAR
- 2021-12-03 Sold (MLS) $135,500 HAR
- 2021-12-02 Listed $139,000 HAR
Cash-flow waterfall
monthlySold comps — $/sqft
last 12 mo · ≤1 miLoading sold comps…