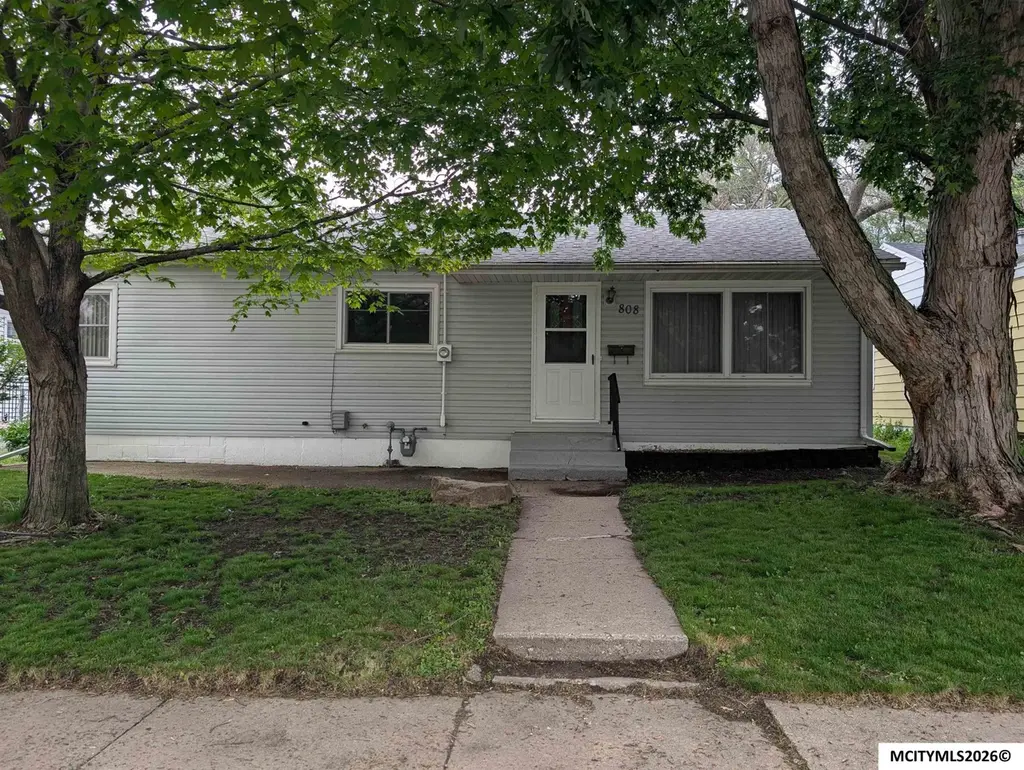
808 N Harrison Ave · Mason City, IA
Flood risk 1/10 · Minimal
- FEMA flood zone
- X (unshaded)
- Chance of flooding over 30 yrs
- 0.0%
- Est. flood insurance / yr
- $473 – $860
Fire risk 3/10 · Minor
- Est. fire insurance / yr
- $902 – $1,676
Heat risk 2/10 · Minimal
- Hot days now (above 101°F)
- 7 days/yr
- Hot days in 30 yrs
- 16 days/yr
Wind risk 2/10 · Minimal
- Chance of severe wind over 30 yrs
- —
Air-quality risk 1/10 · Minimal
- Unhealthy air days now
- 0 days/yr
- Unhealthy air days in 30 yrs
- 0 days/yr
Risk factors via First Street. Map © Google.
Why this score? — see what drove the C grade
The composite is a weighted blend of 9 inputs, each scored 0–100. Each bar is that input's sub-score; the figure is the points it added to the 100-point composite (weight × sub-score).
- Cash flow +20.9/30.0
- ARV discount +11.7/15.0
- DSCR +6.7/10.0
- 1% rule +5.0/10.0
- Schools +4.5/10.0
- Livability +4.0/5.0
- Rent growth +2.5/5.0
- Condition / age +2.5/5.0
- Appreciation +0.0/10.0
$159,500
🖨 Deal sheet 📄 Offer letter ✓ Due diligence
Listing remarks
Welcome to this charming 3-bedroom, 1-bathroom home offering incredible value in a sought-after Mason City neighborhood! Inside, discover a welcoming main floor living room and a stunning sunroom bathed in natural light. The updated bathroom features a convenient shower for modern comfort. The finished lower level truly sets this home apart, boasting a non-conforming bedroom and spacious bonus area — perfect for entertaining or extra living space. Outside, you'll appreciate the additional concrete parking, while updated shingles, siding, and windows provide lasting peace of mind. Family owned for over 50 years Ideally situated near Hoover Elementary School, MacNider's Woods Park, and
Key facts
- Stunning sunroom
- Spacious bonus area
- Updated bathroom
Tags
Property features AI
Exterior
- Parking: Detached garage with garage door opener; 2 garage spaces; Concrete and gravel surfaces
- Utilities: Public water; Public sewer
- Home design: Single-family residence; Residential property
- Construction: Vinyl siding; Asphalt/composition roof; Below-grade finished area (approximately 750)
- Exterior features: Deck; Patio; Shed(s)
Interior
- Kitchen: Dishwasher; Electric range; Disposal; Microwave; Refrigerator
- Bedrooms: 3 bedrooms on the main level
- Flooring: Carpet; Vinyl
- Heating & cooling: Forced air heating (natural gas); Central air; Ceiling fans
- Interior features: Pantry; Partially finished full basement
Neighborhood map
What this means for you Summary
Snapshot
- This is a 3-bed/1.5-bath single-family listed at $160k.
Deal economics
- At list price, monthly cash flow is $222 ($3k/yr) — positive.
- The deal already cash-flows at list — no discount required.
- To meet the 1% rule (rent ≥ 1% of price), the offer needs to be $159k (0.3% below list).
- Recommended offer: $157k (1.5% below list) — sets the bar for market timing.
- Cap rate 8.0% vs local median 5.2% in Mason City — top-decile yield for the area; either an underpriced asset or a hidden risk that comps aren't pricing in. Stress-test before assuming the spread holds.
Location & tenants
- Location reads 81/100 on livability (#67 in IA, #1,477 nationally) — a professional / high-income tenant draw. Strengths: commute A+, cost of living A+, housing A+; Watch: amenities F.
- Mason City Community School District (town): math 50% / reading 58% proficiency, ranked #271 of 289 in IA (top 94%) — acceptable for families but not a draw, mixed tenant base, ~2y average lease.
- Zoned schools: Hoover Elementary School (math 47% / reading 47%, grade D-, #530 of 616 statewide, top 88%, 375 students, 59% FRL) — zoned schools average 59% FRL vs 41% district-wide (17 pts higher); higher-poverty schools than district average — tighter screening recommended.
- Market conditions: 153 active listings in the ZIP; 2 comparable units currently listed for rent nearby; 54 units permitted in Cerro Gordo County in 2024 (6 in 5+ unit buildings).
Forward outlook
- Local home prices are declining (-3.0%/yr); year-one equity from $1k of loan paydown is wiped out by about $5k of value loss. Plan a longer hold.
- Cerro Gordo County population projected at -18% by 2050 — secular population decline; favor cash flow + early exit over multi-decade hold.
Negotiation context
- It's been on market 24 days — a 2% lower offer ($157k) is reasonable based on typical stale-listing flexibility.
Risks & watch-outs
- Watch-outs: built in 1954 — expect roof / HVAC / electrical / plumbing capex.
Questions for the listing agent
- Built in 1954 — when were the roof, HVAC, electrical panel, plumbing, and water heater last replaced?
- Is there a deadline driving the sale (1031 exchange, divorce, estate, relocation)? That informs how much negotiation room exists.
- What's the average days-on-market for RENTAL listings here right now (not sales)? A rising rental-DOM trend means longer vacancies and softer asking-rent achievability than the comps imply.
- What's the recent tenant-quality profile in this submarket — average credit score on applications, eviction rate, late-payment / NSF rate, and stable-employment percentage? A property-management company in the area should have these aggregated.
- How much new for-sale + rental construction is in the pipeline within 1–3 miles? Heavy new supply typically softens prices + rents 12–24 months out; constrained supply supports both.
Investment metrics
- 1% rule
- 1.00% ✗
- Cap rate
- 7.97%
- Cash-on-cash
- 5.98%
- DSCR
- 1.27
- GRM
- 8.4
CMA / ARV
- ARV (on-the-fly)
- $175,980
- Comps found
- 12
Show comp detail 12 sales within ~0.75 mi
| Address | Dist | Beds/Ba | Sqft | Sold | Price | $/sf | Match |
|---|---|---|---|---|---|---|---|
| 811 9th St NW | 0.07mi | 4/2.0 (+1) | 1,780 (+6%) | 0mo | $250,000 | $140 | 79 |
| 1030 2nd St NW | 0.43mi | 3/1.0 | 1,716 (+2%) | 7mo | $149,000 | $87 | 68 |
| 1011 N Jefferson Ave | 0.47mi | 3/2.2 | 1,600 (-4%) | 2mo | $162,000 | $101 | 66 |
| 620 N Jackson Ave | 0.16mi | 4/1.0 (+1) | 1,468 (-12%) | 0mo | $190,000 | $129 | 64 |
| 106 10th St NW | 0.60mi | 3/1.5 | 1,568 (-6%) | 0mo | $164,900 | $105 | 61 |
| 1015 N Jefferson Ave | 0.47mi | 4/1.0 (+1) | 1,608 (-4%) | 4mo | $110,000 | $68 | 61 |
| 234 Willowbrook Dr Dr | 0.71mi | 2/1.8 (-1) | 1,697 (+1%) | 2mo | $252,000 | $148 | 58 |
| 217 10th St NW | 0.49mi | 3/2.0 | 1,828 (+9%) | 6mo | $175,000 | $96 | 55 |
| 725 N Jefferson Ave | 0.44mi | 4/2.0 (+1) | 1,860 (+11%) | 2mo | $238,000 | $128 | 52 |
| 221 9th St NW | 0.47mi | 2/2.0 (-1) | 1,892 (+13%) | 1mo | $137,500 | $73 | 49 |
| 5 Lakeview Dr Dr | 0.74mi | 4/1.8 (+1) | 1,809 (+8%) | 6mo | $265,000 | $146 | 41 |
| 727 2nd St SW | 0.67mi | 3/1.5 | 1,429 (-15%) | 5mo | $135,000 | $94 | 40 |
Match score weights: distance 35% · size 25% · config 20% · recency 20%. Top-matched comps best support the ARV.
Projected returns pro-forma
-3.0% appreciation · 3.0% rent growth · sell at horizon
- IRR
- -7.1%
- Equity multiple
- 0.74×
- Total profit
- $-11,700
- Equity at exit
- $23,782
- IRR
- 2.5%
- Equity multiple
- 1.18×
- Total profit
- $7,976
- Equity at exit
- $13,791
Cash invested: $44,660 (down + closing). Projections, not guarantees.
Landlord ↔ Tenant lean methodology
- Overall (STATE)
- 83 Strongly Landlord-Friendly
- State Iowa
- 83 Strongly Landlord-Friendly · R+6
- County
- — inherits STATE
- City
- — inherits STATE
ZIP-level market 50401
- Active inventory
- 153
- Price-to-rent
- 8.4×
Monthly cashflow live
- Estimated rent
- $1,590 medium interval (Pro) →
- Mortgage (P&I)
- −$836
- Tax from tax record
- −$131 /mo · $1,572/yr
- Insurance
- −$66
- HOA
- −$0
- Vacancy / Maint / Mgmt
- −$334
- Net cashflow
- $222
Break-even live
UW: 25.0% down · 7.5% · 30yr · 1.5% tax · 5.0% vac · 8.0% maint · 8.0% mgmt
Financing live
Cash to close
- Down payment
- $39,875
- Closing costs
- $4,785
- Reserves months
- —
- Total cash needed
- —
Loan-product check · same deal, 3 products live
Conventional
25% down · 7.5% · 30yr
- Down + closing
- —
- Monthly P&I
- —
- Monthly cashflow
- —
- DSCR
- —
- Eligible?
- —
Personal DTI + credit; lowest rate.
DSCR
20% down · 8.5% · 30yr
- Down + closing
- —
- Monthly P&I
- —
- Monthly cashflow
- —
- DSCR
- —
- Eligible?
- —
No personal income docs; deal must DSCR.
Hard money
10% down · 12.0% · 12mo
- Down + closing
- —
- Monthly P&I
- —
- Monthly cashflow
- —
- DSCR
- —
- Eligible?
- —
Short-term bridge; refi at stabilization.
Rent comps 2 comps
| Address | Beds | Baths | Sqft | Rent | $/sqft | DOM | Units | Dist |
|---|---|---|---|---|---|---|---|---|
| 12 2nd St NE Unit 6 Mason City, IA | 2.0 | 1.0 | 1296 | $1,600 | $1.23 | 43d | 1 | 0.77mi |
| 215 2nd St SW Unit 100-210 Mason City, IA | 3.0 | 2.0 | 1273 | $1,580 | $1.24 | 43d | 1 | 0.79mi |
Listing history 11 events
-
2026-06-12statusdays on market $159,500 Pending 24 DOM
-
2026-06-09days on market $159,500 Active Under Contract 21 DOM
-
2026-06-08days on market $159,500 Active Under Contract 20 DOM
-
2026-06-07days on market $159,500 Active Under Contract 19 DOM
-
2026-06-07days on market $159,500 Active Under Contract 18 DOM
-
2026-06-04days on market $159,500 Active Under Contract 15 DOM
-
2026-06-02days on market $159,500 Active Under Contract 14 DOM
-
2026-06-01days on market $159,500 Active Under Contract 13 DOM
-
2026-05-31days on market $159,500 Active Under Contract 12 DOM
-
2026-05-31days on market $159,500 Active Under Contract 11 DOM
-
2026-05-19$159,500 Active
ⓘ Source: listings_history table (triggers on properties + properties_extension) + one-shot
backfill from property_details.listing_events for pre-trigger history.
Tax reassessment forecast IA · Partial reset (capped growth)
- Current annual tax
- $1,572 · $131/mo
- Projected year-2 tax
- $2,038 · $170/mo
- Expected delta
- +$466/yr (+$39/mo · 29.6%)
ⓘ Screening estimate from a state-policy table — verify with the county assessor before closing.
Climate risk First Street
- Flood 1/10 Low FEMA zone X (unshaded) · 0% chance over 30 yrs
- Wildfire 3/10 Moderate
- Heat 2/10 Low 7 d/yr ≥101°F today · 16 d/yr by 30 yrs out
- Wind 2/10 Low
- Air quality 1/10 Low 0 unhealthy d/yr today · 0 by 30 yrs out
Nearby sold comps map
Loading sold comps map…
Walkable amenities ~0.75 mi
Loading nearby amenities…
Taxation est. · year 1
- Rental income
- $19,083
- − Mortgage interest
- −$8,934
- − Property taxes
- −$1,572
- − Insurance
- −$798
- − Repairs & maintenance
- −$1,527
- − Management
- −$1,527
- − Depreciation
- −$4,640
- Taxable income
- $85
- Est. tax owed @ 24.0%
- −$21
- After-tax cash flow
- $2,648/yr
For passive investors: Depreciation is non-cash, so a rental often shows a tax loss while cash-flowing — sheltering income. Rental losses are passive: they offset passive income freely, and up to $25,000/yr can offset ordinary (W-2) income if you actively participate and your MAGI is under $100k (phasing out to $0 by $150k); unused losses carry forward. On sale, claimed depreciation is recaptured at up to 25%, and gains may owe capital-gains tax (a 1031 exchange can defer both). Figures are a year-1 estimate at your 24.0% rate — not tax advice; consult a CPA.
Schools (NCES district)
- District
- Mason City Community School District
- NCES district ID
- 1918780
- Math proficiency
- 50% ▼ -1.00%
- Reading proficiency
- 58% ▼ -7.00%
- Median HH income
- $43,668
- Composite
- 45.47/100
- National rank
- #2614
- State rank
- #271 of 289 in IA
Livability — Mason City
- Score
- 81/100
- State rank
- #67
- US rank
- #1477
Category grades
Schools grade is shown separately in the Schools card above.
Census & demographics
- Census place
- Mason City, IA
- City population
- 28,818
- Population (ZIP)
- 28,818
Population outlook (Cerro Gordo County) Hauer SSP2
- Today (2025)
- 41,080 people
- By 2030
- 39,746 · -3.2%
- By 2040
- 36,608 · -10.9%
- By 2050
- 33,682 · -18.0%
- By 2075
- 29,702 · -27.7%
- By 2100
- 27,399 · -33.3%
Race, ethnicity, and origin ACS 2023
- Neighborhood character
- Predominantly White (87%)
- Race & ethnicity
- White 87% Hispanic / Latino 6% Two or more races 5% Black 3% Asian 1%
- Hispanic origin (detail)
- Mexican 5%
- Common ancestry
- Portuguese 12% Iranian 2% Lithuanian 2%
- Foreign-born
- 2% · Canada, Vietnam
- Languages at home
- 96% English-only · Spanish 3% Other Asian/Pacific 1%
Political lean MEDSL · Cerro Gordo
- 2024 margin
- R (+11.7) · D 43.4% · R 55.0% · Other 1.6%
- 2008→2024 swing
- -32.5pp toward R · 2008: 20.8pp · 2024: -11.7pp
- All cycles
- 2024: R+11.7 2020: R+6.3 2016: R+7.7 2012: D+13.2 2008: D+20.8
Not yet ingested
- Civics
- —
Market trends
- HPI YoY
- ▼ -130.01%
- Current HPI
- 199.1966
- Rent YoY
- —
- Metro
- —
- State GDP YoY
- ▲ 2.48%
- F500 in state
- 4
Industry mix (Fortune 500 HQ in IA)
| Industry | F500 HQs | Revenue |
|---|---|---|
| Financial Services | 1 | $16B |
|
||
| Retail / Convenience | 1 | $15B |
|
||
Price history
1 event — show timeline
- 2026-05-19 Listed $159,500 Greater Mason BOR
Property tax history
+2.0%/yrLatest (2025): $1,572 · +2.9% YoY. Source: county tax records.
Cash-flow waterfall
monthlySold comps — $/sqft
last 12 mo · ≤1 miLoading sold comps…