 Duplex
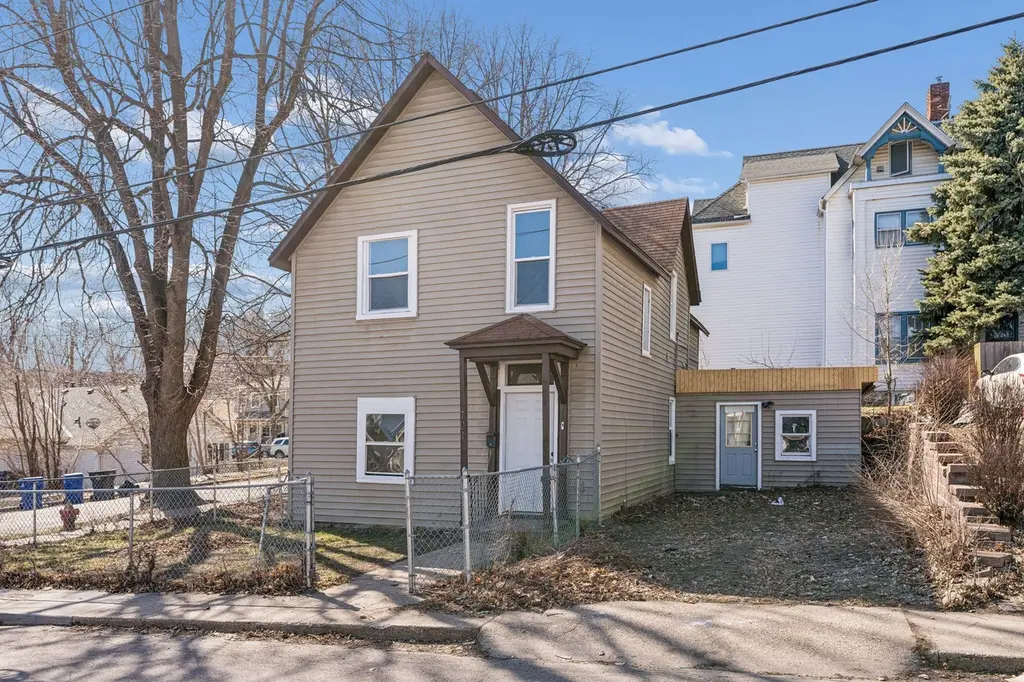
701 Desoto St · St. Paul, MN
Flood risk 1/10 · Minimal
- FEMA flood zone
- X (unshaded)
- Chance of flooding over 30 yrs
- 0.0%
- Est. flood insurance / yr
- $507 – $1,088
Fire risk 1/10 · Minimal
- Est. fire insurance / yr
- $888 – $1,650
Heat risk 2/10 · Minimal
- Hot days now (above 99°F)
- 7 days/yr
- Hot days in 30 yrs
- 14 days/yr
Wind risk 2/10 · Minimal
- Chance of severe wind over 30 yrs
- —
Air-quality risk 2/10 · Minimal
- Unhealthy air days now
- 1 days/yr
- Unhealthy air days in 30 yrs
- 1 days/yr
Risk factors via First Street. Map © Google.
Why this score? — see what drove the B- grade
The composite is a weighted blend of 9 inputs, each scored 0–100. Each bar is that input's sub-score; the figure is the points it added to the 100-point composite (weight × sub-score).
- Cash flow +30.0/30.0
- 1% rule +10.0/10.0
- DSCR +10.0/10.0
- ARV discount +7.5/15.0
- Rent growth +3.5/5.0
- Livability +2.5/5.0
- Condition / age +2.5/5.0
- Schools +2.4/10.0
- Appreciation +0.0/10.0
$249,000
🖨 Deal sheet (PDF) 📄 Offer letter ✓ Due diligence
Multi-family units
County records classify this as Multi-Family (2-4 Unit). Listing-text estimate: 2 units. confirmed
Listing remarks MLS
TOTALLY REMODELED ! 3 UP 3 DOWN ! GOOD MONEY MAKER ! QUIEY SRTEET , FENCED YARD , CLOSE TO BUS LINE... CODE COMPLIANT WITH CITY.
Key facts
- 2,178 sq ft lot
- Built 1887
- Listed 35 days
Neighborhood map
What this means for you Summary
Snapshot
- This is a 2 × 3-bed/1.0-bath units multifamily listed at $249k.
Deal economics
- At list price, monthly cash flow is $2k ($25k/yr) — positive. Per door: $1k/mo.
- The deal already cash-flows at list — no discount required.
- Meets the 1% rule at list price ($5k rent vs $249k).
- Recommended offer: $242k (3.0% below list) — sets the bar for market timing.
Location & tenants
- Location reads: area grade B — affects rentability + tenant quality, not the cash-flow math above.
- St. Paul Public School District (urban): math 21% / reading 33% proficiency, ranked #270 of 301 in MN (top 90%) — low school quality limits family demand, transient renter base, plan for 1-2y turnover; 64% free/reduced lunch — lower-income household profile, screen leases tightly.
- Zoned schools: Farnsworth Aerospace Lower (math 5% / reading 15%, grade F, #813 of 857 statewide, top 97%, 425 students, 83% FRL) — zoned schools average 83% FRL vs 64% district-wide (19 pts higher); higher-poverty schools than district average — tighter screening recommended.
- Zoned-school proficiency averages 10% at this address vs 27% district-wide (-17 pts) — the specific schools serving this property underperform the St. Paul Public School District average; the district grade overstates school quality for this exact location.
- Market conditions: Rents rising (+3.9%/yr); 59 active listings in the ZIP; 1,202 units permitted in Ramsey County in 2024 (880 in 5+ unit buildings).
- At $4,941/mo this rent would consume 110% of the median local household income ($54k/yr) (locally 818% of renters already pay >50% of income on rent) — very limited rent-growth headroom before tenants either downsize or default.
Forward outlook
- Local home prices are declining (-3.0%/yr); year-one equity from $2k of loan paydown is wiped out by about $7k of value loss. Plan a longer hold.
- Ramsey County population projected at +27% by 2050 — long-run rental-demand tailwind backs the buy-and-hold thesis.
- At projected returns (-3.0% appreciation + 3.9% rent growth), your $70k cash investment doubles in ~4 years — after that, you're playing with house money.
Negotiation context
- It's been on market 35 days — a 3% lower offer ($242k) is reasonable based on typical stale-listing flexibility.
- 13 sale attempts since 33y ago with the ask held roughly flat each time — persistent listings suggest the price (not the market) is what's stuck; bring a comps-based counter.
Risks & watch-outs
- Watch-outs: built in 1887 — expect roof / HVAC / electrical / plumbing capex.
Questions for the listing agent
- It's been on market 35 days. Have you received any prior offers? Is the seller open to a 3% concession, seller financing, or rate buy-down credit?
- Can we see the unit-by-unit rent roll, current vacancy, and any below-market leases? What's the average tenancy length?
- What capital expenditures (roof, boiler, parking lot, exteriors) have been made in the last 5 years, and what's planned in the next 2?
- Built in 1887 — when were the roof, HVAC, electrical panel, plumbing, and water heater last replaced?
- Is there a deadline driving the sale (1031 exchange, divorce, estate, relocation)? That informs how much negotiation room exists.
- What's the average days-on-market for RENTAL listings here right now (not sales)? A rising rental-DOM trend means longer vacancies and softer asking-rent achievability than the comps imply.
- What's the recent tenant-quality profile in this submarket — average credit score on applications, eviction rate, late-payment / NSF rate, and stable-employment percentage? A property-management company in the area should have these aggregated.
- How much new apartment / multifamily construction is in the pipeline within 1–3 miles? Heavy new supply (>2% of stock underway) typically softens rents 12–24 months out; light construction supports rent growth.
Investment metrics
- 1% rule
- 1.98% ✓
- Cap rate
- 16.32%
- Cash-on-cash
- 35.80%
- DSCR
- 2.59
- GRM
- 4.2
CMA / ARV
No comps found within radius.
Projected returns pro-forma
-3.0% appreciation · 3.94% rent growth · sell at horizon
- IRR
- 32.6%
- Equity multiple
- 2.39×
- Total profit
- $96,994
- Equity at exit
- $37,127
- IRR
- 40.2%
- Equity multiple
- 4.95×
- Total profit
- $275,348
- Equity at exit
- $21,529
Cash invested: $69,720 (down + closing). Projections, not guarantees.
Landlord ↔ Tenant lean methodology
- Overall (STATE)
- 46 Balanced
- State Minnesota
- 46 Balanced · D+2
- County
- — inherits STATE
- City
- — inherits STATE
ZIP-level market 55130
- Home prices YoY
- -17.6%
- Rents YoY
- 3.9%
- Active inventory
- 59
- Price-to-rent
- 8.4×
Monthly cashflow live
- Estimated rent
- $4,941 high interval (Pro) →
- Mortgage (P&I)
- −$1,306
- Tax from tax record
- −$414 /mo · $4,964/yr
- Insurance
- −$104
- HOA
- −$0
- Vacancy / Maint / Mgmt
- −$1,038
- Net cashflow
- $2,080
Break-even live
Sensitivity live
| Price | -10% $2,221 | -5% $2,151 | +0% $2,080 | +5% $2,010 | +10% $1,939 |
|---|---|---|---|---|---|
| Rent | -10% $1,690 | -5% $1,885 | +0% $2,080 | +5% $2,275 | +10% $2,471 |
| Rate | -1.0pp $2,206 | -0.5pp $2,144 | base $2,080 | +0.5pp $2,016 | +1.0pp $1,950 |
2-unit breakdown (identical units grouped — click to expand)
| Units | Beds | Baths | Est. rent |
|---|---|---|---|
| 2× units | 3 | 1 | $4,940 |
| #1 | 3 | 1 | $2,470 |
| #2 | 3 | 1 | $2,470 |
| Total (2 units) | $4,941 | ||
UW: 25.0% down · 7.5% · 30yr · 1.5% tax · 5.0% vac · 8.0% maint · 8.0% mgmt
Financing live
Cash to close
- Down payment
- $62,250
- Closing costs
- $7,470
- Reserves months
- —
- Total cash needed
- —
Loan-product check · same deal, 3 products live
Conventional
25% down · 7.5% · 30yr
- Down + closing
- —
- Monthly P&I
- —
- Monthly cashflow
- —
- DSCR
- —
- Eligible?
- —
Personal DTI + credit; lowest rate.
DSCR
20% down · 8.5% · 30yr
- Down + closing
- —
- Monthly P&I
- —
- Monthly cashflow
- —
- DSCR
- —
- Eligible?
- —
No personal income docs; deal must DSCR.
Hard money
10% down · 12.0% · 12mo
- Down + closing
- —
- Monthly P&I
- —
- Monthly cashflow
- —
- DSCR
- —
- Eligible?
- —
Short-term bridge; refi at stabilization.
Listing history 45 events
-
2026-06-21days on market $249,000 Active 35 DOM
-
2026-06-18days on market $249,000 Active 32 DOM
-
2026-06-17days on market $249,000 Active 31 DOM
-
2026-06-16days on market $249,000 Active 30 DOM
-
2026-06-15days on market $249,000 Active 29 DOM
-
2026-06-13days on market $249,000 Active 27 DOM
-
2026-06-09days on market $249,000 Active 23 DOM
-
2026-06-08days on market $249,000 Active 22 DOM
-
2026-06-07statusdays on market $249,000 Active 21 DOM
-
2026-04-20status Pending
-
2026-04-13historical Contingent - Inspection
-
2026-04-03$249,000 Active
-
2026-03-30historical $249,000
-
2025-11-05soldstatus $425,000
-
2012-03-06soldstatus $94,900 128-char remark
Show marketing remark (128 chars)
TOTALLY REMODELED ! 3 UP 3 DOWN ! GOOD MONEY MAKER ! QUIEY SRTEET , FENCED YARD , CLOSE TO BUS LINE... CODE COMPLIANT WITH CITY.
-
2012-02-15historical 128-char remark
Show marketing remark (128 chars)
TOTALLY REMODELED ! 3 UP 3 DOWN ! GOOD MONEY MAKER ! QUIEY SRTEET , FENCED YARD , CLOSE TO BUS LINE... CODE COMPLIANT WITH CITY.
-
2012-02-07$94,500 128-char remark
Show marketing remark (128 chars)
TOTALLY REMODELED ! 3 UP 3 DOWN ! GOOD MONEY MAKER ! QUIEY SRTEET , FENCED YARD , CLOSE TO BUS LINE... CODE COMPLIANT WITH CITY.
-
2011-11-18historical
-
2011-08-16$94,500
-
2011-08-06historical
-
2011-01-21$119,000
-
2009-03-31soldstatus $16,500
-
2009-01-06soldstatus $16,500
-
2008-12-09historical
-
2008-11-17$18,500
-
2005-02-15soldstatus $203,000
-
2004-11-05historical
-
2004-10-15$199,900
-
1999-09-02soldstatus $49,000
-
1999-06-04soldstatus $49,000
-
1999-04-08historical
-
1999-02-28$55,000
-
1998-11-14historical
-
1998-09-14$55,000
-
1998-08-22historical
-
1998-05-22$49,900
-
1997-06-08historical
-
1996-11-18$55,000
-
1995-04-13soldstatus $35,000
-
1995-03-13historical
-
1994-05-26$37,500
-
1994-05-25historical
-
1994-02-07$39,900
-
1994-01-31historical
-
1993-07-31$42,900
ⓘ Source: listings_history table (triggers on properties + properties_extension) + one-shot
backfill from property_details.listing_events for pre-trigger history.
Tax reassessment forecast MN · Partial reset (capped growth)
- Current annual tax
- $4,964 · $414/mo
- Projected year-2 tax
- $4,964 · $414/mo
- Expected delta
- $0/yr ($0/mo · 0.0%)
ⓘ Screening estimate from a state-policy table — verify with the county assessor before closing.
Climate risk First Street
- Flood 1/10 Low FEMA zone X (unshaded) · 0% chance over 30 yrs
- Wildfire 1/10 Low
- Heat 2/10 Low 7 d/yr ≥99°F today · 14 d/yr by 30 yrs out
- Wind 2/10 Low
- Air quality 2/10 Low 1 unhealthy d/yr today · 1 by 30 yrs out
Nearby sold comps map
Loading sold comps map…
Walkable amenities ~0.75 mi
Loading nearby amenities…
Taxation est. · year 1
- Rental income
- $59,292
- − Mortgage interest
- −$13,948
- − Property taxes
- −$4,964
- − Insurance
- −$1,245
- − Repairs & maintenance
- −$4,743
- − Management
- −$4,743
- − Depreciation
- −$7,244
- Taxable income
- $22,405
- Est. tax owed @ 24.0%
- −$5,377
- After-tax cash flow
- $19,585/yr
For passive investors: Depreciation is non-cash, so a rental often shows a tax loss while cash-flowing — sheltering income. Rental losses are passive: they offset passive income freely, and up to $25,000/yr can offset ordinary (W-2) income if you actively participate and your MAGI is under $100k (phasing out to $0 by $150k); unused losses carry forward. On sale, claimed depreciation is recaptured at up to 25%, and gains may owe capital-gains tax (a 1031 exchange can defer both). Figures are a year-1 estimate at your 24.0% rate — not tax advice; consult a CPA.
Schools (NCES district)
- District
- St. Paul Public School District
- NCES district ID
- 2733840
- Math proficiency
- 21% ▼ -11.00%
- Reading proficiency
- 33% ▼ -7.00%
- Median HH income
- $48,316
- Composite
- 23.51/100
- National rank
- #7868
- State rank
- #270 of 301 in MN
Livability — St. Paul
No livability data for this city. (Only ~50 U.S. cities are tracked.)
Census & demographics
- Census place
- St. Paul, MN
- County
- Ramsey County · 542,837 people
- City population
- 280,599
- Metro
- Minneapolis-St. Paul-Bloomington, MN-WI
- Population (ZIP)
- 17,775
- Household income
- $54,130
- Rent vs Own
- Severe rent burden
- 818.0
Population outlook (Ramsey County) Hauer SSP2
- Today (2025)
- 603,431 people
- By 2030
- 636,459 · +5.5%
- By 2040
- 700,596 · +16.1%
- By 2050
- 765,819 · +26.9%
- By 2075
- 929,297 · +54.0%
- By 2100
- 1,053,924 · +74.7%
Race, ethnicity, and origin ACS 2023
- Neighborhood character
- Diverse neighborhood (Simpson 0.69)
- Race & ethnicity
- Asian 47% Black 22% White 19% Hispanic / Latino 9% Two or more races 4%
- Hispanic origin (detail)
- Mexican 6%
- Common ancestry
- Portuguese 3% Swedish 2% Romanian 1%
- Foreign-born
- 33% · Philippines, Canada, Vietnam
- Languages at home
- 44% English-only · Other Asian/Pacific 37% Spanish 7% Other Indo-European 1%
Political lean MEDSL · Ramsey
- 2024 margin
- Solid D (+43.3) · D 70.5% · R 27.2% · Other 2.3%
- 2008→2024 swing
- +9.4pp toward D · 2008: 33.9pp · 2024: 43.3pp
- All cycles
- 2024: D+43.3 2020: D+45.4 2016: D+39.4 2012: D+35.3 2008: D+33.9
Not yet ingested
- Civics
- —
Market trends
- HPI YoY
- ▼ -60.12%
- Current HPI
- 281.2507
- Rent YoY
- ▲ 3.94%
- Metro
- Minneapolis-St. Paul-Bloomington, MN-WI
- State GDP YoY
- ▲ 2.41%
- F500 in state
- 34
Industry mix (Fortune 500 HQ in MN)
| Industry | F500 HQs | Revenue |
|---|---|---|
| Healthcare | 2 | $407B |
|
||
| Retail | 2 | $150B |
|
||
| Consumer Goods | 2 | $32B |
|
||
| Industrial Machinery | 2 | $6B |
|
||
| Agriculture | 1 | $40B |
|
||
| Healthcare / Medical Devices | 1 | $32B |
|
||
Price history
+480.4% since first listed36 events — show timeline
- 2026-04-20 Pending — NORTHSTARMLS as Distributed by MLS Grid
- 2026-04-13 Contingent — NORTHSTARMLS as Distributed by MLS Grid
- 2026-04-03 Listed $249,000 NORTHSTARMLS as Distributed by MLS Grid
- 2026-03-30 Coming Soon $249,000 NORTHSTARMLS as Distributed by MLS Grid
- 2025-11-05 Sold (Public Records) $425,000 Public Records
- 2012-03-06 Sold (MLS) $94,900 NORTHSTARMLS as Distributed by MLS Grid
- 2012-02-15 Listing Removed — NORTHSTARMLS as Distributed by MLS Grid
- 2012-02-07 Listed $94,500 NORTHSTARMLS as Distributed by MLS Grid
- 2011-11-18 Listing Removed — NORTHSTARMLS as Distributed by MLS Grid
- 2011-08-16 Listed $94,500 NORTHSTARMLS as Distributed by MLS Grid
- 2011-08-06 Listing Removed — NORTHSTARMLS as Distributed by MLS Grid
- 2011-01-21 Listed $119,000 NORTHSTARMLS as Distributed by MLS Grid
- 2009-03-31 Sold (Public Records) $16,500 Public Records
- 2009-01-06 Sold (MLS) $16,500 NORTHSTARMLS as Distributed by MLS Grid
- 2008-12-09 Listing Removed — NORTHSTARMLS as Distributed by MLS Grid
- 2008-11-17 Listed $18,500 NORTHSTARMLS as Distributed by MLS Grid
- 2005-02-15 Sold (MLS) $203,000 NORTHSTARMLS as Distributed by MLS Grid
- 2004-11-05 Listing Removed — NORTHSTARMLS as Distributed by MLS Grid
- 2004-10-15 Listed $199,900 NORTHSTARMLS as Distributed by MLS Grid
- 1999-09-02 Sold (Public Records) $49,000 Public Records
- 1999-06-04 Sold (MLS) $49,000 NORTHSTARMLS as Distributed by MLS Grid
- 1999-04-08 Listing Removed — NORTHSTARMLS as Distributed by MLS Grid
- 1999-02-28 Listed $55,000 NORTHSTARMLS as Distributed by MLS Grid
- 1998-11-14 Listing Removed — NORTHSTARMLS as Distributed by MLS Grid
- 1998-09-14 Listed $55,000 NORTHSTARMLS as Distributed by MLS Grid
- 1998-08-22 Listing Removed — NORTHSTARMLS as Distributed by MLS Grid
- 1998-05-22 Listed $49,900 NORTHSTARMLS as Distributed by MLS Grid
- 1997-06-08 Listing Removed — NORTHSTARMLS as Distributed by MLS Grid
- 1996-11-18 Listed $55,000 NORTHSTARMLS as Distributed by MLS Grid
- 1995-04-13 Sold (MLS) $35,000 NORTHSTARMLS as Distributed by MLS Grid
- 1995-03-13 Listing Removed — NORTHSTARMLS as Distributed by MLS Grid
- 1994-05-26 Listed $37,500 NORTHSTARMLS as Distributed by MLS Grid
- 1994-05-25 Listing Removed — NORTHSTARMLS as Distributed by MLS Grid
- 1994-02-07 Listed $39,900 NORTHSTARMLS as Distributed by MLS Grid
- 1994-01-31 Listing Removed — NORTHSTARMLS as Distributed by MLS Grid
- 1993-07-31 Listed $42,900 NORTHSTARMLS as Distributed by MLS Grid
Property tax history
+13.8%/yrLatest (2025): $4,964 · +13.4% YoY. Source: county tax records.
Cash-flow waterfall
monthlySold comps — $/sqft
last 12 mo · ≤1 miLoading sold comps…