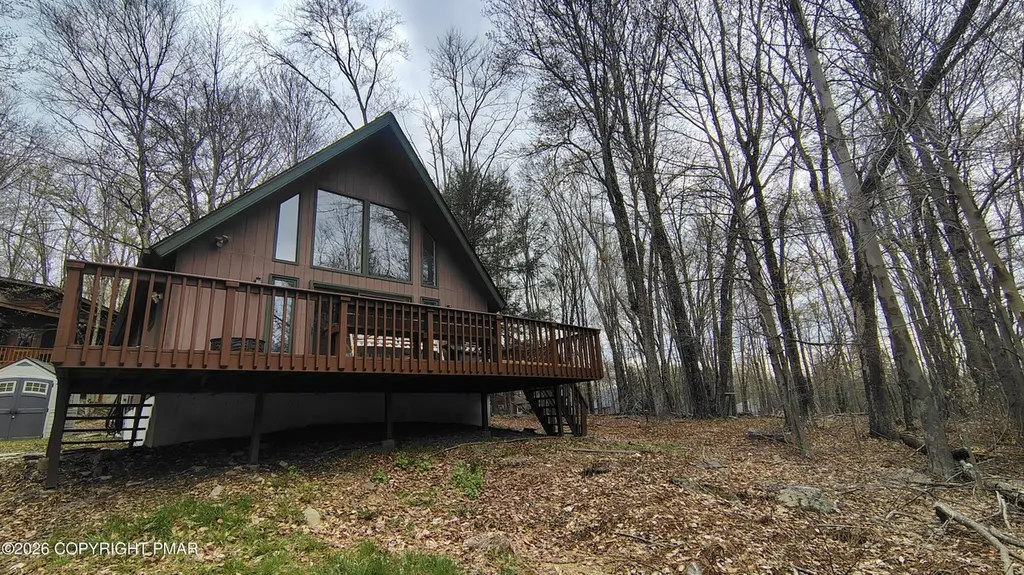
85 Cedarwood Ter · Salem, PA
Flood risk 1/10 · Minimal
- FEMA flood zone
- X (unshaded)
- Chance of flooding over 30 yrs
- 0.0%
- Est. flood insurance / yr
- $507 – $1,088
Fire risk 1/10 · Minimal
- Est. fire insurance / yr
- $511 – $949
Heat risk 2/10 · Minimal
- Hot days now (above 91°F)
- 7 days/yr
- Hot days in 30 yrs
- 16 days/yr
Wind risk 2/10 · Minimal
- Chance of severe wind over 30 yrs
- 4.0%
Air-quality risk 2/10 · Minimal
- Unhealthy air days now
- 1 days/yr
- Unhealthy air days in 30 yrs
- 2 days/yr
Risk factors via First Street. Map © Google.
Why this score? — see what drove the B grade
The composite is a weighted blend of 9 inputs, each scored 0–100. Each bar is that input's sub-score; the figure is the points it added to the 100-point composite (weight × sub-score).
- Cash flow +25.9/30.0
- ARV discount +12.2/15.0
- DSCR +8.7/10.0
- 1% rule +7.9/10.0
- Appreciation +5.0/10.0
- Schools +4.4/10.0
- Condition / age +3.8/5.0
- Rent growth +2.5/5.0
- Livability +2.5/5.0
$225,000
🖨 Deal sheet (PDF) 📄 Offer letter ✓ Due diligence
Listing remarks
Escape to this cute-as-a-button 3-bedroom, 1-bath chalet with a bonus room and spacious loft featuring an air hockey table. This charming home comes fully furnished and is located in the heart of The Hideout. Step inside to an inviting open-concept living space with soaring cathedral ceilings, an updated kitchen, and a cozy brick-accented LP fireplace--perfect for relaxing after a day of enjoying the great outdoors. With three comfortable bedrooms, there's plenty of space for family and friends. A bonus den or playroom and an open loft area provide additional flexibility for work, relaxation, or entertainment. The Hideout is a premier gated community offering a true resort-style lifestyle.
Key facts
- Bonus room
- Sandy beaches
- Updated kitchen
Tags
Property features AI
Finance
- Other: Located in The Hideout subdivision
- HOA & community: Homeowners association with annual fee (security included); Association amenities include security, gated access, clubhouse, playground, recreation room, billiard room, golf course, ski access, tennis courts, basketball court, and pool
Exterior
- Parking: Driveway; 6 open parking spaces
- Utilities: Private water; Private sewer; 200+ amp electric service
- Home design: Single-family house; Residential property; Approximately 1,157 above-grade finished area
- Construction: Shingle roof
- Exterior features: Shingle roof; Shed(s); Cleared lot; Gravel road; public maintained road
Interior
- Kitchen: Electric range; Refrigerator; Microwave
- Flooring: Carpet; Hardwood; Tile
- Bathrooms: 1 full bathroom
- Heating & cooling: Ceiling fan(s) for cooling
- Interior features: Vaulted ceilings; Furnished; Gas family-room fireplace (1)
- Laundry & utility: Washer; Dryer; Laundry on main level; Crawl space with sump pump
Neighborhood map
What this means for you Summary
Snapshot
- This is a 3-bed/1.0-bath single-family listed at $225k. Condition is rated good.
Deal economics
- At list price, monthly cash flow is $556 ($7k/yr) — positive.
- The deal already cash-flows at list — no discount required.
- Meets the 1% rule at list price ($3k rent vs $225k).
- Recommended offer: $222k (1.5% below list) — sets the bar for market timing.
Location & tenants
- Location reads: area grade B — affects rentability + tenant quality, not the cash-flow math above.
- Western Wayne SD (rural): math 39% / reading 63% proficiency, ranked #165 of 539 in PA (top 31%) — acceptable for families but not a draw, mixed tenant base, ~2y average lease.
- Zoned schools: Evergreen El Sch (math 42% / reading 68%, grade C, #498 of 1,518 statewide, top 33%, 506 students, 64% FRL); Western Wayne Ms (math 21% / reading 61%, grade F, #243 of 512 statewide, top 48%, 411 students, 57% FRL); Western Wayne Hs (math 77% / reading 24%, grade D+, #125 of 437 statewide, top 30%, 545 students, 49% FRL) — zoned schools average 56% FRL vs 41% district-wide (16 pts higher); higher-poverty schools than district average — tighter screening recommended.
- Market conditions: 5 active listings in the ZIP; 1 comparable units currently listed for rent nearby; 177 units permitted in Wayne County in 2024 (0 in 5+ unit buildings).
Forward outlook
- In year one you build about $8k of equity ($2k loan paydown + $7k appreciation (3.0% local appreciation)).
- Wayne County population projected at -17% by 2050 — secular population decline; favor cash flow + early exit over multi-decade hold.
- At projected returns (3.0% appreciation + 3.0% rent growth), your $63k cash investment doubles in ~4 years — after that, you're playing with house money.
- By year 5, paydown + projected appreciation supports a ~$36k cash-out refi (75% LTV) — recoverable capital for the next deal without selling this one.
Negotiation context
- It's been on market 24 days — a 2% lower offer ($222k) is reasonable based on typical stale-listing flexibility.
Questions for the listing agent
- Built in 1979 — when were the roof, HVAC, electrical panel, plumbing, and water heater last replaced?
- What does the HOA fee cover, when was the last increase, and are there any pending special assessments or reserve-fund shortfalls?
- Is there a deadline driving the sale (1031 exchange, divorce, estate, relocation)? That informs how much negotiation room exists.
- What's the average days-on-market for RENTAL listings here right now (not sales)? A rising rental-DOM trend means longer vacancies and softer asking-rent achievability than the comps imply.
- What's the recent tenant-quality profile in this submarket — average credit score on applications, eviction rate, late-payment / NSF rate, and stable-employment percentage? A property-management company in the area should have these aggregated.
- How much new for-sale + rental construction is in the pipeline within 1–3 miles? Heavy new supply typically softens prices + rents 12–24 months out; constrained supply supports both.
Investment metrics
- 1% rule
- 1.29% ✓
- Cap rate
- 9.26%
- Cash-on-cash
- 10.59%
- DSCR
- 1.47
- GRM
- 6.5
CMA / ARV
- ARV (on-the-fly)
- $251,069
- Comps found
- 12
Show comp detail 12 sales within ~0.75 mi
| Address | Dist | Beds/Ba | Sqft | Sold | Price | $/sf | Match |
|---|---|---|---|---|---|---|---|
| 265 Parkwood Dr | 0.09mi | 3/1.5 | 1,120 (-3%) | 0mo | $289,990 | $259 | 88 |
| 126 Oak Cir | 0.14mi | 3/1.0 | 1,200 (+4%) | 8mo | $260,000 | $217 | 81 |
| 12 Oak Ct | 0.37mi | 3/1.0 | 1,140 (-2%) | 7mo | $257,000 | $225 | 74 |
| 12 Oak Court Ct | 0.37mi | 3/1.0 | 1,140 (-2%) | 7mo | $257,000 | $225 | 74 |
| 28 Lakewood Dr | 0.28mi | 2/1.0 (-1) | 1,100 (-5%) | 6mo | $162,500 | $148 | 69 |
| 10 Vista Ct | 0.35mi | 3/2.0 | 1,205 (+4%) | 6mo | $241,700 | $201 | 68 |
| 80 Lakewood Dr | 0.14mi | 3/2.0 | 1,050 (-9%) | 12mo | $255,000 | $243 | 64 |
| 11 Oak Ct | 0.34mi | 3/2.0 | 1,176 (+2%) | 19mo | $235,000 | $200 | 61 |
| 210 Deerfield Rd | 0.74mi | 2/2.0 (-1) | 1,100 (-5%) | 7mo | $239,000 | $217 | 43 |
| 35 Elmwood Ct | 0.75mi | 2/1.5 (-1) | 1,012 (-12%) | 6mo | $262,000 | $259 | 32 |
| 15 Windemere Ln | 0.69mi | 3/1.5 | 1,300 (+12%) | 19mo | $282,000 | $217 | 29 |
| 81 Parkwood Dr Lot 65 | 0.65mi | 3/2.0 | 1,330 (+15%) | 15mo | $265,000 | $199 | 28 |
Match score weights: distance 35% · size 25% · config 20% · recency 20%. Top-matched comps best support the ARV.
Projected returns pro-forma
3.0% appreciation · 3.0% rent growth · sell at horizon
- IRR
- 17.5%
- Equity multiple
- 1.99×
- Total profit
- $62,676
- Equity at exit
- $101,170
- IRR
- 18.9%
- Equity multiple
- 3.76×
- Total profit
- $173,731
- Equity at exit
- $155,915
Cash invested: $63,000 (down + closing). Projections, not guarantees.
Landlord ↔ Tenant lean methodology
- Overall (STATE)
- 62 Landlord-Friendly
- State Pennsylvania
- 62 Landlord-Friendly · EVEN
- County
- — inherits STATE
- City
- — inherits STATE
ZIP-level market 18427
- Active inventory
- 5
- Price-to-rent
- 6.5×
Monthly cashflow live
- Estimated rent
- $2,900 medium interval (Pro) →
- Mortgage (P&I)
- −$1,180
- Tax est. 1.5%
- −$281 /mo · $3,375/yr
- Insurance
- −$94
- HOA
- −$180
- Vacancy / Maint / Mgmt
- −$609
- Net cashflow
- $556
Break-even live
Sensitivity live
| Price | -10% $712 | -5% $634 | +0% $556 | +5% $478 | +10% $401 |
|---|---|---|---|---|---|
| Rent | -10% $327 | -5% $442 | +0% $556 | +5% $671 | +10% $785 |
| Rate | -1.0pp $669 | -0.5pp $613 | base $556 | +0.5pp $498 | +1.0pp $438 |
UW: 25.0% down · 7.5% · 30yr · 1.5% tax · 5.0% vac · 8.0% maint · 8.0% mgmt
Financing live
Cash to close
- Down payment
- $56,250
- Closing costs
- $6,750
- Reserves months
- —
- Total cash needed
- —
Loan-product check · same deal, 3 products live
Conventional
25% down · 7.5% · 30yr
- Down + closing
- —
- Monthly P&I
- —
- Monthly cashflow
- —
- DSCR
- —
- Eligible?
- —
Personal DTI + credit; lowest rate.
DSCR
20% down · 8.5% · 30yr
- Down + closing
- —
- Monthly P&I
- —
- Monthly cashflow
- —
- DSCR
- —
- Eligible?
- —
No personal income docs; deal must DSCR.
Hard money
10% down · 12.0% · 12mo
- Down + closing
- —
- Monthly P&I
- —
- Monthly cashflow
- —
- DSCR
- —
- Eligible?
- —
Short-term bridge; refi at stabilization.
Rent comps 1 comps
| Address | Beds | Baths | Sqft | Rent | $/sqft | DOM | Units | Dist |
|---|---|---|---|---|---|---|---|---|
| 1148 Golf Park Dr Lake Ariel, PA | 3.0 | 1.0 | 1210 | $2,900 | $2.40 | 26d | 1 | 1.36mi |
HOA detail
- Monthly dues
- $180 · $2,160/yr
- Likely covers
- security
Listing history 17 events
-
2026-06-21days on market $225,000 Active 24 DOM
-
2026-06-18days on market $225,000 Active 21 DOM
-
2026-06-17days on market $225,000 Active 20 DOM
-
2026-06-16days on market $225,000 Active 19 DOM
-
2026-06-15days on market $225,000 Active 18 DOM
-
2026-06-14days on market $225,000 Active 16 DOM
-
2026-06-13days on market $225,000 Active 15 DOM
-
2026-06-10days on market $225,000 Active 13 DOM
-
2026-06-09days on market $225,000 Active 12 DOM
-
2026-06-08days on market $225,000 Active 11 DOM
-
2026-06-07pricedays on market $225,000 Active 10 DOM
-
2026-06-03days on market $230,000 Active 6 DOM
-
2026-06-02days on market $230,000 Active 5 DOM
-
2026-06-01days on market $230,000 Active 4 DOM
-
2026-05-31days on market $230,000 Active 3 DOM
-
2026-05-30days on market $230,000 Active 2 DOM
-
2026-05-28$230,000 Active
ⓘ Source: listings_history table (triggers on properties + properties_extension) + one-shot
backfill from property_details.listing_events for pre-trigger history.
Climate risk First Street
- Flood 1/10 Low FEMA zone X (unshaded) · 0% chance over 30 yrs
- Wildfire 1/10 Low
- Heat 2/10 Low 7 d/yr ≥91°F today · 16 d/yr by 30 yrs out
- Wind 2/10 Low 4% chance of damaging wind over 30 yrs
- Air quality 2/10 Low 1 unhealthy d/yr today · 2 by 30 yrs out
Nearby sold comps map
Loading sold comps map…
Walkable amenities ~0.75 mi
Loading nearby amenities…
Taxation est. · year 1
- Rental income
- $34,800
- − Mortgage interest
- −$12,603
- − Property taxes
- −$3,375
- − Insurance
- −$1,125
- − Repairs & maintenance
- −$2,784
- − Management
- −$2,784
- − HOA
- −$2,160
- − Depreciation
- −$6,545
- Taxable income
- $3,423
- Est. tax owed @ 24.0%
- −$822
- After-tax cash flow
- $5,851/yr
For passive investors: Depreciation is non-cash, so a rental often shows a tax loss while cash-flowing — sheltering income. Rental losses are passive: they offset passive income freely, and up to $25,000/yr can offset ordinary (W-2) income if you actively participate and your MAGI is under $100k (phasing out to $0 by $150k); unused losses carry forward. On sale, claimed depreciation is recaptured at up to 25%, and gains may owe capital-gains tax (a 1031 exchange can defer both). Figures are a year-1 estimate at your 24.0% rate — not tax advice; consult a CPA.
Condition & rehab AI · 12 photos
This charming 3-bedroom chalet in The Hideout is move-in ready with a good condition and a good ROI potential.
Value-add opportunities
- Resale Paint exterior — Enhances curb appeal and value
- Rental Replace ceiling fans — Improves comfort and energy efficiency
Renovation cost estimate screening
Value-add ROI direction
- Resale Paint exterior — Enhances curb appeal and value ↑
- Rental Replace ceiling fans — Improves comfort and energy efficiency ↑
ⓘ Cost ranges are severity-bucket heuristics (US national rule-of-thumb). Get contractor quotes + a written scope before underwriting a rehab budget.
Schools (NCES district)
- District
- Western Wayne SD
- NCES district ID
- 4226070
- Math proficiency
- 39% ▼ -12.00%
- Reading proficiency
- 63% ▼ -6.00%
- Median HH income
- $51,358
- Composite
- 43.65/100
- National rank
- #2964
- State rank
- #165 of 539 in PA
Livability — Salem
No livability data for this city. (Only ~50 U.S. cities are tracked.)
Census & demographics
- Census place
- The Hideout, PA
Population outlook (Wayne County) Hauer SSP2
- Today (2025)
- 47,924 people
- By 2030
- 46,191 · -3.6%
- By 2040
- 42,815 · -10.7%
- By 2050
- 39,873 · -16.8%
- By 2075
- 34,556 · -27.9%
- By 2100
- 28,358 · -40.8%
Not yet ingested
- Political lean
- —
- Race & ethnicity
- —
- Common origin
- —
- Civics
- —
Market trends
- HPI YoY
- —
- Current HPI
- —
- Rent YoY
- —
- Metro
- —
- State GDP YoY
- ▲ 1.68%
- F500 in state
- 34
Industry mix (Fortune 500 HQ in PA)
| Industry | F500 HQs | Revenue |
|---|---|---|
| Healthcare | 2 | $309B |
|
||
| Insurance | 2 | $27B |
|
||
| Telecommunications / Media | 1 | $124B |
|
||
| Industrial Distribution | 1 | $22B |
|
||
| Financial Services | 1 | $20B |
|
||
| Chemicals / Materials | 1 | $18B |
|
||
Price history
1 event — show timeline
- 2026-05-28 Listed $230,000 PMAR
Cash-flow waterfall
monthlySold comps — $/sqft
last 12 mo · ≤1 miLoading sold comps…