521 Hoover St · Pomona, KS
Flood risk 1/10 · Minimal
- FEMA flood zone
- X (unshaded)
- Chance of flooding over 30 yrs
- 0.0%
- Est. flood insurance / yr
- $507 – $1,088
Fire risk 5/10 · Moderate
- Est. fire insurance / yr
- $1,154 – $2,142
Heat risk 4/10 · Minor
- Hot days now (above 108°F)
- 7 days/yr
- Hot days in 30 yrs
- 17 days/yr
Wind risk 2/10 · Minimal
- Chance of severe wind over 30 yrs
- —
Air-quality risk 2/10 · Minimal
- Unhealthy air days now
- 1 days/yr
- Unhealthy air days in 30 yrs
- 1 days/yr
Risk factors via First Street. Map © Google.
Why this score? — see what drove the B+ grade
The composite is a weighted blend of 9 inputs, each scored 0–100. Each bar is that input's sub-score; the figure is the points it added to the 100-point composite (weight × sub-score).
- Cash flow +30.0/30.0
- DSCR +10.0/10.0
- Appreciation +10.0/10.0
- 1% rule +8.0/10.0
- ARV discount +7.5/15.0
- Livability +3.2/5.0
- Rent growth +2.5/5.0
- Condition / age +2.5/5.0
- Schools +2.4/10.0
$83,500
🖨 Deal sheet 📄 Offer letter ✓ Due diligence
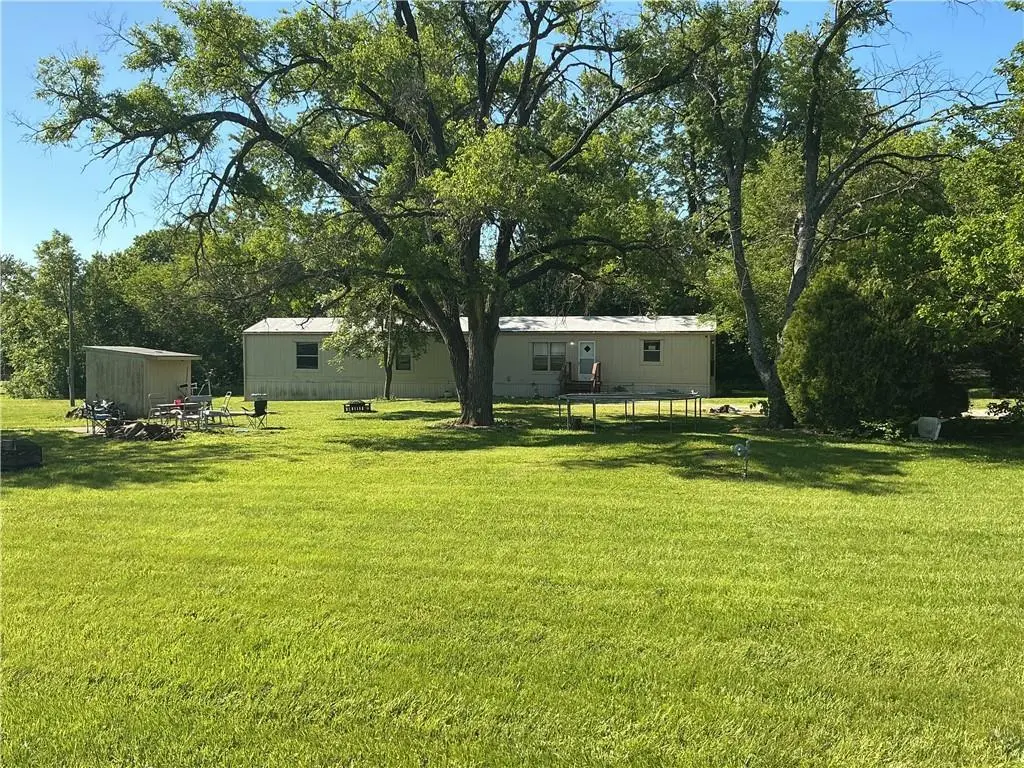
Listing remarks
This well-maintained 1989 mobile home has been lovingly cared for and it shows! Inside, you’ll find tons of kitchen storage, built-ins, a pantry, center island, and plenty of space for convenient eat-in dining. Situated on an extra-large corner lot, this property offers endless possibilities—enjoy the spacious yard and comfortable home for under $100K, or live in the mobile while you build your dream home with plenty of elbow room. A rare opportunity with space, value, and potential all in one! Recent updates include new shower in primary bath, Update/Remodel interior and new roof coating/sealer.
Key facts
- Pantry
- Spacious yard
- Kitchen storage
Tags
Property features AI
Finance
- Other: Not in a flood plain
- HOA & community: No association fees
Exterior
- Parking: Off-street parking
- Utilities: City/public water (verify); Public sewer
- Home design: Residential villa; Ranch floor plan; Single-story (main level); Mobile/manufactured home
- Construction: Metal siding; Vinyl siding; Metal roof; Crawl space foundation; Approximately 31–40 years old
- Exterior features: Front porch; Shed(s); Corner city lot with paved public street
Interior
- Kitchen: Kitchen on main level
- Bedrooms: 3 bedrooms (all on main level)
- Flooring: Carpet; Vinyl
- Bathrooms: 2 full bathrooms
- Heating & cooling: Forced air heating; Electric cooling
- Interior features: Ceiling fans; Pantry; Eat-in kitchen
- Laundry & utility: Laundry in hall on main level
Neighborhood map
What this means for you Summary
Snapshot
- This is a 3-bed/2.0-bath manufactured listed at $84k.
Deal economics
- At list price, monthly cash flow is $349 ($4k/yr) — positive.
- The deal already cash-flows at list — no discount required.
- Meets the 1% rule at list price ($1k rent vs $84k).
Location & tenants
- Location reads 63/100 on livability (#342 in KS) — a middle-class / working-renter tenant base. Strengths: cost of living A+, crime A-, housing A-; Watch: schools D, amenities F, commute F.
- West Franklin (rural): math 25% / reading 30% proficiency, ranked #113 of 169 in KS (top 67%) — low school quality limits family demand, transient renter base, plan for 1-2y turnover.
- Market conditions: 15 active listings in the ZIP; 85 units permitted in Franklin County in 2024 (0 in 5+ unit buildings).
Forward outlook
- In year one you build about $9k of equity ($577 loan paydown + $8k appreciation (10.0% local appreciation)).
- Franklin County population projected at -17% by 2050 — secular population decline; favor cash flow + early exit over multi-decade hold.
- At projected returns (10.0% appreciation + 3.0% rent growth), your $23k cash investment doubles in ~2 years — after that, you're playing with house money.
- By year 4, paydown + projected appreciation supports a ~$32k cash-out refi (75% LTV) — recoverable capital for the next deal without selling this one.
Negotiation context
- Only 5 days on market — expect competitive offers; lowballing is unlikely to land.
- Current owner paid $20k; list at $84k implies a 318% gain — meaningful room to come down on a strong offer.
Risks & watch-outs
- Climate carrying-cost: moderate wildfire risk — expect insurance premiums to compound above CPI over the hold.
Questions for the listing agent
- Is there a deadline driving the sale (1031 exchange, divorce, estate, relocation)? That informs how much negotiation room exists.
- Schools are D-rated, which usually means shorter tenancies and higher turnover. Who's the typical renter profile here, and what's been the actual vacancy rate?
- What's the average days-on-market for RENTAL listings here right now (not sales)? A rising rental-DOM trend means longer vacancies and softer asking-rent achievability than the comps imply.
- What's the recent tenant-quality profile in this submarket — average credit score on applications, eviction rate, late-payment / NSF rate, and stable-employment percentage? A property-management company in the area should have these aggregated.
- How much new for-sale + rental construction is in the pipeline within 1–3 miles? Heavy new supply typically softens prices + rents 12–24 months out; constrained supply supports both.
Investment metrics
- 1% rule
- 1.30% ✓
- Cap rate
- 11.31%
- Cash-on-cash
- 17.93%
- DSCR
- 1.80
- GRM
- 6.4
CMA / ARV
No comps found within radius.
Projected returns pro-forma
10.0% appreciation · 3.0% rent growth · sell at horizon
- IRR
- 37.6%
- Equity multiple
- 3.90×
- Total profit
- $67,706
- Equity at exit
- $75,223
- IRR
- 32.4%
- Equity multiple
- 8.78×
- Total profit
- $181,834
- Equity at exit
- $162,222
Cash invested: $23,380 (down + closing). Projections, not guarantees.
Landlord ↔ Tenant lean methodology
- Overall (STATE)
- 83 Strongly Landlord-Friendly
- State Kansas
- 83 Strongly Landlord-Friendly · R+10
- County
- — inherits STATE
- City
- — inherits STATE
ZIP-level market 66076
- Home prices YoY
- 14.0%
- Active inventory
- 15
- Price-to-rent
- 6.4×
Monthly cashflow live
- Estimated rent
- $1,088 medium interval (Pro) →
- Mortgage (P&I)
- −$438
- Tax from tax record
- −$37 /mo · $450/yr
- Insurance
- −$35
- HOA
- −$0
- Vacancy / Maint / Mgmt
- −$228
- Net cashflow
- $349
Break-even live
UW: 25.0% down · 7.5% · 30yr · 1.5% tax · 5.0% vac · 8.0% maint · 8.0% mgmt
Financing live
Cash to close
- Down payment
- $20,875
- Closing costs
- $2,505
- Reserves months
- —
- Total cash needed
- —
Loan-product check · same deal, 3 products live
Conventional
25% down · 7.5% · 30yr
- Down + closing
- —
- Monthly P&I
- —
- Monthly cashflow
- —
- DSCR
- —
- Eligible?
- —
Personal DTI + credit; lowest rate.
DSCR
20% down · 8.5% · 30yr
- Down + closing
- —
- Monthly P&I
- —
- Monthly cashflow
- —
- DSCR
- —
- Eligible?
- —
No personal income docs; deal must DSCR.
Hard money
10% down · 12.0% · 12mo
- Down + closing
- —
- Monthly P&I
- —
- Monthly cashflow
- —
- DSCR
- —
- Eligible?
- —
Short-term bridge; refi at stabilization.
Listing history 4 events
-
2026-05-17status Pending
-
2026-05-11$83,500 Active
-
2003-06-01soldstatus $20,000
-
1995-06-01soldstatus $10,000
ⓘ Source: listings_history table (triggers on properties + properties_extension) + one-shot
backfill from property_details.listing_events for pre-trigger history.
Tax reassessment forecast KS · Resets to sale price
- Current annual tax
- $450 · $37/mo
- Projected year-2 tax
- $1,177 · $98/mo
- Expected delta
- +$728/yr (+$61/mo · 161.9%)
ⓘ Screening estimate from a state-policy table — verify with the county assessor before closing.
Climate risk First Street
- Flood 1/10 Low FEMA zone X (unshaded) · 0% chance over 30 yrs
- Wildfire 5/10 Major
- Heat 4/10 Moderate 7 d/yr ≥108°F today · 17 d/yr by 30 yrs out
- Wind 2/10 Low
- Air quality 2/10 Low 1 unhealthy d/yr today · 1 by 30 yrs out
Nearby sold comps map
Loading sold comps map…
Walkable amenities ~0.75 mi
Loading nearby amenities…
Taxation est. · year 1
- Rental income
- $13,057
- − Mortgage interest
- −$4,677
- − Property taxes
- −$450
- − Insurance
- −$418
- − Repairs & maintenance
- −$1,045
- − Management
- −$1,045
- − Depreciation
- −$2,429
- Taxable income
- $2,994
- Est. tax owed @ 24.0%
- −$719
- After-tax cash flow
- $3,474/yr
For passive investors: Depreciation is non-cash, so a rental often shows a tax loss while cash-flowing — sheltering income. Rental losses are passive: they offset passive income freely, and up to $25,000/yr can offset ordinary (W-2) income if you actively participate and your MAGI is under $100k (phasing out to $0 by $150k); unused losses carry forward. On sale, claimed depreciation is recaptured at up to 25%, and gains may owe capital-gains tax (a 1031 exchange can defer both). Figures are a year-1 estimate at your 24.0% rate — not tax advice; consult a CPA.
Schools (NCES district)
- District
- West Franklin
- NCES district ID
- 2010800
- Math proficiency
- 25% ▼ -14.00%
- Reading proficiency
- 30% ▼ -6.00%
- Median HH income
- $52,425
- Composite
- 24.35/100
- National rank
- #7696
- State rank
- #113 of 169 in KS
Livability — Pomona
- Score
- 63/100
- State rank
- #342
- US rank
- #15371
Category grades
Schools grade is shown separately in the Schools card above.
Census & demographics
- Census place
- Pomona, KS
- Population (ZIP)
- 2,231
Population outlook (Franklin County) Hauer SSP2
- Today (2025)
- 24,777 people
- By 2030
- 24,116 · -2.7%
- By 2040
- 22,426 · -9.5%
- By 2050
- 20,555 · -17.0%
- By 2075
- 17,149 · -30.8%
- By 2100
- 14,526 · -41.4%
Race, ethnicity, and origin ACS 2023
- Neighborhood character
- Predominantly White (93%)
- Race & ethnicity
- White 93% Two or more races 5%
- Common ancestry
- Italian 6% Iranian 5% Serbian 3%
- Foreign-born
- 4% · Canada
- Languages at home
- 99% English-only · Spanish 1%
Political lean MEDSL · Franklin
- 2024 margin
- Solid R (+40.1) · D 28.9% · R 69.0% · Other 2.0%
- 2008→2024 swing
- -17.6pp toward R · 2008: -22.5pp · 2024: -40.1pp
- All cycles
- 2024: R+40.1 2020: R+38.4 2016: R+39.4 2012: R+30.4 2008: R+22.5
Not yet ingested
- Civics
- —
Market trends
- HPI YoY
- ▲ 40.47%
- Current HPI
- 330.3451
- Rent YoY
- —
- Metro
- —
- State GDP YoY
- —
- F500 in state
- 0
Price history
+735.0% since first listed4 events — show timeline
- 2026-05-17 Pending — Heartland MLS as Distributed by MLS Grid
- 2026-05-11 Listed $83,500 Heartland MLS as Distributed by MLS Grid
- 2003-06-01 Sold (Public Records) $20,000 Public Records
- 1995-06-01 Sold (Public Records) $10,000 Public Records
Property tax history
+9.4%/yrLatest (2025): $450 · +6.6% YoY. Source: county tax records.
Cash-flow waterfall
monthlySold comps — $/sqft
last 12 mo · ≤1 miLoading sold comps…