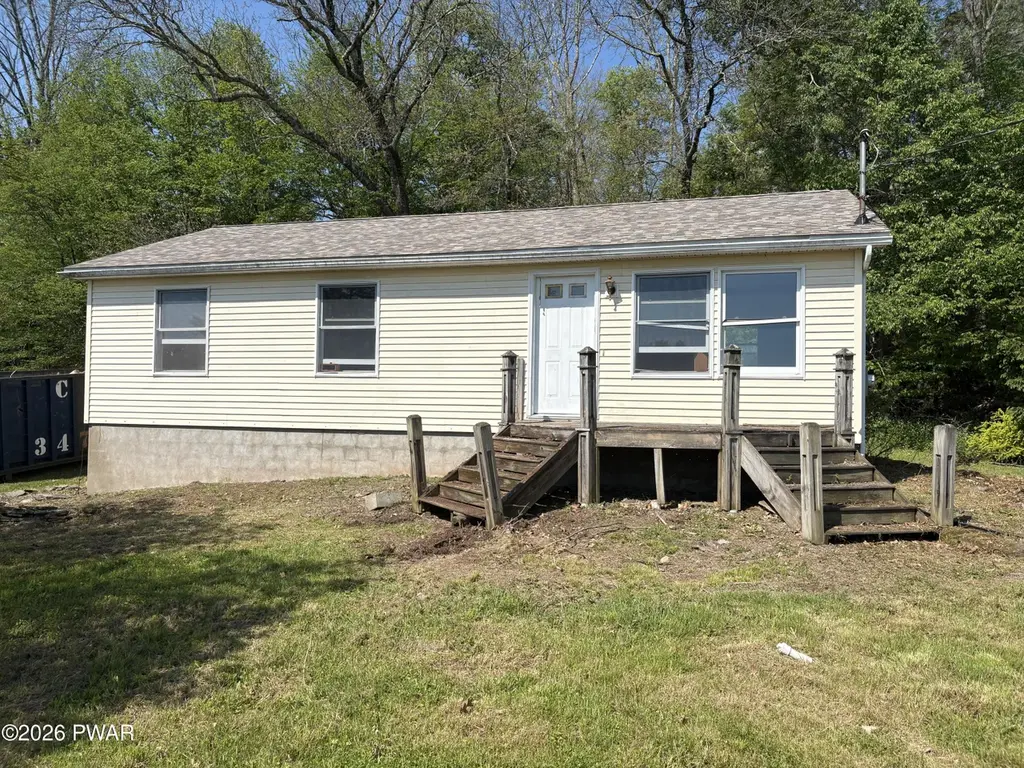
77 Bavarian Hill Rd · Narrowsburg, NY
Flood risk 1/10 · Minimal
- FEMA flood zone
- X (unshaded)
- Chance of flooding over 30 yrs
- 0.0%
- Est. flood insurance / yr
- $473 – $860
Fire risk 4/10 · Minor
- Est. fire insurance / yr
- $511 – $949
Heat risk 2/10 · Minimal
- Hot days now (above 93°F)
- 7 days/yr
- Hot days in 30 yrs
- 15 days/yr
Wind risk 2/10 · Minimal
- Chance of severe wind over 30 yrs
- 2.0%
Air-quality risk 2/10 · Minimal
- Unhealthy air days now
- 1 days/yr
- Unhealthy air days in 30 yrs
- 1 days/yr
Risk factors via First Street. Map © Google.
Why this score? — see what drove the D grade
The composite is a weighted blend of 9 inputs, each scored 0–100. Each bar is that input's sub-score; the figure is the points it added to the 100-point composite (weight × sub-score).
- Appreciation +9.5/10.0
- Cash flow +7.5/30.0
- ARV discount +7.5/15.0
- Schools +4.7/10.0
- Livability +2.8/5.0
- Rent growth +2.5/5.0
- Condition / age +2.5/5.0
- 1% rule +2.1/10.0
- DSCR +1.7/10.0
$175,000
🖨 Deal sheet 📄 Offer letter ✓ Due diligence
Listing remarks
Opportunity awaits at 77 Bavarian Hill Rd. in beautiful Beach Lake! Nestled on over an acre of secluded property along a quiet country road, this home offers privacy, peace, and endless potential. Featuring a new roof, vinyl siding, and a full basement with washer/dryer hookup, many of the important basics are already in place. The main level is framed and ready for 3 bedrooms & 1 full bath but has been mostly gutted, creating a blank canvas ready for your vision and finishing touches. Whether you're a contractor, investor, or handy buyer looking to build sweat equity, this property is packed with possibilities. Restore, redesign, or reimagine this home into the country retreat you've
Key facts
- Quiet country road
- Washer dryer hookup
- Full basement
Tags
Property features AI
Exterior
- Parking: Off-street paved parking
- Utilities: Private well water; Septic tank
- Home design: Single-family residential house; One level; Property is attached
- Construction: Block and vinyl siding construction; Asphalt roof; Block foundation; Built on a 1.09-acre lot
- Exterior features: Private yard; Deck; Has a view; Sloped front yard with gentle slope; Dirt road frontage (unimproved)
Interior
- Bathrooms: 1 full bathroom
- Heating & cooling: Baseboard electric heating
- Interior features: 6 total rooms; Full basement with walk-out access and block construction
- Laundry & utility: Laundry located in the basement
Neighborhood map
What this means for you Summary
Snapshot
- This is a 3-bed/1.0-bath single-family listed at $175k.
Deal economics
- At list price, monthly cash flow is $-214 ($-3k/yr) — negative.
- To cash-flow at today's rent, offer at most $137k (21.6% below list).
- To meet the 1% rule (rent ≥ 1% of price), the offer needs to be $124k (29.2% below list).
- Recommended offer: $124k (29.2% below list) — sets the bar for 1% rule.
- Cap rate 4.8% vs local median 1.7% in Narrowsburg — top-decile yield for the area; either an underpriced asset or a hidden risk that comps aren't pricing in. Stress-test before assuming the spread holds.
Location & tenants
- Location reads 56/100 on livability (#1,108 in NY) — a working-class tenant base; expect higher turnover. Strengths: cost of living A+, housing A; Watch: schools F, crime F, amenities F.
- Wayne Highlands SD (town): math 48% / reading 64% proficiency, ranked #115 of 539 in PA (top 21%) — acceptable for families but not a draw, mixed tenant base, ~2y average lease.
- Market conditions: 177 units permitted in Wayne County in 2024 (0 in 5+ unit buildings).
Forward outlook
- In year one you build about $17k of equity ($1k loan paydown + $16k appreciation (8.9% local appreciation)).
- Wayne County population projected at -17% by 2050 — secular population decline; favor cash flow + early exit over multi-decade hold.
- By year 3, paydown + projected appreciation supports a ~$42k cash-out refi (75% LTV) — recoverable capital for the next deal without selling this one.
Negotiation context
- It's been on market 31 days — a 3% lower offer ($170k) is reasonable based on typical stale-listing flexibility.
- Current owner paid $12k; list at $175k implies a 1358% gain — meaningful room to come down on a strong offer.
Questions for the listing agent
- What do current leases actually rent for vs. the listed asking? Can we see a recent rent roll and the last 12 months of T-12 income?
- It's been on market 31 days. Have you received any prior offers? Is the seller open to a 29% concession, seller financing, or rate buy-down credit?
- Is there a deadline driving the sale (1031 exchange, divorce, estate, relocation)? That informs how much negotiation room exists.
- Schools are F-rated, which usually means shorter tenancies and higher turnover. Who's the typical renter profile here, and what's been the actual vacancy rate?
- Crime grade is F in this area — have there been break-ins, vandalism, or insurance claims at this property in the last 3 years? What carrier currently insures it and at what premium?
- The area grade is low — what's the realistic commute time and amenity access for the typical tenant pool here? Any planned neighborhood developments (good or bad) we should know about?
- What's the average days-on-market for RENTAL listings here right now (not sales)? A rising rental-DOM trend means longer vacancies and softer asking-rent achievability than the comps imply.
- What's the recent tenant-quality profile in this submarket — average credit score on applications, eviction rate, late-payment / NSF rate, and stable-employment percentage? A property-management company in the area should have these aggregated.
- How much new for-sale + rental construction is in the pipeline within 1–3 miles? Heavy new supply typically softens prices + rents 12–24 months out; constrained supply supports both.
Investment metrics
- 1% rule
- 0.71% ✗
- Cap rate
- 4.82%
- Cash-on-cash
- -5.25%
- DSCR
- 0.77
- GRM
- 11.8
CMA / ARV
No comps found within radius.
Projected returns pro-forma
8.92% appreciation · 3.0% rent growth · sell at horizon
- IRR
- 18.2%
- Equity multiple
- 2.41×
- Total profit
- $68,879
- Equity at exit
- $144,049
- IRR
- 17.0%
- Equity multiple
- 5.31×
- Total profit
- $211,052
- Equity at exit
- $297,223
Cash invested: $49,000 (down + closing). Projections, not guarantees.
Landlord ↔ Tenant lean methodology
- Overall (STATE)
- 15 Strongly Tenant-Friendly
- State New York
- 15 Strongly Tenant-Friendly · D+10
- County
- — inherits STATE
- City
- — inherits STATE
ZIP-level market 18405
- Home prices YoY
- 2.8%
- Price-to-rent
- 11.8×
Monthly cashflow live
- Estimated rent
- $1,238 medium interval (Pro) →
- Mortgage (P&I)
- −$918
- Tax from tax record
- −$202 /mo · $2,424/yr
- Insurance
- −$73
- HOA
- −$0
- Vacancy / Maint / Mgmt
- −$260
- Net cashflow
- $-214
Break-even live
UW: 25.0% down · 7.5% · 30yr · 1.5% tax · 5.0% vac · 8.0% maint · 8.0% mgmt
Financing live
Cash to close
- Down payment
- $43,750
- Closing costs
- $5,250
- Reserves months
- —
- Total cash needed
- —
Loan-product check · same deal, 3 products live
Conventional
25% down · 7.5% · 30yr
- Down + closing
- —
- Monthly P&I
- —
- Monthly cashflow
- —
- DSCR
- —
- Eligible?
- —
Personal DTI + credit; lowest rate.
DSCR
20% down · 8.5% · 30yr
- Down + closing
- —
- Monthly P&I
- —
- Monthly cashflow
- —
- DSCR
- —
- Eligible?
- —
No personal income docs; deal must DSCR.
Hard money
10% down · 12.0% · 12mo
- Down + closing
- —
- Monthly P&I
- —
- Monthly cashflow
- —
- DSCR
- —
- Eligible?
- —
Short-term bridge; refi at stabilization.
Listing history 16 events
-
2026-06-18days on market $175,000 Active 31 DOM
-
2026-06-17days on market $175,000 Active 30 DOM
-
2026-06-16days on market $175,000 Active 29 DOM
-
2026-06-15days on market $175,000 Active 28 DOM
-
2026-06-13days on market $175,000 Active 26 DOM
-
2026-06-12pricedays on market $175,000 Active 25 DOM
-
2026-06-09days on market $180,000 Active 22 DOM
-
2026-06-08days on market $180,000 Active 21 DOM
-
2026-06-08days on market $180,000 Active 20 DOM
-
2026-06-07days on market $180,000 Active 19 DOM
-
2026-06-04days on market $180,000 Active 16 DOM
-
2026-06-02days on market $180,000 Active 15 DOM
-
2026-06-01days on market $180,000 Active 14 DOM
-
2026-05-31days on market $180,000 Active 13 DOM
-
2026-05-18$180,000 Active
-
1991-06-25soldstatus $12,000
ⓘ Source: listings_history table (triggers on properties + properties_extension) + one-shot
backfill from property_details.listing_events for pre-trigger history.
Tax reassessment forecast NY · Partial reset (capped growth)
- Current annual tax
- $2,424 · $202/mo
- Projected year-2 tax
- $2,691 · $224/mo
- Expected delta
- +$267/yr (+$22/mo · 11.0%)
ⓘ Screening estimate from a state-policy table — verify with the county assessor before closing.
Climate risk First Street
- Flood 1/10 Low FEMA zone X (unshaded) · 0% chance over 30 yrs
- Wildfire 4/10 Moderate
- Heat 2/10 Low 7 d/yr ≥93°F today · 15 d/yr by 30 yrs out
- Wind 2/10 Low 2% chance of damaging wind over 30 yrs
- Air quality 2/10 Low 1 unhealthy d/yr today · 1 by 30 yrs out
Nearby sold comps map
Loading sold comps map…
Walkable amenities ~0.75 mi
Loading nearby amenities…
Taxation est. · year 1
- Rental income
- $14,861
- − Mortgage interest
- −$9,803
- − Property taxes
- −$2,424
- − Insurance
- −$875
- − Repairs & maintenance
- −$1,189
- − Management
- −$1,189
- − Depreciation
- −$5,091
- Taxable loss
- −$5,710
- Est. tax savings @ 24.0%
- +$1,370
- After-tax cash flow
- $-1,201/yr
For passive investors: Depreciation is non-cash, so a rental often shows a tax loss while cash-flowing — sheltering income. Rental losses are passive: they offset passive income freely, and up to $25,000/yr can offset ordinary (W-2) income if you actively participate and your MAGI is under $100k (phasing out to $0 by $150k); unused losses carry forward. On sale, claimed depreciation is recaptured at up to 25%, and gains may owe capital-gains tax (a 1031 exchange can defer both). Figures are a year-1 estimate at your 24.0% rate — not tax advice; consult a CPA.
Schools (NCES district)
- District
- Wayne Highlands SD
- NCES district ID
- 4224970
- Math proficiency
- 48% ▼ -12.00%
- Reading proficiency
- 64% ▼ -10.00%
- Median HH income
- $46,476
- Composite
- 47.36/100
- National rank
- #2292
- State rank
- #115 of 539 in PA
Livability — Narrowsburg
- Score
- 56/100
- State rank
- #1108
- US rank
- #22694
Category grades
Schools grade is shown separately in the Schools card above.
Census & demographics
- Population (ZIP)
- 2,611
Population outlook (Wayne County) Hauer SSP2
- Today (2025)
- 47,924 people
- By 2030
- 46,191 · -3.6%
- By 2040
- 42,815 · -10.7%
- By 2050
- 39,873 · -16.8%
- By 2075
- 34,556 · -27.9%
- By 2100
- 28,358 · -40.8%
Race, ethnicity, and origin ACS 2023
- Neighborhood character
- Predominantly White (90%)
- Race & ethnicity
- White 90% Hispanic / Latino 8% Two or more races 2%
- Hispanic origin (detail)
- Mexican 2% Puerto Rican 4% Dominican 2%
- Common ancestry
- Romanian 9% Scottish 2% Subsaharan African 2%
- Foreign-born
- 2%
- Languages at home
- 96% English-only · Spanish 3% German/W. Germanic 1%
Political lean MEDSL · Wayne
- 2024 margin
- Solid R (+37.1) · D 31.1% · R 68.2%
- 2008→2024 swing
- -24.8pp toward R · 2008: -12.3pp · 2024: -37.1pp
- All cycles
- 2024: R+37.1 2020: R+33.6 2016: R+39.7 2012: R+20.9 2008: R+12.3
Not yet ingested
- Civics
- —
Market trends
- HPI YoY
- ▲ 8.92%
- Current HPI
- 333.3408
- Rent YoY
- —
- Metro
- —
- State GDP YoY
- ▲ 2.60%
- F500 in state
- 92
Industry mix (Fortune 500 HQ in NY)
| Industry | F500 HQs | Revenue |
|---|---|---|
| Financial Services | 10 | $950B |
|
||
| Consumer Goods | 9 | $162B |
|
||
| Insurance | 4 | $225B |
|
||
| Telecommunications | 2 | $144B |
|
||
| Pharmaceuticals | 2 | $112B |
|
||
| Media / Entertainment | 2 | $69B |
|
||
Price history
+1400.0% since first listed2 events — show timeline
- 2026-05-18 Listed $180,000 PWMLS
- 1991-06-25 Sold (Public Records) $12,000 Public Records
Property tax history
+2.6%/yrLatest (2026): $2,424 · +2.6% YoY. Source: county tax records.
Cash-flow waterfall
monthlySold comps — $/sqft
last 12 mo · ≤1 miLoading sold comps…