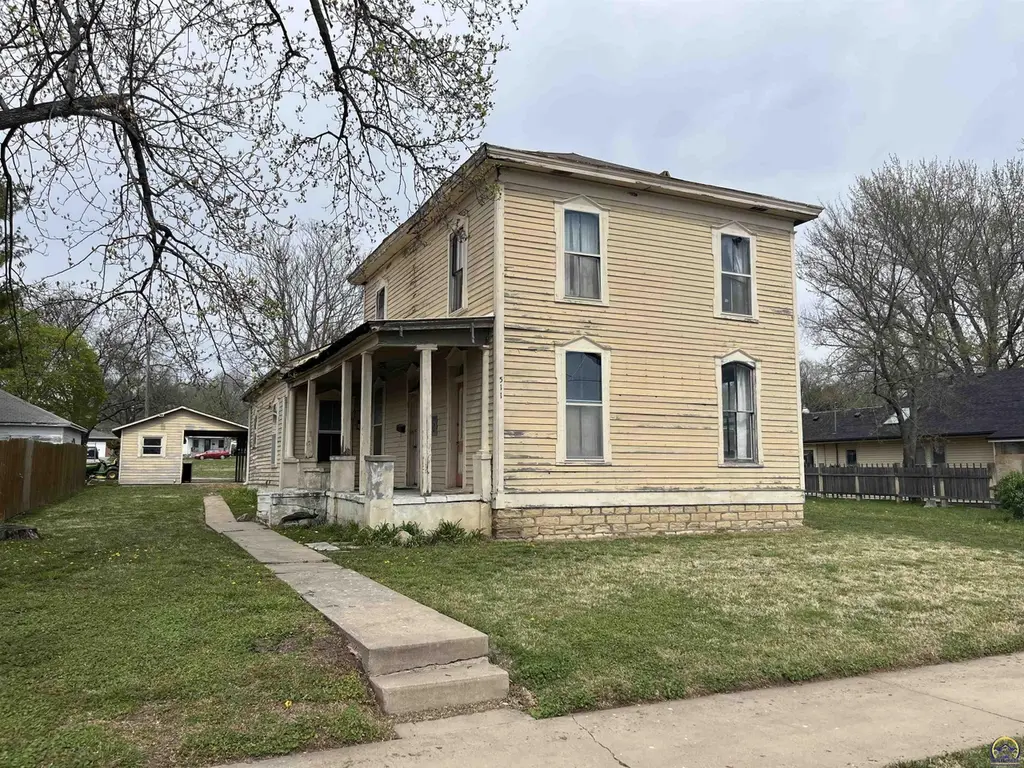
511 Mission St · St. Marys, KS
Flood risk 1/10 · Minimal
- FEMA flood zone
- X (unshaded)
- Chance of flooding over 30 yrs
- 0.0%
- Est. flood insurance / yr
- $507 – $1,088
Fire risk 5/10 · Moderate
- Est. fire insurance / yr
- $1,154 – $2,142
Heat risk 4/10 · Minor
- Hot days now (above 109°F)
- 7 days/yr
- Hot days in 30 yrs
- 17 days/yr
Wind risk 2/10 · Minimal
- Chance of severe wind over 30 yrs
- —
Air-quality risk 3/10 · Minor
- Unhealthy air days now
- 2 days/yr
- Unhealthy air days in 30 yrs
- 3 days/yr
Risk factors via First Street. Map © Google.
Why this score? — see what drove the C grade
The composite is a weighted blend of 9 inputs, each scored 0–100. Each bar is that input's sub-score; the figure is the points it added to the 100-point composite (weight × sub-score).
- Cash flow +25.2/30.0
- DSCR +8.3/10.0
- ARV discount +7.5/15.0
- 1% rule +5.4/10.0
- Schools +2.8/10.0
- Rent growth +2.5/5.0
- Livability +2.5/5.0
- Condition / age +2.5/5.0
- Appreciation +0.0/10.0
$120,000
🖨 Deal sheet (PDF) 📄 Offer letter ✓ Due diligence
Listing remarks MLS
Historic 2 story home for sale in St Marys, KS. This home is ready to be restored by a new owner, so roll up your sleeves! The home features a classic covered porch, tall ceilings, large living spaces. The home is centrally located near downtown and is adjacent to a city park! The home sits on an R-2 lot, so it can be renovated as a single family home or duplex.
Key facts
- Covered porch
- R-2 lot
- Tall ceilings
Tags
Property features AI
Finance
- Other: Lot size approximately 0.17 acre
- Financial info: Annual tax: $625
Exterior
- Home design: Single family residence; One and one-half story
- Construction: Masonite exterior
- Exterior features: No fencing; No pool
Interior
- Bedrooms: 1 bedroom on the main level
- Bathrooms: 1 full bathroom
- Heating & cooling: Natural gas heating
- Interior features: Crawl space basement
Neighborhood map
What this means for you Summary
Snapshot
- This is a 2-bed/1.0-bath single-family listed at $120k.
Deal economics
- At list price, monthly cash flow is $270 ($3k/yr) — positive.
- The deal already cash-flows at list — no discount required.
- Meets the 1% rule at list price ($1k rent vs $120k).
- Recommended offer: $113k (6.0% below list) — sets the bar for market timing.
Location & tenants
- Location reads: area grade C — affects rentability + tenant quality, not the cash-flow math above.
- Kaw Valley (rural): math 26% / reading 38% proficiency, ranked #78 of 169 in KS (top 46%) — families likely to look elsewhere, expect single-tenant / working-renter base with shorter leases.
- Zoned schools: St Marys Elem (math 37% / reading 47%, grade F, #273 of 684 statewide, top 45%, 259 students, 47% FRL); St. Marys Junior Senior High (math 27% / reading 37%, grade F, #50 of 327 statewide, top 16%, 248 students, 46% FRL) — zoned schools average 46% FRL vs 29% district-wide (18 pts higher); higher-poverty schools than district average — tighter screening recommended.
- Market conditions: 20 active listings in the ZIP; 1 comparable units currently listed for rent nearby; 114 units permitted in Pottawatomie County in 2024 (0 in 5+ unit buildings).
Forward outlook
- Local home prices are declining (-3.0%/yr); year-one equity from $830 of loan paydown is wiped out by about $4k of value loss. Plan a longer hold.
- Pottawatomie County population projected at +25% by 2050 — long-run rental-demand tailwind backs the buy-and-hold thesis.
Negotiation context
- It's been on market 74 days — a 6% lower offer ($113k) is reasonable based on typical stale-listing flexibility.
- 2 sale attempts; this cycle's ask has dropped $20k (14%) from the opening price — seller is motivated, your offer sets the floor, not the list.
- Current owner paid $31k; list at $120k implies a 287% gain — meaningful room to come down on a strong offer.
Risks & watch-outs
- Watch-outs: built in 1883 — expect roof / HVAC / electrical / plumbing capex.
- Climate carrying-cost: moderate wildfire risk — expect insurance premiums to compound above CPI over the hold.
Questions for the listing agent
- It's been on market 74 days. Have you received any prior offers? Is the seller open to a 6% concession, seller financing, or rate buy-down credit?
- Built in 1883 — when were the roof, HVAC, electrical panel, plumbing, and water heater last replaced?
- Why hasn't it sold? Are there any deal-killer items the seller is aware of (foundation, flood, title, zoning, code violations)?
- Is there a deadline driving the sale (1031 exchange, divorce, estate, relocation)? That informs how much negotiation room exists.
- What's the average days-on-market for RENTAL listings here right now (not sales)? A rising rental-DOM trend means longer vacancies and softer asking-rent achievability than the comps imply.
- What's the recent tenant-quality profile in this submarket — average credit score on applications, eviction rate, late-payment / NSF rate, and stable-employment percentage? A property-management company in the area should have these aggregated.
- How much new for-sale + rental construction is in the pipeline within 1–3 miles? Heavy new supply typically softens prices + rents 12–24 months out; constrained supply supports both.
Investment metrics
- 1% rule
- 1.04% ✓
- Cap rate
- 8.99%
- Cash-on-cash
- 9.63%
- DSCR
- 1.43
- GRM
- 8.0
CMA / ARV
No comps found within radius.
Projected returns pro-forma
-3.0% appreciation · 3.0% rent growth · sell at horizon
- IRR
- -1.8%
- Equity multiple
- 0.93×
- Total profit
- $-2,313
- Equity at exit
- $17,892
- IRR
- 7.8%
- Equity multiple
- 1.59×
- Total profit
- $19,909
- Equity at exit
- $10,375
Cash invested: $33,600 (down + closing). Projections, not guarantees.
Landlord ↔ Tenant lean methodology
- Overall (STATE)
- 83 Strongly Landlord-Friendly
- State Kansas
- 83 Strongly Landlord-Friendly · R+10
- County
- — inherits STATE
- City
- — inherits STATE
ZIP-level market 66536
- Home prices YoY
- -22.2%
- Active inventory
- 20
- Price-to-rent
- 8.0×
Monthly cashflow live
- Estimated rent
- $1,250 medium interval (Pro) →
- Mortgage (P&I)
- −$629
- Tax from tax record
- −$38 /mo · $461/yr
- Insurance
- −$50
- HOA
- −$0
- Vacancy / Maint / Mgmt
- −$262
- Net cashflow
- $270
Break-even live
Sensitivity live
| Price | -10% $338 | -5% $304 | +0% $270 | +5% $236 | +10% $202 |
|---|---|---|---|---|---|
| Rent | -10% $171 | -5% $220 | +0% $270 | +5% $319 | +10% $369 |
| Rate | -1.0pp $330 | -0.5pp $300 | base $270 | +0.5pp $239 | +1.0pp $207 |
UW: 25.0% down · 7.5% · 30yr · 1.5% tax · 5.0% vac · 8.0% maint · 8.0% mgmt
Financing live
Cash to close
- Down payment
- $30,000
- Closing costs
- $3,600
- Reserves months
- —
- Total cash needed
- —
Loan-product check · same deal, 3 products live
Conventional
25% down · 7.5% · 30yr
- Down + closing
- —
- Monthly P&I
- —
- Monthly cashflow
- —
- DSCR
- —
- Eligible?
- —
Personal DTI + credit; lowest rate.
DSCR
20% down · 8.5% · 30yr
- Down + closing
- —
- Monthly P&I
- —
- Monthly cashflow
- —
- DSCR
- —
- Eligible?
- —
No personal income docs; deal must DSCR.
Hard money
10% down · 12.0% · 12mo
- Down + closing
- —
- Monthly P&I
- —
- Monthly cashflow
- —
- DSCR
- —
- Eligible?
- —
Short-term bridge; refi at stabilization.
Rent comps 1 comps
| Address | Beds | Baths | Sqft | Rent | $/sqft | DOM | Units | Dist |
|---|---|---|---|---|---|---|---|---|
| 609 W Mission St Unit 609-4 St Marys, KS | 2.0 | 2.0 | 925 | $1,250 | $1.35 | 22d | 1 | 0.06mi |
Listing history 20 events
-
2026-06-21days on market $120,000 Active 74 DOM
-
2026-06-19days on market $120,000 Active 72 DOM
-
2026-06-18days on market $120,000 Active 71 DOM
-
2026-06-17days on market $120,000 Active 70 DOM
-
2026-06-16days on market $120,000 Active 69 DOM
-
2026-06-15days on market $120,000 Active 68 DOM
-
2026-06-14days on market $120,000 Active 66 DOM
-
2026-06-13pricedays on market $120,000 Active 65 DOM
-
2026-06-10days on market $140,000 Active 63 DOM
-
2026-06-09days on market $140,000 Active 62 DOM
-
2026-06-08days on market $140,000 Active 61 DOM
-
2026-06-07days on market $140,000 Active 60 DOM
-
2026-06-05days on market $140,000 Active 57 DOM
-
2026-06-02days on market $140,000 Active 55 DOM
-
2026-06-01days on market $140,000 Active 54 DOM
-
2026-05-31days on market $140,000 Active 53 DOM
-
2026-05-30days on market $140,000 Active 52 DOM
-
2026-04-14$140,000 Active 364-char remark
Show marketing remark (364 chars)
Historic 2 story home for sale in St Marys, KS. This home is ready to be restored by a new owner, so roll up your sleeves! The home features a classic covered porch, tall ceilings, large living spaces. The home is centrally located near downtown and is adjacent to a city park! The home sits on an R-2 lot, so it can be renovated as a single family home or duplex.
-
2026-04-08$140,000 Active
-
1991-07-01soldstatus $31,000
ⓘ Source: listings_history table (triggers on properties + properties_extension) + one-shot
backfill from property_details.listing_events for pre-trigger history.
Tax reassessment forecast KS · Resets to sale price
- Current annual tax
- $461 · $38/mo
- Projected year-2 tax
- $1,692 · $141/mo
- Expected delta
- +$1,231/yr (+$103/mo · 266.9%)
ⓘ Screening estimate from a state-policy table — verify with the county assessor before closing.
Climate risk First Street
- Flood 1/10 Low FEMA zone X (unshaded) · 0% chance over 30 yrs
- Wildfire 5/10 Major
- Heat 4/10 Moderate 7 d/yr ≥109°F today · 17 d/yr by 30 yrs out
- Wind 2/10 Low
- Air quality 3/10 Moderate 2 unhealthy d/yr today · 3 by 30 yrs out
Nearby sold comps map
Loading sold comps map…
Walkable amenities ~0.75 mi
Loading nearby amenities…
Taxation est. · year 1
- Rental income
- $15,000
- − Mortgage interest
- −$6,722
- − Property taxes
- −$461
- − Insurance
- −$600
- − Repairs & maintenance
- −$1,200
- − Management
- −$1,200
- − Depreciation
- −$3,491
- Taxable income
- $1,326
- Est. tax owed @ 24.0%
- −$318
- After-tax cash flow
- $2,919/yr
For passive investors: Depreciation is non-cash, so a rental often shows a tax loss while cash-flowing — sheltering income. Rental losses are passive: they offset passive income freely, and up to $25,000/yr can offset ordinary (W-2) income if you actively participate and your MAGI is under $100k (phasing out to $0 by $150k); unused losses carry forward. On sale, claimed depreciation is recaptured at up to 25%, and gains may owe capital-gains tax (a 1031 exchange can defer both). Figures are a year-1 estimate at your 24.0% rate — not tax advice; consult a CPA.
Schools (NCES district)
- District
- Kaw Valley
- NCES district ID
- 2007970
- Math proficiency
- 26% ▼ -4.00%
- Reading proficiency
- 38% ▲ 6.00%
- Median HH income
- $55,445
- Composite
- 28.34/100
- National rank
- #6778
- State rank
- #78 of 169 in KS
Livability — St. Marys
No livability data for this city. (Only ~50 U.S. cities are tracked.)
Census & demographics
- Census place
- St. Marys, KS
- Population (ZIP)
- 4,103
Population outlook (Pottawatomie County) Hauer SSP2
- Today (2025)
- 25,971 people
- By 2030
- 27,362 · +5.4%
- By 2040
- 30,086 · +15.8%
- By 2050
- 32,560 · +25.4%
- By 2075
- 38,284 · +47.4%
- By 2100
- 40,235 · +54.9%
Race, ethnicity, and origin ACS 2023
- Neighborhood character
- Predominantly White (82%)
- Race & ethnicity
- White 82% Hispanic / Latino 9% Two or more races 7%
- Hispanic origin (detail)
- Mexican 6% Cuban 1%
- Common ancestry
- Romanian 8% Lithuanian 5% Iranian 3%
- Foreign-born
- 2% · Canada
- Languages at home
- 97% English-only · Spanish 2% French/Haitian/Cajun 1%
Political lean MEDSL · Pottawatomie
- 2024 margin
- Solid R (+47.6) · D 25.2% · R 72.8% · Other 2.0%
- 2008→2024 swing
- -3.6pp toward R · 2008: -44.0pp · 2024: -47.6pp
- All cycles
- 2024: R+47.6 2020: R+46.7 2016: R+50.8 2012: R+47.3 2008: R+44.0
Not yet ingested
- Civics
- —
Market trends
- HPI YoY
- ▼ -59.64%
- Current HPI
- 208.8163
- Rent YoY
- —
- Metro
- —
- State GDP YoY
- —
- F500 in state
- 0
Price history
+351.6% since first listed3 events — show timeline
- 2026-04-14 Listed $140,000 Sunflower MLS as distributed by MLS GRID
- 2026-04-08 Listed $140,000 FHAOR as distributed by MLS GRID
- 1991-07-01 Sold (Public Records) $31,000 Public Records
Property tax history
+2.7%/yrLatest (2024): $461 · -5.7% YoY. Source: county tax records.
Cash-flow waterfall
monthlySold comps — $/sqft
last 12 mo · ≤1 miLoading sold comps…