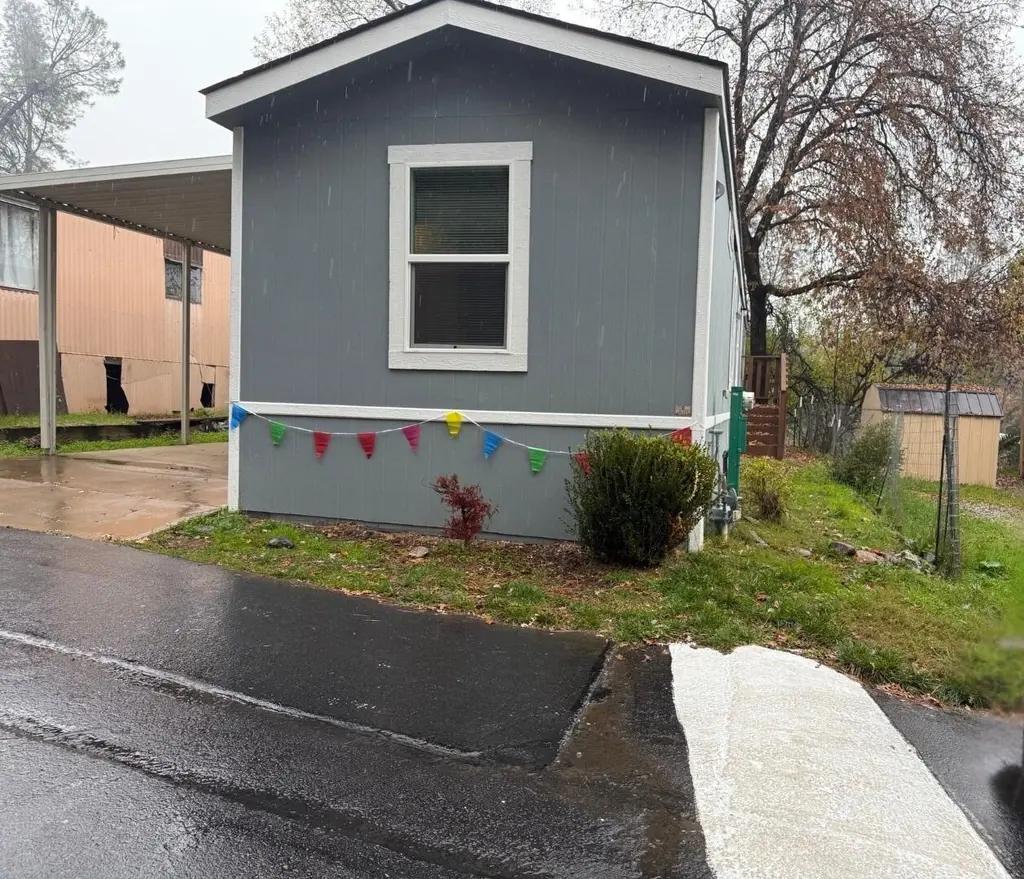
14578 Bass Dr #28 · Mountain Gate, CA
Flood risk 1/10 · Minimal
- FEMA flood zone
- X (unshaded)
- Chance of flooding over 30 yrs
- 0.0%
- Est. flood insurance / yr
- $507 – $1,088
Fire risk 8/10 · Major
- Est. fire insurance / yr
- $659 – $1,223
Heat risk 8/10 · Major
- Hot days now (above 105°F)
- 7 days/yr
- Hot days in 30 yrs
- 17 days/yr
Wind risk 1/10 · Minimal
- Chance of severe wind over 30 yrs
- —
Air-quality risk 10/10 · Severe
- Unhealthy air days now
- 45 days/yr
- Unhealthy air days in 30 yrs
- 48 days/yr
Risk factors via First Street. Map © Google.
Why this score? — see what drove the B- grade
The composite is a weighted blend of 9 inputs, each scored 0–100. Each bar is that input's sub-score; the figure is the points it added to the 100-point composite (weight × sub-score).
- Cash flow +30.0/30.0
- 1% rule +10.0/10.0
- DSCR +10.0/10.0
- ARV discount +4.8/15.0
- Rent growth +3.0/5.0
- Schools +2.5/10.0
- Condition / age +2.5/5.0
- Livability +2.4/5.0
- Appreciation +0.0/10.0
$69,990
🖨 Deal sheet 📄 Offer letter ✓ Due diligence
Listing remarks MLS
State-of-the-Art Mfg Home in Redding Lakeside Mobile Estates. Lender-owned after owner who purchased it brand new only occupied it for less than 6 months and couldn't pay. Home is in excellent condition and new home warranty is still in effect. Community features 80% new homes sold for significantly higher prices. Buyer may assume prior owner's loan. Buyers with credit issues can still qualify for financing with proof of income and no evictions. For more info on the community http://cascadecorporatemanagement.com/communities/details/redding_lakeside_mobile_estates/
Key facts
- Parking
- Built 2007
- Listed 146 days
Neighborhood map
What this means for you Summary
Snapshot
- This is a 2-bed/1.0-bath manufactured listed at $70k.
Deal economics
- At list price, monthly cash flow is $770 ($9k/yr) — positive.
- The deal already cash-flows at list — no discount required.
- Meets the 1% rule at list price ($1k rent vs $70k).
- Recommended offer: $62k (12.0% below list) — sets the bar for market timing.
Location & tenants
- Location reads 47/100 on livability (#1,255 in CA) — a working-class tenant base; expect higher turnover. Watch: cost of living D+, schools F, crime F.
- Gateway Unified (suburban): math 25% / reading 35% proficiency, ranked #355 of 517 in CA (top 69%) — families likely to look elsewhere, expect single-tenant / working-renter base with shorter leases.
- Market conditions: Rents rising (+1.9%/yr); 286 active listings in the ZIP; 246 units permitted in Shasta County in 2024 (0 in 5+ unit buildings).
Forward outlook
- Local home prices are declining (-3.0%/yr); year-one equity from $484 of loan paydown is wiped out by about $2k of value loss. Plan a longer hold.
- Shasta County population projected to shrink 9% by 2050 — rents likely to lag national; underwrite the cash flow, not the appreciation.
- At projected returns (-3.0% appreciation + 1.9% rent growth), your $20k cash investment doubles in ~3 years — after that, you're playing with house money.
Negotiation context
- It's been on market 147 days — a 12% lower offer ($62k) is reasonable based on typical stale-listing flexibility.
- Current owner paid $29k; list at $70k implies a 140% gain — meaningful room to come down on a strong offer.
Risks & watch-outs
- Climate carrying-cost: severe wildfire risk; extreme-heat days projected 7→17/yr by 2055 (HVAC capex compounding) — expect insurance premiums to compound above CPI over the hold.
Questions for the listing agent
- It's been on market 147 days. Have you received any prior offers? Is the seller open to a 12% concession, seller financing, or rate buy-down credit?
- Why hasn't it sold? Are there any deal-killer items the seller is aware of (foundation, flood, title, zoning, code violations)?
- Is there a deadline driving the sale (1031 exchange, divorce, estate, relocation)? That informs how much negotiation room exists.
- Schools are F-rated, which usually means shorter tenancies and higher turnover. Who's the typical renter profile here, and what's been the actual vacancy rate?
- Crime grade is F in this area — have there been break-ins, vandalism, or insurance claims at this property in the last 3 years? What carrier currently insures it and at what premium?
- What's the average days-on-market for RENTAL listings here right now (not sales)? A rising rental-DOM trend means longer vacancies and softer asking-rent achievability than the comps imply.
- What's the recent tenant-quality profile in this submarket — average credit score on applications, eviction rate, late-payment / NSF rate, and stable-employment percentage? A property-management company in the area should have these aggregated.
- How much new for-sale + rental construction is in the pipeline within 1–3 miles? Heavy new supply typically softens prices + rents 12–24 months out; constrained supply supports both.
Investment metrics
- 1% rule
- 2.13% ✓
- Cap rate
- 19.50%
- Cash-on-cash
- 47.15%
- DSCR
- 3.10
- GRM
- 3.9
CMA / ARV
- ARV (median comp)
- $66,000
- List price
- $69,990
- Delta
- 6.05%
- Verdict
- FAIR
- Comps
- 2 within 1.0 mi
Show comp detail 3 sales within ~0.75 mi
| Address | Dist | Beds/Ba | Sqft | Sold | Price | $/sf | Match |
|---|---|---|---|---|---|---|---|
| 14578 Bass Dr Spc 22 | 0.00mi | 2/1.0 | 744 (-8%) | 2mo | $25,000 | $34 | 84 |
| 19555 Tunnel Rd Spc 6 | 0.36mi | 2/2.0 | 806 (-1%) | 3mo | $107,000 | $133 | 76 |
| 14740 Bass Dr #32 | 0.38mi | 3/2.0 (+1) | 840 (+3%) | 16mo | $80,000 | $95 | 54 |
Match score weights: distance 35% · size 25% · config 20% · recency 20%. Top-matched comps best support the ARV.
Projected returns pro-forma
-3.0% appreciation · 1.88% rent growth · sell at horizon
- IRR
- 43.3%
- Equity multiple
- 2.84×
- Total profit
- $36,017
- Equity at exit
- $10,436
- IRR
- 48.8%
- Equity multiple
- 5.48×
- Total profit
- $87,748
- Equity at exit
- $6,051
Cash invested: $19,597 (down + closing). Projections, not guarantees.
Landlord ↔ Tenant lean methodology
- Overall (STATE)
- 18 Strongly Tenant-Friendly
- State California
- 18 Strongly Tenant-Friendly · D+13
- County
- — inherits STATE
- City
- — inherits STATE
ZIP-level market 96002
- Rents YoY
- 1.9%
- Active inventory
- 286
- Price-to-rent
- 3.9×
Monthly cashflow live
- Estimated rent
- $1,492 medium interval (Pro) →
- Mortgage (P&I)
- −$367
- Tax from tax record
- −$13 /mo · $150/yr
- Insurance
- −$29
- HOA
- −$0
- Vacancy / Maint / Mgmt
- −$313
- Net cashflow
- $770
Break-even live
UW: 25.0% down · 7.5% · 30yr · 1.5% tax · 5.0% vac · 8.0% maint · 8.0% mgmt
Financing live
Cash to close
- Down payment
- $17,498
- Closing costs
- $2,100
- Reserves months
- —
- Total cash needed
- —
Loan-product check · same deal, 3 products live
Conventional
25% down · 7.5% · 30yr
- Down + closing
- —
- Monthly P&I
- —
- Monthly cashflow
- —
- DSCR
- —
- Eligible?
- —
Personal DTI + credit; lowest rate.
DSCR
20% down · 8.5% · 30yr
- Down + closing
- —
- Monthly P&I
- —
- Monthly cashflow
- —
- DSCR
- —
- Eligible?
- —
No personal income docs; deal must DSCR.
Hard money
10% down · 12.0% · 12mo
- Down + closing
- —
- Monthly P&I
- —
- Monthly cashflow
- —
- DSCR
- —
- Eligible?
- —
Short-term bridge; refi at stabilization.
Listing history 18 events
-
2026-06-19days on market $69,990 Active 147 DOM
-
2026-06-18days on market $69,990 Active 146 DOM
-
2026-06-17days on market $69,990 Active 145 DOM
-
2026-06-16days on market $69,990 Active 144 DOM
-
2026-06-15days on market $69,990 Active 143 DOM
-
2026-06-14days on market $69,990 Active 141 DOM
-
2026-06-13days on market $69,990 Active 140 DOM
-
2026-06-10days on market $69,990 Active 138 DOM
-
2026-06-09days on market $69,990 Active 137 DOM
-
2026-06-08days on market $69,990 Active 136 DOM
-
2026-06-07days on market $69,990 Active 135 DOM
-
2026-06-03days on market $69,990 Active 131 DOM
-
2026-06-02days on market $69,990 Active 130 DOM
-
2026-06-01days on market $69,990 Active 129 DOM
-
2026-05-31days on market $69,990 Active 128 DOM
-
2026-05-30days on market $69,990 Active 127 DOM
-
2015-10-01$29,500
-
2010-11-16soldstatus $29,120 571-char remark
Show marketing remark (571 chars)
State-of-the-Art Mfg Home in Redding Lakeside Mobile Estates. Lender-owned after owner who purchased it brand new only occupied it for less than 6 months and couldn't pay. Home is in excellent condition and new home warranty is still in effect. Community features 80% new homes sold for significantly higher prices. Buyer may assume prior owner's loan. Buyers with credit issues can still qualify for financing with proof of income and no evictions. For more info on the community http://cascadecorporatemanagement.com/communities/details/redding_lakeside_mobile_estates/
ⓘ Source: listings_history table (triggers on properties + properties_extension) + one-shot
backfill from property_details.listing_events for pre-trigger history.
Tax reassessment forecast CA · Resets to sale price
- Current annual tax
- $150 · $13/mo
- Projected year-2 tax
- $532 · $44/mo
- Expected delta
- +$382/yr (+$32/mo · 254.0%)
ⓘ Screening estimate from a state-policy table — verify with the county assessor before closing.
Climate risk First Street
- Flood 1/10 Low FEMA zone X (unshaded) · 0% chance over 30 yrs
- Wildfire 8/10 Severe
- Heat 8/10 Severe 7 d/yr ≥105°F today · 17 d/yr by 30 yrs out
- Wind 1/10 Low
- Air quality 10/10 Extreme 45 unhealthy d/yr today · 48 by 30 yrs out
Nearby sold comps map
Loading sold comps map…
Walkable amenities ~0.75 mi
Loading nearby amenities…
Taxation est. · year 1
- Rental income
- $17,905
- − Mortgage interest
- −$3,921
- − Property taxes
- −$150
- − Insurance
- −$350
- − Repairs & maintenance
- −$1,432
- − Management
- −$1,432
- − Depreciation
- −$2,036
- Taxable income
- $8,584
- Est. tax owed @ 24.0%
- −$2,060
- After-tax cash flow
- $7,181/yr
For passive investors: Depreciation is non-cash, so a rental often shows a tax loss while cash-flowing — sheltering income. Rental losses are passive: they offset passive income freely, and up to $25,000/yr can offset ordinary (W-2) income if you actively participate and your MAGI is under $100k (phasing out to $0 by $150k); unused losses carry forward. On sale, claimed depreciation is recaptured at up to 25%, and gains may owe capital-gains tax (a 1031 exchange can defer both). Figures are a year-1 estimate at your 24.0% rate — not tax advice; consult a CPA.
Schools (NCES district)
- District
- Gateway Unified
- NCES district ID
- 0614950
- Math proficiency
- 25% ▼ -5.00%
- Reading proficiency
- 35% ▲ 2.00%
- Median HH income
- $41,888
- Composite
- 25.39/100
- National rank
- #7465
- State rank
- #355 of 517 in CA
Livability — Mountain Gate
- Score
- 47/100
- State rank
- #1255
- US rank
- #26371
Category grades
Schools grade is shown separately in the Schools card above.
Census & demographics
- Census place
- Mountain Gate, CA
- County
- Shasta County · 147,641 people
- Metro
- Redding, CA
- Population (ZIP)
- 33,783
- Household income
- $73,222
- Rent vs Own
- Severe rent burden
- 1026.0
Population outlook (Shasta County) Hauer SSP2
- Today (2025)
- 179,231 people
- By 2030
- 176,953 · -1.3%
- By 2040
- 169,982 · -5.2%
- By 2050
- 162,547 · -9.3%
- By 2075
- 145,649 · -18.7%
- By 2100
- 123,025 · -31.4%
Race, ethnicity, and origin ACS 2023
- Neighborhood character
- Predominantly White (72%)
- Race & ethnicity
- White 72% Hispanic / Latino 13% Two or more races 12% Asian 6% Native American 2% Black 1%
- Hispanic origin (detail)
- Mexican 10%
- Common ancestry
- Italian 4% Lithuanian 2% Slovak 2%
- Foreign-born
- 5% · Canada
- Languages at home
- 91% English-only · Spanish 4% Other Asian/Pacific 2% Other Indo-European 1%
Political lean MEDSL · Shasta
- 2024 margin
- Solid R (+36.5) · D 30.5% · R 67.0% · Other 2.5%
- 2008→2024 swing
- -10.7pp toward R · 2008: -25.8pp · 2024: -36.5pp
- All cycles
- 2024: R+36.5 2020: R+33.1 2016: R+37.4 2012: R+30.3 2008: R+25.8
Not yet ingested
- Civics
- —
Market trends
- HPI YoY
- ▼ -248.70%
- Current HPI
- 319.713
- Rent YoY
- ▲ 1.88%
- Metro
- Redding, CA
- State GDP YoY
- ▲ 3.21%
- F500 in state
- 116
Industry mix (Fortune 500 HQ in CA)
| Industry | F500 HQs | Revenue |
|---|---|---|
| Technology | 27 | $1,492B |
|
||
| Financial Services | 3 | $174B |
|
||
| Retail | 3 | $44B |
|
||
| Insurance | 3 | $26B |
|
||
| Media / Entertainment | 2 | $115B |
|
||
| Pharmaceuticals / Biotech | 2 | $62B |
|
||
Price history
+1.3% since first listed2 events — show timeline
- 2015-10-01 Listed $29,500 SAOR
- 2010-11-16 Sold (MLS) $29,120 CRMLS
Property tax history
-5.4%/yrLatest (2020): $150 · +1.2% YoY. Source: county tax records.
Cash-flow waterfall
monthlySold comps — $/sqft
last 12 mo · ≤1 miLoading sold comps…