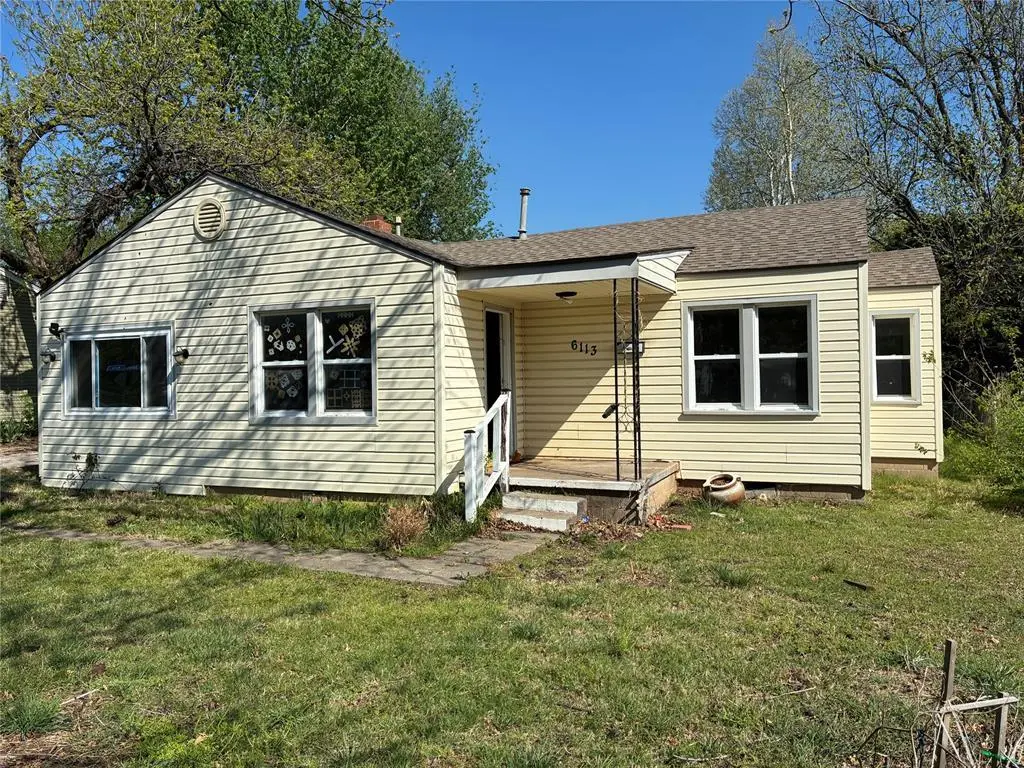
6113 NW 48th St · Warr Acres, OK
Flood risk 1/10 · Minimal
- FEMA flood zone
- X (unshaded)
- Chance of flooding over 30 yrs
- 0.0%
- Est. flood insurance / yr
- $507 – $1,088
Fire risk 3/10 · Minor
- Est. fire insurance / yr
- $2,463 – $4,575
Heat risk 5/10 · Moderate
- Hot days now (above 107°F)
- 7 days/yr
- Hot days in 30 yrs
- 19 days/yr
Wind risk 2/10 · Minimal
- Chance of severe wind over 30 yrs
- 2.0%
Air-quality risk 2/10 · Minimal
- Unhealthy air days now
- 1 days/yr
- Unhealthy air days in 30 yrs
- 2 days/yr
Risk factors via First Street. Map © Google.
Why this score? — see what drove the C+ grade
The composite is a weighted blend of 9 inputs, each scored 0–100. Each bar is that input's sub-score; the figure is the points it added to the 100-point composite (weight × sub-score).
- Cash flow +22.6/30.0
- ARV discount +15.0/15.0
- DSCR +7.3/10.0
- 1% rule +5.6/10.0
- Livability +3.5/5.0
- Rent growth +2.7/5.0
- Condition / age +2.5/5.0
- Schools +1.3/10.0
- Appreciation +0.0/10.0
$129,000
🖨 Deal sheet (PDF) 📄 Offer letter ✓ Due diligence
Listing remarks
Back on market. Huge price decrease. Inspection report available. Needs some work but a tremendous opportunity at this price. This 1,319 sq ft home is the perfect canvas for your next investment or renovation project. Priced below the county tax assessor’s market value, this property is being sold as-is and offers incredible potential for the right buyer. Situated on a large lot, almost 1/4 acre, with backyard access, there’s ample space for expansion, additional structures, or outdoor living upgrades. Key improvements have already been started, including a new roof installed in April. Upgraded 200-amp electrical panel, giving you a solid head start on your remodel. HVAC just in
Key facts
- Backyard access
- Large lot
- New roof
Tags
Property features AI
Finance
- Other: Lot size approximately 0.2324 acres; Living area listed as 1,319 (source: Assessor); No home warranty; Occupied: No; Conditions affecting sale: None; Previous status: Pending (Back On Market); Days on market: 13
- Financial info: Property is not assumable
- HOA & community: No mandatory association dues
Exterior
- Utilities: No storm shelter
- Home design: Single family residence; One level property; Residential property
- Construction: Frame construction; Shingle roof (roof year 2026); Conventional foundation; Existing property
- Exterior features: Open deck; Interior lot
Interior
- Bedrooms: 3 bedrooms
- Bathrooms: 1 full bathroom
- Heating & cooling: Electric heating
- Interior features: One living area; One dining area; No fireplace; No in-law plan
Neighborhood map
What this means for you Summary
Snapshot
- This is a 3-bed/1.0-bath single-family listed at $129k.
Deal economics
- At list price, monthly cash flow is $221 ($3k/yr) — positive.
- The deal already cash-flows at list — no discount required.
- Meets the 1% rule at list price ($1k rent vs $129k).
- Recommended offer: $127k (1.5% below list) — sets the bar for market timing.
- Cap rate 8.3% vs local median 5.0% in Warr Acres — top-decile yield for the area; either an underpriced asset or a hidden risk that comps aren't pricing in. Stress-test before assuming the spread holds.
Location & tenants
- Location reads 70/100 on livability (#35 in OK) — a middle-class / working-renter tenant base. Strengths: cost of living A+, housing A+, health & safety A-; Watch: employment C-, crime F, amenities F.
- Putnam City (urban): math 12% / reading 16% proficiency, ranked #227 of 270 in OK (top 84%) — low school quality limits family demand, transient renter base, plan for 1-2y turnover; 65% free/reduced lunch — lower-income household profile, screen leases tightly.
- Zoned schools: Central Es (math 9% / reading 12%, grade F, #692 of 845 statewide, top 82%, 601 students, 0% FRL); James L. Capps Ms (math 9% / reading 18%, grade F, #252 of 345 statewide, top 74%, 975 students, 0% FRL); Putnam City West Hs (math 10% / reading 20%, grade F, #323 of 447 statewide, top 74%, 1,803 students, 0% FRL) — zoned schools average 0% FRL vs 65% district-wide (65 pts lower); this property's tenant base skews higher-income than the district average.
- Market conditions: Rents flat; 48 active listings in the ZIP; 40 comparable units currently listed for rent nearby; rentals at typical pace (median 17d on market — plan ~3-4 weeks tenant-placement turnaround); 5,365 units permitted in Oklahoma County in 2024 (569 in 5+ unit buildings).
- This rent runs 32% of the median local income ($51k/yr) — at the standard rent-burdened threshold; future hikes will face affordability resistance.
Forward outlook
- Local home prices are declining (-3.0%/yr); year-one equity from $892 of loan paydown is wiped out by about $4k of value loss. Plan a longer hold.
- Oklahoma County population projected at +41% by 2050 — long-run rental-demand tailwind backs the buy-and-hold thesis.
Negotiation context
- It's been on market 18 days — a 2% lower offer ($127k) is reasonable based on typical stale-listing flexibility.
- 4 sale attempts since 14y ago; this cycle's ask has dropped $10k (7%) from the opening price — seller is motivated, your offer sets the floor, not the list.
Risks & watch-outs
- Watch-outs: built in 1946 — expect roof / HVAC / electrical / plumbing capex.
- Climate carrying-cost: extreme-heat days projected 7→19/yr by 2055 (HVAC capex compounding) — expect insurance premiums to compound above CPI over the hold.
Questions for the listing agent
- Built in 1946 — when were the roof, HVAC, electrical panel, plumbing, and water heater last replaced?
- Is there a deadline driving the sale (1031 exchange, divorce, estate, relocation)? That informs how much negotiation room exists.
- Schools are F-rated, which usually means shorter tenancies and higher turnover. Who's the typical renter profile here, and what's been the actual vacancy rate?
- Crime grade is F in this area — have there been break-ins, vandalism, or insurance claims at this property in the last 3 years? What carrier currently insures it and at what premium?
- What's the average days-on-market for RENTAL listings here right now (not sales)? A rising rental-DOM trend means longer vacancies and softer asking-rent achievability than the comps imply.
- What's the recent tenant-quality profile in this submarket — average credit score on applications, eviction rate, late-payment / NSF rate, and stable-employment percentage? A property-management company in the area should have these aggregated.
- How much new for-sale + rental construction is in the pipeline within 1–3 miles? Heavy new supply typically softens prices + rents 12–24 months out; constrained supply supports both.
Investment metrics
- 1% rule
- 1.06% ✓
- Cap rate
- 8.35%
- Cash-on-cash
- 7.33%
- DSCR
- 1.33
- GRM
- 7.9
CMA / ARV
- ARV (on-the-fly)
- $196,531
- Comps found
- 12
Show comp detail 12 sales within ~0.75 mi
| Address | Dist | Beds/Ba | Sqft | Sold | Price | $/sf | Match |
|---|---|---|---|---|---|---|---|
| 4602 N Redmond Ave | 0.20mi | 3/2.0 | 1,288 (-2%) | 2mo | $192,000 | $149 | 81 |
| 4811 N Asbury Ave | 0.28mi | 3/2.0 | 1,257 (-5%) | 1mo | $145,000 | $115 | 75 |
| 6810 NW 50th St | 0.40mi | 3/2.0 | 1,288 (-2%) | 8mo | $193,900 | $151 | 66 |
| 5800 NW 45th St | 0.56mi | 3/2.0 | 1,308 (-1%) | 5mo | $137,500 | $105 | 65 |
| 6013 NW 55th St | 0.45mi | 4/1.0 (+1) | 1,287 (-2%) | 7mo | $178,000 | $138 | 64 |
| 4507 N Donald Ave | 0.23mi | 2/2.0 (-1) | 1,218 (-8%) | 8mo | $215,000 | $177 | 62 |
| 6811 NW 43rd St | 0.50mi | 3/2.0 | 1,385 (+5%) | 7mo | $240,500 | $174 | 59 |
| 6906 NW 43rd St | 0.58mi | 3/2.0 | 1,400 (+6%) | 5mo | $240,000 | $171 | 54 |
| 4711 N Grove Ave | 0.65mi | 3/2.0 | 1,402 (+6%) | 2mo | $197,900 | $141 | 53 |
| 5704 NW 45th St | 0.67mi | 4/2.0 (+1) | 1,379 (+4%) | 0mo | $195,000 | $141 | 52 |
| 6814 NW 45th St | 0.47mi | 3/2.0 | 1,477 (+12%) | 3mo | $245,000 | $166 | 52 |
| 4324 N Grove Ave | 0.73mi | 3/2.0 | 1,260 (-4%) | 6mo | $139,000 | $110 | 50 |
Match score weights: distance 35% · size 25% · config 20% · recency 20%. Top-matched comps best support the ARV.
Projected returns pro-forma
-3.0% appreciation · 0.73% rent growth · sell at horizon
- IRR
- -7.6%
- Equity multiple
- 0.73×
- Total profit
- $-9,896
- Equity at exit
- $19,234
- IRR
- -1.1%
- Equity multiple
- 0.93×
- Total profit
- $-2,461
- Equity at exit
- $11,154
Cash invested: $36,120 (down + closing). Projections, not guarantees.
Landlord ↔ Tenant lean methodology
- Overall (STATE)
- 83 Strongly Landlord-Friendly
- State Oklahoma
- 83 Strongly Landlord-Friendly · R+20
- County
- — inherits STATE
- City
- — inherits STATE
ZIP-level market 73122
- Home prices YoY
- -27.8%
- Rents YoY
- 0.7%
- Active inventory
- 48
- Price-to-rent
- 7.9×
Monthly cashflow live
- Estimated rent
- $1,363 high interval (Pro) →
- Mortgage (P&I)
- −$676
- Tax from tax record
- −$126 /mo · $1,507/yr
- Insurance
- −$54
- HOA
- −$0
- Vacancy / Maint / Mgmt
- −$286
- Net cashflow
- $221
Break-even live
Sensitivity live
| Price | -10% $294 | -5% $257 | +0% $221 | +5% $184 | +10% $148 |
|---|---|---|---|---|---|
| Rent | -10% $113 | -5% $167 | +0% $221 | +5% $274 | +10% $328 |
| Rate | -1.0pp $286 | -0.5pp $253 | base $221 | +0.5pp $187 | +1.0pp $153 |
UW: 25.0% down · 7.5% · 30yr · 1.5% tax · 5.0% vac · 8.0% maint · 8.0% mgmt
Financing live
Cash to close
- Down payment
- $32,250
- Closing costs
- $3,870
- Reserves months
- —
- Total cash needed
- —
Loan-product check · same deal, 3 products live
Conventional
25% down · 7.5% · 30yr
- Down + closing
- —
- Monthly P&I
- —
- Monthly cashflow
- —
- DSCR
- —
- Eligible?
- —
Personal DTI + credit; lowest rate.
DSCR
20% down · 8.5% · 30yr
- Down + closing
- —
- Monthly P&I
- —
- Monthly cashflow
- —
- DSCR
- —
- Eligible?
- —
No personal income docs; deal must DSCR.
Hard money
10% down · 12.0% · 12mo
- Down + closing
- —
- Monthly P&I
- —
- Monthly cashflow
- —
- DSCR
- —
- Eligible?
- —
Short-term bridge; refi at stabilization.
Rent comps 40 comps
| Address | Beds | Baths | Sqft | Rent | $/sqft | DOM | Units | Dist |
|---|---|---|---|---|---|---|---|---|
| 5107 N Hammond Ave Unit 5109D Warr Acres, OK | 3.0 | 2.0 | 1300 | $1,399 | $1.08 | 25d | 1 | 0.19mi |
| 5107 N Hammond Ave Unit 5103B Warr Acres, OK | 2.0 | 1.5 | 1050 | $999 | $0.95 | 25d | 1 | 0.19mi |
| 5212 Oakwood Villas Ct Bethany, OK | 3.0 | 2.0 | 1200 | $1,350 | $1.12 | 4d | 1 | 0.36mi |
| 4206 N Donald Ave Bethany, OK | 3.0 | 1.5 | 1867 | $1,450 | $0.78 | 4d | 1 | 0.47mi |
| 7001 NW 45th St Bethany, OK | 2.0 | 1.0 | 1006 | $1,175 | $1.17 | 4d | 1 | 0.53mi |
| 5111 N Dawson Dr Bethany, OK | 4.0 | 2.0 | 1451 | $1,600 | $1.10 | 25d | 1 | 0.58mi |
| 7118 NW 43rd St Bethany, OK | 3.0 | 2.0 | 914 | $1,250 | $1.37 | 6d | 1 | 0.77mi |
| 5577 NW 50th St Oklahoma City, OK | 1.0–2.0 | 1.0–2.0 | 725 | $1,149 | $1.58 | 5d | 6 | 0.77mi |
| 6808 NW 59th St Bethany, OK | 4.0 | 2.0 | 1420 | $1,500 | $1.06 | 25d | 1 | 0.79mi |
| 3811 N Asbury Ave Unit B Bethany, OK | 2.0 | 1.5 | 1300 | $1,195 | $0.92 | 14d | 1 | 0.81mi |
| 3803 N Redmond Ave Bethany, OK | 3.0 | 2.0 | 1260 | $2,100 | $1.67 | 3d | 1 | 0.82mi |
| 6909 NW 59th St Bethany, OK | 3.0 | 1.0 | 925 | $1,365 | $1.48 | 25d | 1 | 0.85mi |
| 5304 Willow Cliff Rd Oklahoma City, OK | 3.0 | 3.0 | 1505 | $1,330 | $0.88 | 16d | 1 | 0.88mi |
| 5304 Willow Cliff Rd Oklahoma City, OK | 2.0 | 2.0 | 1060 | $1,086 | $1.02 | 6d | 1 | 0.88mi |
| 4401 N Ann Arbor Ave Warr Acres, OK | 3.0 | 1.0 | 1216 | $1,245 | $1.02 | 25d | 1 | 0.95mi |
| 6905 NW 60th St Bethany, OK | 4.0 | 1.5 | 1331 | $1,500 | $1.13 | 4d | 1 | 0.97mi |
| 5929 NW 62nd St Oklahoma City, OK | 3.0 | 1.0 | 1103 | $1,550 | $1.41 | 4d | 1 | 0.98mi |
| 3717 N Street Charles St Warr Acres, OK | 2.0 | 1.5 | 1047 | $1,200 | $1.15 | 25d | 1 | 0.98mi |
| 3707 N Street Charles St Unit 3717 Warr Acres, OK | 2.0 | 1.5 | 1047 | $1,200 | $1.15 | 25d | 1 | 1.00mi |
| 5633 Norman Rd Warr Acres, OK | 3.0 | 2.0 | 1225 | $1,375 | $1.12 | 4d | 1 | 1.03mi |
| 5901 NW 34th St Oklahoma City, OK | 1.0–2.0 | 1.0–2.0 | 925 | $1,049 | $1.13 | 4d | 28 | 1.07mi |
| 7307 NW 38th St Bethany, OK | 3.0 | 2.0 | 1200 | $1,595 | $1.33 | 25d | 1 | 1.07mi |
| 6419 NW 63rd St Unit 1 Warr Acres, OK | 3.0 | 2.5 | 1748 | $1,425 | $0.82 | 5d | 1 | 1.12mi |
| 5811 NW 34th St Oklahoma City, OK | 1.0–2.0 | 1.0 | 875 | $925 | $1.06 | 25d | 1 | 1.13mi |
| 3801 Franks Way Bethany, OK | 2.0 | 2.0 | 1150 | $1,545 | $1.34 | 25d | 1 | 1.18mi |
| 6100-6114 NW 32nd St Unit 224 Bethany, OK | 2.0 | 1.0 | 895 | $825 | $0.92 | 25d | 1 | 1.20mi |
| 6100-6114 NW 32nd St Unit 117 Bethany, OK | 2.0 | 1.5 | 955 | $935 | $0.98 | 16d | 1 | 1.20mi |
| 6103 NW 63rd St Oklahoma City, OK | 3.0 | 2.0 | 1300 | $1,325 | $1.02 | 4d | 1 | 1.20mi |
| 6100-6114 NW 32nd St Unit 124 Bethany, OK | 2.0 | 1.0 | 895 | $790 | $0.88 | 25d | 1 | 1.20mi |
| 6100-6114 NW 32nd St Unit 129 Bethany, OK | 2.0 | 1.0 | 895 | $725 | $0.81 | 25d | 1 | 1.20mi |
| 4608 N Libby Ave Warr Acres, OK | 4.0 | 2.0 | 1290 | $1,595 | $1.24 | 4d | 1 | 1.21mi |
| 4316 N Libby Ave Warr Acres, OK | 4.0 | 1.5 | 1377 | $1,650 | $1.20 | 25d | 1 | 1.24mi |
| 6618 NW 31st St Bethany, OK | 2.0 | 1.0 | 1005 | $1,200 | $1.19 | 4d | 1 | 1.31mi |
| 6803 Woodlake Dr Oklahoma City, OK | 2.0 | 2.0 | 977 | $1,150 | $1.18 | 25d | 1 | 1.35mi |
| 6916 Woodlake Dr Unit 6920 Oklahoma City, OK | 3.0 | 2.0 | 1430 | $1,300 | $0.91 | 19d | 1 | 1.35mi |
| 6605 Lyrewood Ln Oklahoma City, OK | 2.0 | 2.0 | 1224 | $1,100 | $0.90 | 25d | 1 | 1.36mi |
| 4213 N Westridge St Oklahoma City, OK | 3.0 | 2.0 | 1474 | $1,295 | $0.88 | 4d | 1 | 1.36mi |
| 6505 Cherokee Dr Warr Acres, OK | 3.0 | 1.5 | 1455 | $1,390 | $0.96 | 4d | 1 | 1.39mi |
| 6715 Lyrewood Ln Oklahoma City, OK | 3.0 | 2.0 | 1309 | $1,495 | $1.14 | 6d | 1 | 1.40mi |
| 6713 Lyrewood Ln Oklahoma City, OK | 3.0 | 2.0 | 1309 | $1,395 | $1.07 | 6d | 1 | 1.40mi |
Listing history 9 events
-
2026-05-23status Pending
-
2026-05-15status Active
-
2026-05-15price $129,000
-
2026-05-05status Pending
-
2026-04-27status Active
-
2026-04-08status Pending
-
2026-04-02$139,000 Active
-
2014-04-25historical
-
2012-03-06$89,900
ⓘ Source: listings_history table (triggers on properties + properties_extension) + one-shot
backfill from property_details.listing_events for pre-trigger history.
Tax reassessment forecast OK · Resets to sale price
- Current annual tax
- $1,507 · $126/mo
- Projected year-2 tax
- $1,507 · $126/mo
- Expected delta
- $0/yr ($0/mo · 0.0%)
ⓘ Screening estimate from a state-policy table — verify with the county assessor before closing.
Climate risk First Street
- Flood 1/10 Low FEMA zone X (unshaded) · 0% chance over 30 yrs
- Wildfire 3/10 Moderate
- Heat 5/10 Major 7 d/yr ≥107°F today · 19 d/yr by 30 yrs out
- Wind 2/10 Low 2% chance of damaging wind over 30 yrs
- Air quality 2/10 Low 1 unhealthy d/yr today · 2 by 30 yrs out
Nearby sold comps map
Loading sold comps map…
Walkable amenities ~0.75 mi
Loading nearby amenities…
Taxation est. · year 1
- Rental income
- $16,351
- − Mortgage interest
- −$7,226
- − Property taxes
- −$1,507
- − Insurance
- −$645
- − Repairs & maintenance
- −$1,308
- − Management
- −$1,308
- − Depreciation
- −$3,753
- Taxable income
- $604
- Est. tax owed @ 24.0%
- −$145
- After-tax cash flow
- $2,503/yr
For passive investors: Depreciation is non-cash, so a rental often shows a tax loss while cash-flowing — sheltering income. Rental losses are passive: they offset passive income freely, and up to $25,000/yr can offset ordinary (W-2) income if you actively participate and your MAGI is under $100k (phasing out to $0 by $150k); unused losses carry forward. On sale, claimed depreciation is recaptured at up to 25%, and gains may owe capital-gains tax (a 1031 exchange can defer both). Figures are a year-1 estimate at your 24.0% rate — not tax advice; consult a CPA.
Schools (NCES district)
- District
- Putnam City
- NCES district ID
- 4025290
- Math proficiency
- 12% ▼ -18.00%
- Reading proficiency
- 16% ▼ -14.00%
- Median HH income
- $46,657
- Composite
- 12.61/100
- National rank
- #9614
- State rank
- #227 of 270 in OK
Livability — Warr Acres
- Score
- 70/100
- State rank
- #35
- US rank
- #7446
Category grades
Schools grade is shown separately in the Schools card above.
Census & demographics
- Census place
- Warr Acres, OK
- County
- Oklahoma County · 771,644 people
- City population
- 12,635
- Metro
- Oklahoma City, OK
- Population (ZIP)
- 12,635
- Household income
- $51,227
- Rent vs Own
- Severe rent burden
- 826.0
Population outlook (Oklahoma County) Hauer SSP2
- Today (2025)
- 911,875 people
- By 2030
- 982,413 · +7.7%
- By 2040
- 1,130,468 · +24.0%
- By 2050
- 1,288,422 · +41.3%
- By 2075
- 1,711,482 · +87.7%
- By 2100
- 2,088,448 · +129.0%
Race, ethnicity, and origin ACS 2023
- Neighborhood character
- Diverse neighborhood (Simpson 0.69)
- Race & ethnicity
- White 45% Hispanic / Latino 30% Two or more races 21% Black 14% Native American 2% Asian 2%
- Hispanic origin (detail)
- Mexican 21%
- Common ancestry
- Slovak 2% Iranian 1% Italian 1%
- Foreign-born
- 16% · Canada, Vietnam, Philippines
- Languages at home
- 75% English-only · Spanish 23% Other Indo-European 1% Vietnamese 1%
Political lean MEDSL · Oklahoma
- 2024 margin
- Toss-up / Even · D 48.0% · R 49.7% · Other 2.3%
- 2008→2024 swing
- +15.1pp toward D · 2008: -16.8pp · 2024: -1.7pp
- All cycles
- 2024: R+1.7 2020: R+1.1 2016: R+10.5 2012: R+16.7 2008: R+16.8
Not yet ingested
- Civics
- —
Market trends
- HPI YoY
- ▼ -96.26%
- Current HPI
- 249.485
- Rent YoY
- ▲ 0.73%
- Metro
- Oklahoma City, OK
- State GDP YoY
- ▲ 1.55%
- F500 in state
- 6
Industry mix (Fortune 500 HQ in OK)
| Industry | F500 HQs | Revenue |
|---|---|---|
| Energy | 3 | $48B |
|
||
Price history
+43.5% since first listed9 events — show timeline
- 2026-05-23 Pending — MLSOK
- 2026-05-15 Relisted — MLSOK
- 2026-05-15 Price Changed $129,000 MLSOK
- 2026-05-05 Pending — MLSOK
- 2026-04-27 Relisted — MLSOK
- 2026-04-08 Pending — MLSOK
- 2026-04-02 Listed $139,000 MLSOK
- 2014-04-25 Listing Removed — MLSOK
- 2012-03-06 Listed $89,900 MLSOK
Property tax history
+6.1%/yrLatest (2025): $1,507 · +6.4% YoY. Source: county tax records.
Cash-flow waterfall
monthlySold comps — $/sqft
last 12 mo · ≤1 miLoading sold comps…