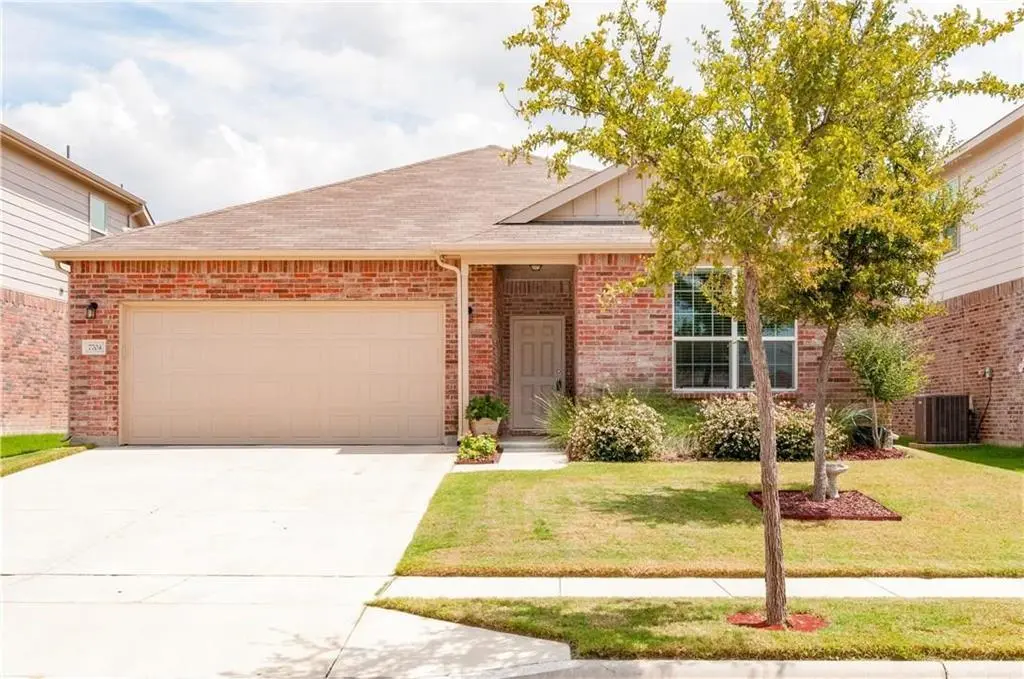
7704 Shorthorn Way · Fort Worth, TX
Flood risk 1/10 · Minimal
- FEMA flood zone
- X (unshaded)
- Chance of flooding over 30 yrs
- 0.0%
- Est. flood insurance / yr
- $507 – $1,088
Fire risk 4/10 · Minor
- Est. fire insurance / yr
- $1,222 – $2,270
Heat risk 8/10 · Major
- Hot days now (above 109°F)
- 7 days/yr
- Hot days in 30 yrs
- 24 days/yr
Wind risk 4/10 · Minor
- Chance of severe wind over 30 yrs
- 24.0%
Air-quality risk 4/10 · Minor
- Unhealthy air days now
- 4 days/yr
- Unhealthy air days in 30 yrs
- 5 days/yr
Risk factors via First Street. Map © Google.
Why this score? — see what drove the D- grade
The composite is a weighted blend of 9 inputs, each scored 0–100. Each bar is that input's sub-score; the figure is the points it added to the 100-point composite (weight × sub-score).
- ARV discount +14.6/15.0
- Cash flow +6.9/30.0
- Schools +4.8/10.0
- Livability +4.0/5.0
- 1% rule +3.4/10.0
- Rent growth +2.5/5.0
- Condition / age +2.5/5.0
- DSCR +1.2/10.0
- Appreciation +0.0/10.0
$264,311
🖨 Deal sheet (PDF) 📄 Offer letter ✓ Due diligence
Listing remarks MLS
Opportunity awaits in this charming 3-bedroom, 2-bath home nestled in a desirable neighborhood. With good bones, a practical floor plan, and generous living space, this home is ready for updates and cosmetic improvements. The large yard, attached garage, and established surroundings add to its appeal. Perfect for buyers with vision or investors looking for their next project, this property offers the chance to add value and make it your own. Sold as-is and priced
Key facts
- Attached garage
- Large yard
- 5,576 sq ft lot
Tags
Neighborhood map
What this means for you Summary
Snapshot
- This is a 3-bed/2.0-bath single-family listed at $264k.
Deal economics
- At list price, monthly cash flow is $-394 ($-5k/yr) — negative.
- To cash-flow at today's rent, offer at most $195k (26.3% below list).
- To meet the 1% rule (rent ≥ 1% of price), the offer needs to be $223k (15.5% below list).
- Recommended offer: $195k (26.3% below list) — sets the bar for cash-flow.
Location & tenants
- Location reads 80/100 on livability (#49 in TX, #1,954 nationally) — a professional / high-income tenant draw. Strengths: amenities A+, cost of living A+, housing A+; Watch: crime F.
- Keller ISD (urban): math 50% / reading 54% proficiency, ranked #91 of 826 in TX (top 11%) — acceptable for families but not a draw, mixed tenant base, ~2y average lease; only 19% free/reduced lunch — higher-income household profile.
- Zoned schools: Basswood El (math 27% / reading 32%, grade F, #2,525 of 4,322 statewide, top 62%, 513 students, 61% FRL); Fossil Hill Middle (math 32% / reading 43%, grade F, #736 of 1,662 statewide, top 45%, 838 students, 61% FRL); Fossil Ridge H S (math 41% / reading 55%, grade D, #571 of 1,632 statewide, top 36%, 2,329 students, 51% FRL) — zoned schools average 58% FRL vs 19% district-wide (39 pts higher); higher-poverty schools than district average — tighter screening recommended.
- Zoned-school proficiency averages 38% at this address vs 52% district-wide (-14 pts) — the specific schools serving this property underperform the Keller ISD average; the district grade overstates school quality for this exact location.
- Market conditions: Rents soft (-0.2%/yr); 478 active listings in the ZIP; 40 comparable units currently listed for rent nearby; rentals at typical pace (median 19d on market — plan ~3-4 weeks tenant-placement turnaround); solid renter incomes; 18,938 units permitted in Tarrant County in 2024 (8,336 in 5+ unit buildings).
Forward outlook
- Local home prices are declining (-3.0%/yr); year-one equity from $2k of loan paydown is wiped out by about $8k of value loss. Plan a longer hold.
- Tarrant County population projected at +41% by 2050 — long-run rental-demand tailwind backs the buy-and-hold thesis.
Negotiation context
- It's been on market 105 days — a 9% lower offer ($241k) is reasonable based on typical stale-listing flexibility.
- 3 sale attempts since 9y ago; this cycle's ask has dropped $21k (7%) from the opening price — seller is motivated, your offer sets the floor, not the list.
Risks & watch-outs
- Watch-outs: property tax is 2.7% of price.
- Climate carrying-cost: extreme-heat days projected 7→24/yr by 2055 (HVAC capex compounding) — expect insurance premiums to compound above CPI over the hold.
Questions for the listing agent
- What do current leases actually rent for vs. the listed asking? Can we see a recent rent roll and the last 12 months of T-12 income?
- It's been on market 105 days. Have you received any prior offers? Is the seller open to a 26% concession, seller financing, or rate buy-down credit?
- Property tax is high relative to price — has the assessment been appealed recently, and will the sale trigger a re-assessment?
- What does the HOA fee cover, when was the last increase, and are there any pending special assessments or reserve-fund shortfalls?
- Why hasn't it sold? Are there any deal-killer items the seller is aware of (foundation, flood, title, zoning, code violations)?
- Is there a deadline driving the sale (1031 exchange, divorce, estate, relocation)? That informs how much negotiation room exists.
- Schools are D-rated, which usually means shorter tenancies and higher turnover. Who's the typical renter profile here, and what's been the actual vacancy rate?
- Crime grade is F in this area — have there been break-ins, vandalism, or insurance claims at this property in the last 3 years? What carrier currently insures it and at what premium?
- The area grade is low — what's the realistic commute time and amenity access for the typical tenant pool here? Any planned neighborhood developments (good or bad) we should know about?
- What's the average days-on-market for RENTAL listings here right now (not sales)? A rising rental-DOM trend means longer vacancies and softer asking-rent achievability than the comps imply.
- What's the recent tenant-quality profile in this submarket — average credit score on applications, eviction rate, late-payment / NSF rate, and stable-employment percentage? A property-management company in the area should have these aggregated.
- How much new for-sale + rental construction is in the pipeline within 1–3 miles? Heavy new supply typically softens prices + rents 12–24 months out; constrained supply supports both.
Investment metrics
- 1% rule
- 0.84% ✗
- Cap rate
- 4.50%
- Cash-on-cash
- -6.39%
- DSCR
- 0.72
- GRM
- 9.9
CMA / ARV
- ARV (median comp)
- $313,920
- List price
- $264,311
- Delta
- -15.80%
- Verdict
- UNDERPRICED
- Comps
- 20 within 1.0 mi
Show comp detail 12 sales within ~0.75 mi
| Address | Dist | Beds/Ba | Sqft | Sold | Price | $/sf | Match |
|---|---|---|---|---|---|---|---|
| 7761 Berrenda Dr | 0.13mi | 3/2.0 | 1,693 (+3%) | 1mo | $295,000 | $174 | 88 |
| 2432 Barzona Dr | 0.20mi | 3/2.0 | 1,630 (-1%) | 2mo | $329,900 | $202 | 88 |
| 2345 Bernese Ln | 0.40mi | 3/2.0 | 1,621 (-2%) | 2mo | $299,786 | $185 | 77 |
| 1732 Foliage Dr | 0.59mi | 3/2.0 | 1,630 (-1%) | 4mo | $364,990 | $224 | 68 |
| 7837 Tudanca Trl | 0.32mi | 3/2.0 | 1,440 (-13%) | 3mo | $320,000 | $222 | 62 |
| 1701 Opaca Dr | 0.71mi | 3/2.0 | 1,600 (-3%) | 1mo | $396,629 | $248 | 62 |
| 1725 Shad Bush Dr | 0.69mi | 3/2.0 | 1,763 (+7%) | 2mo | $394,990 | $224 | 54 |
| 1737 White Feather Ln | 0.74mi | 3/2.0 | 1,756 (+7%) | 1mo | $275,000 | $157 | 54 |
| 1820 White Feather Ln | 0.68mi | 3/2.0 | 1,857 (+13%) | 2mo | $285,000 | $153 | 46 |
| 1705 Shad Bush Dr | 0.74mi | 4/2.0 (+1) | 1,763 (+7%) | 4mo | $389,990 | $221 | 45 |
| 8208 Storm Chaser Dr | 0.71mi | 3/2.0 | 1,826 (+11%) | 4mo | $259,900 | $142 | 45 |
| 2100 Sierra Pelada Dr | 0.71mi | 4/2.0 (+1) | 1,830 (+11%) | 1mo | $365,000 | $199 | 42 |
Match score weights: distance 35% · size 25% · config 20% · recency 20%. Top-matched comps best support the ARV.
Projected returns pro-forma
-3.0% appreciation · 0.0% rent growth · sell at horizon
- IRR
- -31.4%
- Equity multiple
- -0.00×
- Total profit
- $-74,236
- Equity at exit
- $39,410
- IRR
- -61.5%
- Equity multiple
- -0.64×
- Total profit
- $-121,288
- Equity at exit
- $22,853
Cash invested: $74,007 (down + closing). Projections, not guarantees.
Landlord ↔ Tenant lean methodology
- Overall (STATE)
- 87 Strongly Landlord-Friendly
- State Texas
- 87 Strongly Landlord-Friendly · R+5
- County
- — inherits STATE
- City
- — inherits STATE
ZIP-level market 76131
- Home prices YoY
- -15.6%
- Rents YoY
- -0.2%
- Active inventory
- 478
- Price-to-rent
- 9.9×
Monthly cashflow live
- Estimated rent
- $2,233 high interval (Pro) →
- Mortgage (P&I)
- −$1,386
- Tax from tax record
- −$605 /mo · $7,259/yr
- Insurance
- −$110
- HOA
- −$57
- Vacancy / Maint / Mgmt
- −$469
- Net cashflow
- $-394
Break-even live
Sensitivity live
| Price | -10% $-244 | -5% $-319 | +0% $-394 | +5% $-469 | +10% $-544 |
|---|---|---|---|---|---|
| Rent | -10% $-570 | -5% $-482 | +0% $-394 | +5% $-306 | +10% $-218 |
| Rate | -1.0pp $-261 | -0.5pp $-327 | base $-394 | +0.5pp $-463 | +1.0pp $-532 |
UW: 25.0% down · 7.5% · 30yr · 1.5% tax · 5.0% vac · 8.0% maint · 8.0% mgmt
Financing live
Cash to close
- Down payment
- $66,078
- Closing costs
- $7,929
- Reserves months
- —
- Total cash needed
- —
Loan-product check · same deal, 3 products live
Conventional
25% down · 7.5% · 30yr
- Down + closing
- —
- Monthly P&I
- —
- Monthly cashflow
- —
- DSCR
- —
- Eligible?
- —
Personal DTI + credit; lowest rate.
DSCR
20% down · 8.5% · 30yr
- Down + closing
- —
- Monthly P&I
- —
- Monthly cashflow
- —
- DSCR
- —
- Eligible?
- —
No personal income docs; deal must DSCR.
Hard money
10% down · 12.0% · 12mo
- Down + closing
- —
- Monthly P&I
- —
- Monthly cashflow
- —
- DSCR
- —
- Eligible?
- —
Short-term bridge; refi at stabilization.
Rent comps 40 comps
| Address | Beds | Baths | Sqft | Rent | $/sqft | DOM | Units | Dist |
|---|---|---|---|---|---|---|---|---|
| 2424 Gelbray Pl Fort Worth, TX | 3.0 | 2.0 | 1628 | $2,150 | $1.32 | 19d | 1 | 0.07mi |
| 7624 Scarlet View Trl Fort Worth, TX | 3.0 | 2.0 | 2028 | $2,500 | $1.23 | 0d | 1 | 0.14mi |
| 2333 Senepol Way Fort Worth, TX | 3.0 | 2.0 | 2164 | $2,100 | $0.97 | 23d | 1 | 0.21mi |
| 7908 Hereland Trl Fort Worth, TX | 3.0 | 2.0 | 1711 | $2,150 | $1.26 | 45d | 1 | 0.27mi |
| 7545 Indigo Ridge Dr Fort Worth, TX | 4.0 | 2.0 | 2030 | $2,150 | $1.06 | 45d | 1 | 0.27mi |
| 2344 Bermont Red Ln Fort Worth, TX | 3.0 | 2.0 | 2166 | $2,350 | $1.08 | 26d | 1 | 0.28mi |
| 7425 Bronsind Trl Fort Worth, TX | 3.0 | 2.0 | 2145 | $2,250 | $1.05 | 20d | 1 | 0.33mi |
| 7445 Sienna Ridge Ln Fort Worth, TX | 3.0 | 2.0 | 1374 | $2,000 | $1.46 | 1d | 1 | 0.37mi |
| 2357 Bernese Ln Fort Worth, TX | 3.0 | 2.0 | 1778 | $2,150 | $1.21 | 23d | 1 | 0.37mi |
| 8101 Kurgan Trl Fort Worth, TX | 3.0 | 2.0 | 1975 | $3,000 | $1.52 | 45d | 1 | 0.46mi |
| 2016 Elderica Dr Fort Worth, TX | 3.0–4.0 | 2.5–3.5 | 1535 | $2,428 | $1.58 | 0d | 7 | 0.65mi |
| 8220 Horseman Rd Fort Worth, TX | 3.0 | 2.0 | 1245 | $2,479 | $1.99 | 12d | 1 | 0.69mi |
| 1717 Victoria Dr Saginaw, TX | 4.0 | 2.0 | 1953 | $2,395 | $1.23 | 21d | 1 | 0.77mi |
| 7401 Cowhand Ct Fort Worth, TX | 3.0 | 2.5 | 1634 | $2,099 | $1.28 | 4d | 1 | 0.88mi |
| 1912 Potrillo Ln Fort Worth, TX | 4.0 | 2.0 | 2145 | $2,400 | $1.12 | 4d | 1 | 0.89mi |
| 1912 Potrillo Ln Fort Worth, TX | 4.0 | 2.0 | 2145 | $2,420 | $1.13 | 19d | 1 | 0.89mi |
| 1316 Mountain Air Trl Fort Worth, TX | 3.0 | 2.0 | 1598 | $2,300 | $1.44 | 18d | 1 | 0.91mi |
| 1268 Topeka Dr Saginaw, TX | 3.0 | 2.0 | 2163 | $2,195 | $1.01 | 20d | 1 | 1.04mi |
| 7001 Sandshell Blvd Fort Worth, TX | 3.0 | 2.0 | 1327 | $1,747 | $1.32 | 5d | 1 | 1.06mi |
| 7001 Sandshell Blvd Fort Worth, TX | 3.0 | 2.0 | 1327 | $1,805 | $1.36 | 45d | 1 | 1.06mi |
| 1032 Salt Creek Trl Fort Worth, TX | 3.0 | 2.0 | 1801 | $2,000 | $1.11 | 23d | 1 | 1.06mi |
| 7001 Sandshell Blvd Unit 7058 Fort Worth, TX | 2.0 | 2.0 | 1122 | $1,387 | $1.24 | 0d | 1 | 1.07mi |
| 7001 Sandshell Blvd Unit 612 Fort Worth, TX | 3.0 | 2.0 | 1329 | $1,712 | $1.29 | 13d | 1 | 1.07mi |
| 7001 Sandshell Blvd Unit 7034 Fort Worth, TX | 3.0 | 2.0 | 1329 | $1,712 | $1.29 | 0d | 1 | 1.07mi |
| 1350 N Blue Mound Rd Fort Worth, TX | 1.0–2.0 | 1.0–2.0 | 958 | $1,740 | $1.82 | 0d | 17 | 1.08mi |
| 1705 Desperado Rd Fort Worth, TX | 3.0 | 2.0 | 1784 | $2,050 | $1.15 | 22d | 1 | 1.09mi |
| 1000 Salt Creek Trl Fort Worth, TX | 4.0 | 2.0 | 2104 | $2,138 | $1.02 | 14d | 1 | 1.10mi |
| 1101 Trinity Trl Saginaw, TX | 3.0 | 2.0 | 1596 | $2,040 | $1.28 | 0d | 1 | 1.14mi |
| 6948 Carrington Ln Fort Worth, TX | 2.0 | 2.5 | 1388 | $2,000 | $1.44 | 26d | 1 | 1.20mi |
| 1016 Grand Central Pkwy Saginaw, TX | 3.0 | 2.0 | 1757 | $2,104 | $1.20 | 22d | 1 | 1.22mi |
| 3000 Peyton Brook Dr Fort Worth, TX | 2.0 | 2.5 | 1477 | $1,900 | $1.29 | 26d | 1 | 1.23mi |
| 7861 Waxwing Cir W Fort Worth, TX | 4.0 | 2.0 | 2075 | $2,300 | $1.11 | 45d | 1 | 1.28mi |
| 3220 Brixton Dr Fort Worth, TX | 3.0 | 2.0 | 1621 | $2,175 | $1.34 | 26d | 1 | 1.28mi |
| 6928 Derbyshire Dr Fort Worth, TX | 3.0 | 2.0 | 1949 | $2,295 | $1.18 | 45d | 1 | 1.29mi |
| 2650 Western Center Blvd Fort Worth, TX | 1.0–3.0 | 1.0–2.0 | 964 | $1,890 | $1.96 | 0d | 27 | 1.29mi |
| 6801 Sandshell Blvd Fort Worth, TX | 3.0 | 3.5 | 1500 | $2,350 | $1.57 | 45d | 1 | 1.29mi |
| 8301 Monterra Blvd Fort Worth, TX | 1.0–3.0 | 1.0–2.5 | 1097 | $2,590 | $2.36 | 0d | 32 | 1.30mi |
| 8100 N Riverside Dr Fort Worth, TX | 1.0–3.0 | 1.0–2.0 | 1053 | $1,999 | $1.90 | 0d | 22 | 1.31mi |
| 3724 Chaddybrook Ln Fort Worth, TX | 3.0 | 2.0 | 1673 | $2,095 | $1.25 | 17d | 1 | 1.32mi |
| 6761 Sandshell Blvd Fort Worth, TX | 1.0–3.0 | 1.0–2.0 | 1099 | $2,640 | $2.40 | 3d | 24 | 1.32mi |
HOA detail
- Monthly dues
- $57 · $684/yr
Listing history 16 events
-
2026-06-21days on market $264,311 Active 105 DOM
-
2026-06-18days on market $264,311 Active 102 DOM
-
2026-06-17remarks 546-char remark
-
2026-06-17pricestatusdays on market $264,311 Active 101 DOM
-
2026-05-15historical Active Option Contract 467-char remark
Show marketing remark (467 chars)
Opportunity awaits in this charming 3-bedroom, 2-bath home nestled in a desirable neighborhood. With good bones, a practical floor plan, and generous living space, this home is ready for updates and cosmetic improvements. The large yard, attached garage, and established surroundings add to its appeal. Perfect for buyers with vision or investors looking for their next project, this property offers the chance to add value and make it your own. Sold as-is and priced
-
2026-02-27price $279,990 467-char remark
Show marketing remark (467 chars)
Opportunity awaits in this charming 3-bedroom, 2-bath home nestled in a desirable neighborhood. With good bones, a practical floor plan, and generous living space, this home is ready for updates and cosmetic improvements. The large yard, attached garage, and established surroundings add to its appeal. Perfect for buyers with vision or investors looking for their next project, this property offers the chance to add value and make it your own. Sold as-is and priced
-
2026-02-09$285,000 Active 467-char remark
Show marketing remark (467 chars)
Opportunity awaits in this charming 3-bedroom, 2-bath home nestled in a desirable neighborhood. With good bones, a practical floor plan, and generous living space, this home is ready for updates and cosmetic improvements. The large yard, attached garage, and established surroundings add to its appeal. Perfect for buyers with vision or investors looking for their next project, this property offers the chance to add value and make it your own. Sold as-is and priced
-
2026-01-28status Pending
-
2026-01-28historical
-
2025-11-07$299,990 Active
-
2017-10-13soldstatus
-
2017-10-10soldstatus Sold
-
2017-09-15status Pending
-
2017-09-07historical Active Option Contract
-
2017-09-02price $210,000
-
2017-09-01$215,000 Active
ⓘ Source: listings_history table (triggers on properties + properties_extension) + one-shot
backfill from property_details.listing_events for pre-trigger history.
Tax reassessment forecast TX · Resets to sale price
- Current annual tax
- $7,259 · $605/mo
- Projected year-2 tax
- $7,259 · $605/mo
- Expected delta
- $0/yr ($0/mo · 0.0%)
ⓘ Screening estimate from a state-policy table — verify with the county assessor before closing.
Climate risk First Street
- Flood 1/10 Low FEMA zone X (unshaded) · 0% chance over 30 yrs
- Wildfire 4/10 Moderate
- Heat 8/10 Severe 7 d/yr ≥109°F today · 24 d/yr by 30 yrs out
- Wind 4/10 Moderate 24% chance of damaging wind over 30 yrs
- Air quality 4/10 Moderate 4 unhealthy d/yr today · 5 by 30 yrs out
Nearby sold comps map
Loading sold comps map…
Walkable amenities ~0.75 mi
Loading nearby amenities…
Taxation est. · year 1
- Rental income
- $26,795
- − Mortgage interest
- −$14,806
- − Property taxes
- −$7,259
- − Insurance
- −$1,322
- − Repairs & maintenance
- −$2,144
- − Management
- −$2,144
- − HOA
- −$684
- − Depreciation
- −$7,689
- Taxable loss
- −$9,251
- Est. tax savings @ 24.0%
- +$2,220
- After-tax cash flow
- $-2,509/yr
For passive investors: Depreciation is non-cash, so a rental often shows a tax loss while cash-flowing — sheltering income. Rental losses are passive: they offset passive income freely, and up to $25,000/yr can offset ordinary (W-2) income if you actively participate and your MAGI is under $100k (phasing out to $0 by $150k); unused losses carry forward. On sale, claimed depreciation is recaptured at up to 25%, and gains may owe capital-gains tax (a 1031 exchange can defer both). Figures are a year-1 estimate at your 24.0% rate — not tax advice; consult a CPA.
Schools (NCES district)
- District
- Keller ISD
- NCES district ID
- 4825260
- Math proficiency
- 50% ▼ -14.00%
- Reading proficiency
- 54% ▼ -9.00%
- Median HH income
- $92,106
- Composite
- 48.46/100
- National rank
- #2131
- State rank
- #91 of 826 in TX
Livability — Fort Worth
- Score
- 80/100
- State rank
- #49
- US rank
- #1954
Category grades
Schools grade is shown separately in the Schools card above.
Census & demographics
- Census place
- Fort Worth, TX
- County
- Tarrant County · 2,033,669 people
- City population
- 911,619
- Metro
- Dallas-Fort Worth-Arlington, TX
- Population (ZIP)
- 56,322
- Household income
- $108,694
- Rent vs Own
- Severe rent burden
- 1805.0
Population outlook (Tarrant County) Hauer SSP2
- Today (2025)
- 2,380,417 people
- By 2030
- 2,578,900 · +8.3%
- By 2040
- 2,974,995 · +25.0%
- By 2050
- 3,350,489 · +40.8%
- By 2075
- 4,216,909 · +77.2%
- By 2100
- 4,741,527 · +99.2%
Race, ethnicity, and origin ACS 2023
- Neighborhood character
- Highly diverse neighborhood (Simpson 0.71)
- Race & ethnicity
- White 42% Hispanic / Latino 27% Black 14% Two or more races 12% Asian 12%
- Hispanic origin (detail)
- Mexican 19% Puerto Rican 4%
- Common ancestry
- Lithuanian 1% Slovak 1% Iranian 1%
- Foreign-born
- 16% · Canada, Vietnam, India
- Languages at home
- 67% English-only · Spanish 18% Other Indo-European 6% Vietnamese 2%
Political lean MEDSL · Tarrant
- 2024 margin
- Lean R (+5.1) · D 46.7% · R 51.9% · Other 1.4%
- 2008→2024 swing
- +6.6pp toward D · 2008: -11.7pp · 2024: -5.1pp
- All cycles
- 2024: R+5.1 2020: D+0.2 2016: R+8.7 2012: R+15.7 2008: R+11.7
Not yet ingested
- Civics
- —
Market trends
- HPI YoY
- ▼ -46.06%
- Current HPI
- 249.22
- Rent YoY
- ▼ -0.17%
- Metro
- Dallas-Fort Worth-Arlington, TX
- State GDP YoY
- ▲ 3.95%
- F500 in state
- 110
Industry mix (Fortune 500 HQ in TX)
| Industry | F500 HQs | Revenue |
|---|---|---|
| Energy | 16 | $1,198B |
|
||
| Technology | 5 | $198B |
|
||
| Engineering / Construction | 4 | $72B |
|
||
| Energy Services | 3 | $60B |
|
||
| Utilities | 3 | $41B |
|
||
| Healthcare | 2 | $330B |
|
||
Price history
+30.2% since first listed12 events — show timeline
- 2026-05-15 Contingent — NTREIS
- 2026-02-27 Price Changed $279,990 NTREIS
- 2026-02-09 Listed $285,000 NTREIS
- 2026-01-28 Pending — HARMLS
- 2026-01-28 Listing Removed — HARMLS
- 2025-11-07 Listed $299,990 HARMLS
- 2017-10-13 Sold (Public Records) — Public Records
- 2017-10-10 Sold (MLS) — NTREIS
- 2017-09-15 Pending — NTREIS
- 2017-09-07 Contingent — NTREIS
- 2017-09-02 Price Changed $210,000 NTREIS
- 2017-09-01 Listed $215,000 NTREIS
Property tax history
+21.5%/yrLatest (2025): $7,259 · -0.4% YoY. Source: county tax records.
Cash-flow waterfall
monthlySold comps — $/sqft
last 12 mo · ≤1 miLoading sold comps…