68 Mccoppin St #11 · San Francisco, CA
Flood risk 1/10 · Minimal
- FEMA flood zone
- X (unshaded)
- Chance of flooding over 30 yrs
- 0.0%
- Est. flood insurance / yr
- $507 – $1,088
Fire risk 1/10 · Minimal
- Est. fire insurance / yr
- $659 – $1,223
Heat risk 2/10 · Minimal
- Hot days now (above 78°F)
- 8 days/yr
- Hot days in 30 yrs
- 18 days/yr
Wind risk 1/10 · Minimal
- Chance of severe wind over 30 yrs
- —
Air-quality risk 8/10 · Major
- Unhealthy air days now
- 15 days/yr
- Unhealthy air days in 30 yrs
- 15 days/yr
Risk factors via First Street. Map © Google.
Why this score? — see what drove the D grade
The composite is a weighted blend of 9 inputs, each scored 0–100. Each bar is that input's sub-score; the figure is the points it added to the 100-point composite (weight × sub-score).
- ARV discount +8.3/15.0
- Appreciation +7.5/10.0
- Cash flow +6.0/30.0
- Rent growth +5.0/5.0
- Schools +5.0/10.0
- Livability +3.8/5.0
- Condition / age +2.5/5.0
- 1% rule +1.7/10.0
- DSCR +0.3/10.0
$699,000
🖨 Deal sheet (PDF) 📄 Offer letter ✓ Due diligence
Listing remarks MLS
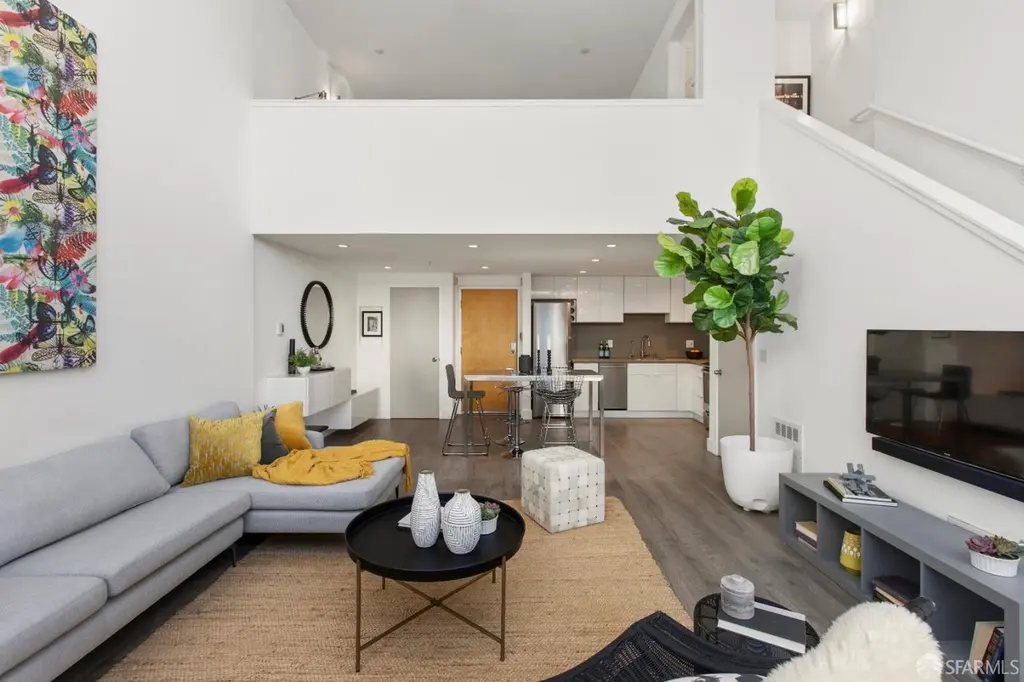
The Hub: Top-floor living at the crossroads of Valencia and Hayes Valley Positioned at the nexus of the Valencia Corridor and Hayes Valley, this sun-drenched loft is defined by its soaring windows and an abundance of natural light. The open layout transitions naturally from quiet mornings to hosting friends, with double doors leading to a private balcony, ideal for al fresco evenings. The upstairs mezzanine serves as a serene retreat above the city, featuring a comfortable bedroom, bath, and a spacious walk-in closet that keeps the living area uncluttered. With a 99 Walk Score, convenience is a core feature. You have dedicated one-car parking plus additional space for a motorcycle or bikes. You're steps from the boutiques of Hayes Valley, the energy of Valencia Street, and charm of Duboce Triangle, the greenery of Mission Dolores, plus instant access to tech shuttle stops, nearby bike share station, public transit and the 101/280 corridors.
Key facts
- Private balcony
- Top-floor living
- Steps from boutiques
Tags
Neighborhood map
What this means for you Summary
Snapshot
- This is a 1-bed/1.0-bath condo listed at $699k.
Deal economics
- At list price, monthly cash flow is $-1k ($-16k/yr) — negative.
- To cash-flow at today's rent, offer at most $461k (34.0% below list).
- To meet the 1% rule (rent ≥ 1% of price), the offer needs to be $469k (32.9% below list).
- Recommended offer: $461k (34.0% below list) — sets the bar for cash-flow.
- Cap rate 4.0% vs local median 2.1% in San Francisco — top-decile yield for the area; either an underpriced asset or a hidden risk that comps aren't pricing in. Stress-test before assuming the spread holds.
Location & tenants
- Location reads 76/100 on livability (#90 in CA, #3,143 nationally) — a middle-class / working-renter tenant base. Strengths: amenities A+, commute A+, employment A+; Watch: crime F, cost of living F.
- San Francisco Unified (urban): math 50% / reading 56% proficiency, ranked #322 of 1,400 in CA (top 23%) — acceptable for families but not a draw, mixed tenant base, ~2y average lease.
- Zoned schools: Lilienthal (Claire) Elementary (669 students, 19% FRL); Giannini (A.P.) Middle (1,192 students, 34% FRL); Lowell High (2,632 students, 37% FRL) — zoned schools average 30% FRL vs 49% district-wide (19 pts lower); this property's tenant base skews higher-income than the district average.
- Market conditions: Rents rising fast (+15.5%/yr); 113 active listings in the ZIP; 40 comparable units currently listed for rent nearby; rentals leasing fast (median 7d on market — plan ~1-2 weeks tenant-placement turnaround); high-income renter base; 750 units permitted in San Francisco County in 2024 (688 in 5+ unit buildings).
- At $4,693/mo this rent would consume 48% of the median local household income ($116k/yr) (locally 2666% of renters already pay >50% of income on rent) — very limited rent-growth headroom before tenants either downsize or default.
Forward outlook
- In year one you build about $40k of equity ($5k loan paydown + $35k appreciation (5.0% local appreciation)).
- San Francisco County population projected at +39% by 2050 — long-run rental-demand tailwind backs the buy-and-hold thesis.
- By year 2, paydown + projected appreciation supports a ~$63k cash-out refi (75% LTV) — recoverable capital for the next deal without selling this one.
Negotiation context
- It's been on market 94 days — a 9% lower offer ($636k) is reasonable based on typical stale-listing flexibility.
- 2 sale attempts since 10y ago with the ask held roughly flat each time — persistent listings suggest the price (not the market) is what's stuck; bring a comps-based counter.
Questions for the listing agent
- What do current leases actually rent for vs. the listed asking? Can we see a recent rent roll and the last 12 months of T-12 income?
- It's been on market 94 days. Have you received any prior offers? Is the seller open to a 34% concession, seller financing, or rate buy-down credit?
- What does the HOA fee cover, when was the last increase, and are there any pending special assessments or reserve-fund shortfalls?
- Any open or pending special assessments — roof, HVAC, plumbing, elevator, façade? What's the per-unit balance and payoff schedule, and is the seller paying it off at close or rolling it to the buyer?
- Why hasn't it sold? Are there any deal-killer items the seller is aware of (foundation, flood, title, zoning, code violations)?
- Is there a deadline driving the sale (1031 exchange, divorce, estate, relocation)? That informs how much negotiation room exists.
- Schools are B-rated — typically a magnet for longer-tenancy family renters. What's the average tenant stay here, and is there a school-zone premium baked into asking?
- Crime grade is F in this area — have there been break-ins, vandalism, or insurance claims at this property in the last 3 years? What carrier currently insures it and at what premium?
- The area grade is low — what's the realistic commute time and amenity access for the typical tenant pool here? Any planned neighborhood developments (good or bad) we should know about?
- What's the average days-on-market for RENTAL listings here right now (not sales)? A rising rental-DOM trend means longer vacancies and softer asking-rent achievability than the comps imply.
- What's the recent tenant-quality profile in this submarket — average credit score on applications, eviction rate, late-payment / NSF rate, and stable-employment percentage? A property-management company in the area should have these aggregated.
- How much new apartment / multifamily construction is in the pipeline within 1–3 miles? Heavy new supply (>2% of stock underway) typically softens rents 12–24 months out; light construction supports rent growth.
Investment metrics
- 1% rule
- 0.67% ✗
- Cap rate
- 3.98%
- Cash-on-cash
- -8.25%
- DSCR
- 0.63
- GRM
- 12.4
CMA / ARV
- ARV (median comp)
- $711,389
- List price
- $699,000
- Delta
- -1.74%
- Verdict
- FAIR
- Comps
- 20 within 1.0 mi
Projected returns pro-forma
4.96% appreciation · 8.0% rent growth · sell at horizon
- IRR
- 7.7%
- Equity multiple
- 1.51×
- Total profit
- $98,922
- Equity at exit
- $394,522
- IRR
- 11.4%
- Equity multiple
- 3.22×
- Total profit
- $433,890
- Equity at exit
- $679,580
Cash invested: $195,720 (down + closing). Projections, not guarantees.
Landlord ↔ Tenant lean methodology
- Overall (CITY)
- 0 Strongly Tenant-Friendly
- State California
- 18 Strongly Tenant-Friendly · D+13
- County
- — inherits STATE
- City San Francisco
- 0 Strongly Tenant-Friendly · D+57
ZIP-level market 94103
- Home prices YoY
- 2.9%
- Rents YoY
- 15.5%
- Active inventory
- 113
- Price-to-rent
- 12.4×
Monthly cashflow live
- Estimated rent
- $4,693 high interval (Pro) →
- Mortgage (P&I)
- −$3,666
- Tax from tax record
- −$676 /mo · $8,117/yr
- Insurance
- −$291
- HOA
- −$420
- Vacancy / Maint / Mgmt
- −$986
- Net cashflow
- $-1,346
Break-even live
Sensitivity live
| Price | -10% $-950 | -5% $-1,148 | +0% $-1,346 | +5% $-1,543 | +10% $-1,741 |
|---|---|---|---|---|---|
| Rent | -10% $-1,716 | -5% $-1,531 | +0% $-1,346 | +5% $-1,160 | +10% $-975 |
| Rate | -1.0pp $-994 | -0.5pp $-1,168 | base $-1,346 | +0.5pp $-1,527 | +1.0pp $-1,711 |
UW: 25.0% down · 7.5% · 30yr · 1.5% tax · 5.0% vac · 8.0% maint · 8.0% mgmt
Financing live
Cash to close
- Down payment
- $174,750
- Closing costs
- $20,970
- Reserves months
- —
- Total cash needed
- —
Loan-product check · same deal, 3 products live
Conventional
25% down · 7.5% · 30yr
- Down + closing
- —
- Monthly P&I
- —
- Monthly cashflow
- —
- DSCR
- —
- Eligible?
- —
Personal DTI + credit; lowest rate.
DSCR
20% down · 8.5% · 30yr
- Down + closing
- —
- Monthly P&I
- —
- Monthly cashflow
- —
- DSCR
- —
- Eligible?
- —
No personal income docs; deal must DSCR.
Hard money
10% down · 12.0% · 12mo
- Down + closing
- —
- Monthly P&I
- —
- Monthly cashflow
- —
- DSCR
- —
- Eligible?
- —
Short-term bridge; refi at stabilization.
Rent comps 40 comps
| Address | Beds | Baths | Sqft | Rent | $/sqft | DOM | Units | Dist |
|---|---|---|---|---|---|---|---|---|
| 68 McCoppin St San Francisco, CA | 1.0 | 1.0 | 734 | $3,825 | $5.21 | 18d | 2 | 0.01mi |
| 1699 Market St San Francisco, CA | 1.0 | 1.0 | 561 | $4,871 | $8.68 | 0d | 7 | 0.03mi |
| 55 Page St San Francisco, CA | 1.0 | 1.0 | 868 | $2,450 | $2.82 | 45d | 1 | 0.12mi |
| 1 Brady St San Francisco, CA | 2.0 | 1.0–2.0 | 889 | $5,570 | $6.26 | 0d | 26 | 0.13mi |
| 30 Otis St San Francisco, CA | 2.0 | 1.0–2.0 | 874 | $6,956 | $7.95 | 0d | 15 | 0.18mi |
| 200 Buchanan St San Francisco, CA | 1.0–2.0 | 1.0–2.0 | 1015 | $5,320 | $5.24 | 0d | 10 | 0.25mi |
| 325 Octavia St San Francisco, CA | 2.0 | 1.0–2.0 | 811 | $6,889 | $8.49 | 0d | 1 | 0.25mi |
| 225 Fell St San Francisco, CA | 1.0 | 1.0 | 512 | $4,495 | $8.77 | 9d | 3 | 0.28mi |
| 8 Buchanan St #609 San Francisco, CA | 2.0 | 2.0 | 990 | $6,950 | $7.02 | 9d | 1 | 0.28mi |
| 100 Van Ness Ave #1477 San Francisco, CA | 1.0–2.0 | 1.0–2.0 | 865 | $5,470 | $6.32 | 0d | 2 | 0.35mi |
| 1875 Mission St #210 San Francisco, CA | 1.0 | 1.0 | 825 | $4,000 | $4.85 | 45d | 1 | 0.36mi |
| 1600 15th St San Francisco, CA | 1.0–2.0 | 1.0–2.0 | 931 | $4,109 | $4.41 | 0d | 6 | 0.37mi |
| 38 Dolores St San Francisco, CA | 2.0 | 1.0 | 789 | $5,579 | $7.07 | 0d | 1 | 0.37mi |
| 8 10th St San Francisco, CA | 2.0 | 1.0–2.0 | 919 | $6,284 | $6.83 | 0d | 26 | 0.38mi |
| 150 Van Ness Ave #1475 San Francisco, CA | 1.0 | 1.0 | 615 | $5,510 | $8.96 | 22d | 1 | 0.38mi |
| 1 Polk St San Francisco, CA | 1.0 | 1.0 | 773 | $4,482 | $5.79 | 0d | 4 | 0.40mi |
| 616 Hayes St San Francisco, CA | 2.0 | 1.0 | 983 | $5,895 | $6.00 | 23d | 1 | 0.41mi |
| 1390 Market St San Francisco, CA | 1.0 | 1.0 | 561 | $4,067 | $7.25 | 0d | 13 | 0.43mi |
| 530 Grove St San Francisco, CA | 1.0 | 1.0 | 600 | $3,895 | $6.49 | 9d | 1 | 0.44mi |
| 101 Polk St San Francisco, CA | 1.0 | 1.0 | 573 | $4,628 | $8.07 | 0d | 7 | 0.44mi |
| 400 Duboce Ave San Francisco, CA | 2.0 | 1.0 | 923 | $7,475 | $8.10 | 25d | 1 | 0.45mi |
| 677 Oak St Unit 8 San Francisco, CA | 2.0 | 1.0 | 850 | $4,395 | $5.17 | 20d | 1 | 0.47mi |
| 55 9th St San Francisco, CA | 2.0 | 1.0–2.0 | 833 | $4,428 | $5.32 | 0d | 1 | 0.50mi |
| 257 Church St San Francisco, CA | 2.0 | 1.0 | 1100 | $5,995 | $5.45 | 45d | 1 | 0.52mi |
| 1288 Howard St #1908 San Francisco, CA | 1.0–2.0 | 1.0–2.0 | 782 | $4,190 | $5.35 | 3d | 2 | 0.54mi |
| 380 10th St San Francisco, CA | 2.0 | 2.0 | 1122 | $5,495 | $4.90 | 46d | 1 | 0.56mi |
| 901 Fell St Apt 17 San Francisco, CA | 1.0 | 1.0 | 750 | $3,000 | $4.00 | 0d | 1 | 0.62mi |
| 750 Golden Gate Ave San Francisco, CA | 3.0 | 1.0–2.5 | 681 | $1,562 | $2.29 | 45d | 1 | 0.62mi |
| 33 8th St San Francisco, CA | 1.0–2.0 | 1.0 | 646 | $3,637 | $5.63 | 0d | 10 | 0.63mi |
| 801 Fillmore St Apt 1 San Francisco, CA | 2.0 | 1.0 | 970 | $6,195 | $6.39 | 45d | 1 | 0.63mi |
| 601 Van Ness Ave San Francisco, CA | 1.0 | 1.0 | 653 | $3,795 | $5.81 | 11d | 2 | 0.63mi |
| 601 Van Ness Ave San Francisco, CA | 1.0 | 1.0 | 637 | $3,820 | $6.00 | 0d | 2 | 0.63mi |
| 1190 Mission St San Francisco, CA | 1.0 | 1.0 | 508 | $3,342 | $6.57 | 0d | 5 | 0.64mi |
| 1177 Market St San Francisco, CA | 1.0–2.0 | 1.0 | 562 | $3,629 | $6.45 | 0d | 8 | 0.64mi |
| 1222 Harrison St San Francisco, CA | 2.0 | 1.0–2.5 | 853 | $4,902 | $5.75 | 0d | 33 | 0.70mi |
| 73 Sumner St San Francisco, CA | 2.0 | 2.0 | 1100 | $4,750 | $4.32 | 45d | 1 | 0.71mi |
| 345 8th St San Francisco, CA | 1.0 | 1.0 | 946 | $4,095 | $4.33 | 45d | 2 | 0.72mi |
| 1247 Harrison St #21 San Francisco, CA | 1.0 | 1.5 | 1089 | $4,950 | $4.55 | 20d | 1 | 0.72mi |
| 60 Rausch St San Francisco, CA | 1.0 | 1.0 | 767 | $4,300 | $5.61 | 7d | 1 | 0.73mi |
| 575 Pierce St San Francisco, CA | 1.0 | 1.0 | 700 | $5,595 | $7.99 | 45d | 1 | 0.73mi |
HOA detail condo
- Monthly dues
- $420 · $5,040/yr
- Assessments
- None detected in remarks — confirm with the listing agent.
Listing history 20 events
-
2026-06-21days on market $699,000 Active 94 DOM
-
2026-06-18days on market $699,000 Active 91 DOM
-
2026-06-17days on market $699,000 Active 90 DOM
-
2026-06-16days on market $699,000 Active 89 DOM
-
2026-06-15days on market $699,000 Active 88 DOM
-
2026-06-13days on market $699,000 Active 86 DOM
-
2026-06-13days on market $699,000 Active 85 DOM
-
2026-06-09days on market $699,000 Active 82 DOM
-
2026-06-08days on market $699,000 Active 81 DOM
-
2026-06-07days on market $699,000 Active 80 DOM
-
2026-06-04days on market $699,000 Active 77 DOM
-
2026-06-03days on market $699,000 Active 76 DOM
-
2026-06-02days on market $699,000 Active 75 DOM
-
2026-06-01days on market $699,000 Active 74 DOM
-
2026-05-31days on market $699,000 Active 73 DOM
-
2026-03-19$699,000 Active 957-char remark
Show marketing remark (957 chars)
The Hub: Top-floor living at the crossroads of Valencia and Hayes Valley Positioned at the nexus of the Valencia Corridor and Hayes Valley, this sun-drenched loft is defined by its soaring windows and an abundance of natural light. The open layout transitions naturally from quiet mornings to hosting friends, with double doors leading to a private balcony, ideal for al fresco evenings. The upstairs mezzanine serves as a serene retreat above the city, featuring a comfortable bedroom, bath, and a spacious walk-in closet that keeps the living area uncluttered. With a 99 Walk Score, convenience is a core feature. You have dedicated one-car parking plus additional space for a motorcycle or bikes. You're steps from the boutiques of Hayes Valley, the energy of Valencia Street, and charm of Duboce Triangle, the greenery of Mission Dolores, plus instant access to tech shuttle stops, nearby bike share station, public transit and the 101/280 corridors.
-
2016-03-31soldstatus $728,000 Closed 255-char remark
Show marketing remark (255 chars)
1BR Loft Condo in Valencia Corridor close to Hayes Valley, Market Street and SOMA. Deeded 1 car parking & 1 motorcycle space in garage, common laundry and low HOA dues. Separately metered for utilities including water. Building has new roof in 2015.
-
2016-03-30soldstatus $728,000
-
2016-03-07status Contingent - Show 255-char remark
Show marketing remark (255 chars)
1BR Loft Condo in Valencia Corridor close to Hayes Valley, Market Street and SOMA. Deeded 1 car parking & 1 motorcycle space in garage, common laundry and low HOA dues. Separately metered for utilities including water. Building has new roof in 2015.
-
2016-02-25$749,000 Active 255-char remark
Show marketing remark (255 chars)
1BR Loft Condo in Valencia Corridor close to Hayes Valley, Market Street and SOMA. Deeded 1 car parking & 1 motorcycle space in garage, common laundry and low HOA dues. Separately metered for utilities including water. Building has new roof in 2015.
ⓘ Source: listings_history table (triggers on properties + properties_extension) + one-shot
backfill from property_details.listing_events for pre-trigger history.
Tax reassessment forecast CA · Resets to sale price
- Current annual tax
- $8,117 · $676/mo
- Projected year-2 tax
- $8,117 · $676/mo
- Expected delta
- $0/yr ($0/mo · 0.0%)
ⓘ Screening estimate from a state-policy table — verify with the county assessor before closing.
Climate risk First Street
- Flood 1/10 Low FEMA zone X (unshaded) · 0% chance over 30 yrs
- Wildfire 1/10 Low
- Heat 2/10 Low 8 d/yr ≥78°F today · 18 d/yr by 30 yrs out
- Wind 1/10 Low
- Air quality 8/10 Severe 15 unhealthy d/yr today · 15 by 30 yrs out
Nearby sold comps map
Loading sold comps map…
Walkable amenities ~0.75 mi
Loading nearby amenities…
Taxation est. · year 1
- Rental income
- $56,319
- − Mortgage interest
- −$39,155
- − Property taxes
- −$8,117
- − Insurance
- −$3,495
- − Repairs & maintenance
- −$4,506
- − Management
- −$4,506
- − HOA
- −$5,040
- − Depreciation
- −$20,335
- Taxable loss
- −$28,833
- Est. tax savings @ 24.0%
- +$6,920
- After-tax cash flow
- $-9,227/yr
For passive investors: Depreciation is non-cash, so a rental often shows a tax loss while cash-flowing — sheltering income. Rental losses are passive: they offset passive income freely, and up to $25,000/yr can offset ordinary (W-2) income if you actively participate and your MAGI is under $100k (phasing out to $0 by $150k); unused losses carry forward. On sale, claimed depreciation is recaptured at up to 25%, and gains may owe capital-gains tax (a 1031 exchange can defer both). Figures are a year-1 estimate at your 24.0% rate — not tax advice; consult a CPA.
Schools (NCES district)
- District
- San Francisco Unified
- NCES district ID
- 0634410
- Math proficiency
- 50% ▬ 0.00%
- Reading proficiency
- 56% ▲ 1.00%
- Median HH income
- $81,249
- Composite
- 50.14/100
- National rank
- #4088
- State rank
- #322 of 1400 in CA
Livability — San Francisco
- Score
- 76/100
- State rank
- #90
- US rank
- #3143
Category grades
Schools grade is shown separately in the Schools card above.
Census & demographics
- Census place
- San Francisco, CA
- County
- San Francisco County · 827,552 people
- City population
- 827,552
- Metro
- San Francisco-Oakland-Berkeley, CA
- Population (ZIP)
- 34,964
- Household income
- $116,438
- Rent vs Own
- Severe rent burden
- 2666.0
Population outlook (San Francisco County) Hauer SSP2
- Today (2025)
- 1,030,936 people
- By 2030
- 1,110,409 · +7.7%
- By 2040
- 1,270,010 · +23.2%
- By 2050
- 1,435,001 · +39.2%
- By 2075
- 1,779,074 · +72.6%
- By 2100
- 1,966,767 · +90.8%
Race, ethnicity, and origin ACS 2023
- Neighborhood character
- Highly diverse neighborhood (Simpson 0.75)
- Race & ethnicity
- White 32% Asian 31% Hispanic / Latino 20% Two or more races 11% Black 10% Native American 2%
- Hispanic origin (detail)
- Mexican 11%
- Common ancestry
- Lithuanian 2% Slovak 2% Romanian 2%
- Foreign-born
- 36% · Canada, China, Vietnam
- Languages at home
- 56% English-only · Spanish 16% Chinese 9% Tagalog/Filipino 6%
Political lean MEDSL · San Francisco
- 2024 margin
- Solid D (+64.8) · D 80.3% · R 15.5% · Other 4.1%
- 2008→2024 swing
- -5.7pp toward R · 2008: 70.5pp · 2024: 64.8pp
- All cycles
- 2024: D+64.8 2020: D+72.5 2016: D+76.1 2012: D+70.2 2008: D+70.5
Not yet ingested
- Civics
- —
Market trends
- HPI YoY
- ▲ 4.96%
- Current HPI
- 175.4945
- Rent YoY
- ▲ 15.50%
- Metro
- San Francisco-Oakland-Berkeley, CA
- State GDP YoY
- ▲ 3.21%
- F500 in state
- 116
Industry mix (Fortune 500 HQ in CA)
| Industry | F500 HQs | Revenue |
|---|---|---|
| Technology | 27 | $1,492B |
|
||
| Financial Services | 3 | $174B |
|
||
| Retail | 3 | $44B |
|
||
| Insurance | 3 | $26B |
|
||
| Media / Entertainment | 2 | $115B |
|
||
| Pharmaceuticals / Biotech | 2 | $62B |
|
||
Price history
-6.7% since first listed5 events — show timeline
- 2026-03-19 Listed $699,000 San Francisco MLS
- 2016-03-31 Sold (MLS) $728,000 San Francisco MLS
- 2016-03-30 Sold (Public Records) $728,000 Public Records
- 2016-03-07 Pending — San Francisco MLS
- 2016-02-25 Listed $749,000 San Francisco MLS
Property tax history
+8.3%/yrLatest (2025): $8,117 · +1.1% YoY. Source: county tax records.
Cash-flow waterfall
monthlySold comps — $/sqft
last 12 mo · ≤1 miLoading sold comps…