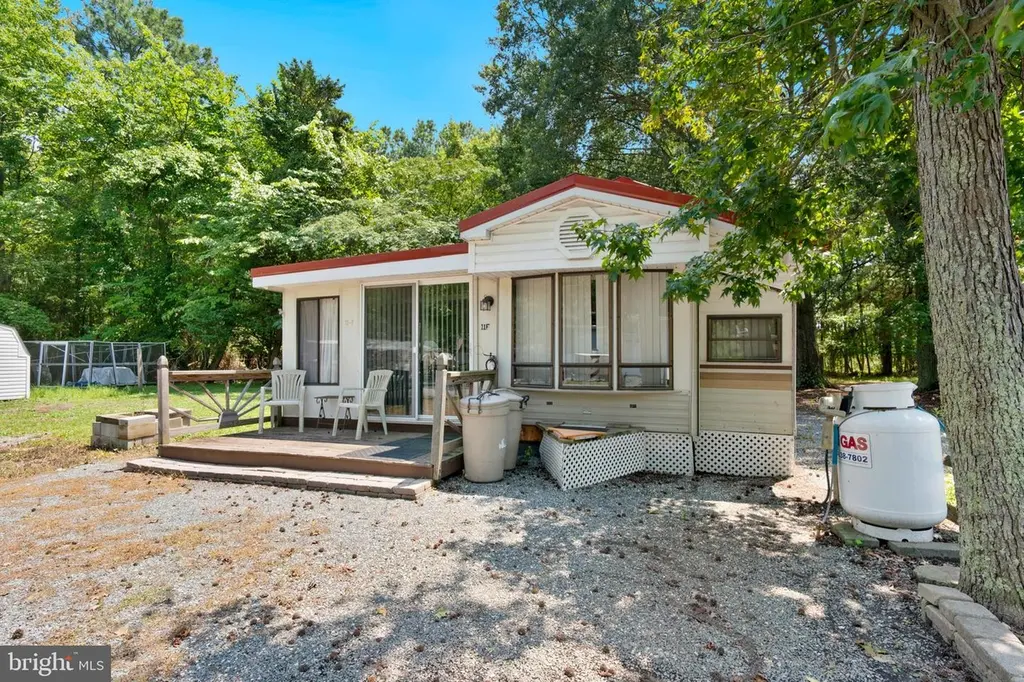
111 Beach Harbor Dr Unit 11F · Grasonville, MD
Flood risk 8/10 · Major
- FEMA flood zone
- X (shaded)
- Chance of flooding over 30 yrs
- 0.97%
- Est. flood insurance / yr
- $507 – $1,088
Fire risk 4/10 · Minor
- Est. fire insurance / yr
- $755 – $1,403
Heat risk 8/10 · Major
- Hot days now (above 104°F)
- 7 days/yr
- Hot days in 30 yrs
- 16 days/yr
Wind risk 6/10 · Moderate
- Chance of severe wind over 30 yrs
- 72.0%
Air-quality risk 4/10 · Minor
- Unhealthy air days now
- 4 days/yr
- Unhealthy air days in 30 yrs
- 6 days/yr
Risk factors via First Street. Map © Google.
Why this score? — see what drove the B- grade
The composite is a weighted blend of 9 inputs, each scored 0–100. Each bar is that input's sub-score; the figure is the points it added to the 100-point composite (weight × sub-score).
- Cash flow +30.0/30.0
- 1% rule +10.0/10.0
- DSCR +10.0/10.0
- ARV discount +7.5/15.0
- Livability +3.7/5.0
- Schools +3.0/10.0
- Rent growth +2.5/5.0
- Condition / age +2.2/5.0
- Appreciation +0.0/10.0
$52,000
🖨 Deal sheet (PDF) 📄 Offer letter ✓ Due diligence
Listing remarks
Welcome to your perfect Eastern Shore escape in the highly sought-after Beach Harbor Camper Cooperative! This is your opportunity to own a true waterfront lifestyle without the waterfront price tag. Located just steps from Jackson Creek with access out to the Chester River, this property is ideal for boating, kayaking, paddleboarding, or simply relaxing by the water all season long. Beach Harbor is known as one of the best-kept secrets on the Shore—a gated, amenity-rich community offering a private beach, boat ramps, marina access, pool, clubhouse, playground, and more. Whether you’re looking for a weekend getaway, summer retreat, or an affordable place to enjoy 3-season living
Key facts
- $250 HOA
- Community pool
- Built 1985
Property features AI
Finance
- Other: Ownership is cooperative; Pets allowed with no restrictions; Property in a federal flood zone
- HOA & community: Annual co-op fee of $3,000; HOA covers common area maintenance, pier/dock maintenance, reserve funds, road maintenance, and trash; Community amenities include beach, boat ramp, clubhouse, common grounds, gated community, pier/dock, and outdoor pool
Exterior
- Parking: Driveway
- Utilities: Public water; Public septic; Electric service
- Home design: Manufactured property; Outside city limits; Estimated year built
- Construction: Aluminum siding
- Exterior features: Community pool; Above-grade other structures
Interior
- Bedrooms: 2 bedrooms on the main level
- Bathrooms: 1 full bathroom on the main level; 1 full bathroom total
- Heating & cooling: Electric heating; Wall unit cooling; Electric hot water
- Interior features: Estimated living area; No basement
Neighborhood map
What this means for you Summary
Snapshot
- This is a 2-bed/1.0-bath condo listed at $52k. Condition is rated fair.
Deal economics
- At list price, monthly cash flow is $746 ($9k/yr) — positive.
- The deal already cash-flows at list — no discount required.
- Meets the 1% rule at list price ($2k rent vs $52k).
- Recommended offer: $50k (3.0% below list) — sets the bar for market timing.
- Cap rate 25.0% vs local median 1.6% in Grasonville — top-decile yield for the area; either an underpriced asset or a hidden risk that comps aren't pricing in. Stress-test before assuming the spread holds.
Location & tenants
- Location reads 74/100 on livability (#116 in MD, #4,789 nationally) — a middle-class / working-renter tenant base. Strengths: employment A+, housing A+, crime A; Watch: amenities F, commute F, cost of living F.
- Queen Anne'S County Public Schools (rural): math 22% / reading 39% proficiency, ranked #7 of 24 in MD (top 29%) — families likely to look elsewhere, expect single-tenant / working-renter base with shorter leases.
- Market conditions: 52 active listings in the ZIP; 1 comparable units currently listed for rent nearby; 320 units permitted in Queen Anne's County in 2024 (56 in 5+ unit buildings).
Forward outlook
- Local home prices are declining (-3.0%/yr); year-one equity from $360 of loan paydown is wiped out by about $2k of value loss. Plan a longer hold.
- At projected returns (-3.0% appreciation + 3.0% rent growth), your $15k cash investment doubles in ~2 years — after that, you're playing with house money.
Negotiation context
- It's been on market 43 days — a 3% lower offer ($50k) is reasonable based on typical stale-listing flexibility.
- 3 sale attempts; this cycle's ask has dropped $8k (13%) from the opening price — seller is motivated, your offer sets the floor, not the list.
Risks & watch-outs
- Watch-outs: flood insurance adds $66/mo.
- Climate carrying-cost: severe flood risk; major wind risk, 72% chance of damaging wind over 30y; extreme-heat days projected 7→16/yr by 2055 (HVAC capex compounding) — expect insurance premiums to compound above CPI over the hold.
Questions for the listing agent
- It's been on market 43 days. Have you received any prior offers? Is the seller open to a 3% concession, seller financing, or rate buy-down credit?
- Have any recent inspections been done? Can we get a copy of the seller's disclosures and any deferred-maintenance estimates?
- What's the actual annual flood-insurance premium (NFIP or private), and is the property in a SFHA with mandatory coverage?
- What does the HOA fee cover, when was the last increase, and are there any pending special assessments or reserve-fund shortfalls?
- Any open or pending special assessments — roof, HVAC, plumbing, elevator, façade? What's the per-unit balance and payoff schedule, and is the seller paying it off at close or rolling it to the buyer?
- Is there a deadline driving the sale (1031 exchange, divorce, estate, relocation)? That informs how much negotiation room exists.
- What's the average days-on-market for RENTAL listings here right now (not sales)? A rising rental-DOM trend means longer vacancies and softer asking-rent achievability than the comps imply.
- What's the recent tenant-quality profile in this submarket — average credit score on applications, eviction rate, late-payment / NSF rate, and stable-employment percentage? A property-management company in the area should have these aggregated.
- How much new apartment / multifamily construction is in the pipeline within 1–3 miles? Heavy new supply (>2% of stock underway) typically softens rents 12–24 months out; light construction supports rent growth.
Investment metrics
- 1% rule
- 3.46% ✓
- Cap rate
- 25.05%
- Cash-on-cash
- 66.98%
- DSCR
- 3.98
- GRM
- 2.4
CMA / ARV
No comps found within radius.
Projected returns pro-forma
-3.0% appreciation · 3.0% rent growth · sell at horizon
- IRR
- 60.5%
- Equity multiple
- 3.70×
- Total profit
- $39,320
- Equity at exit
- $7,753
- IRR
- 65.2%
- Equity multiple
- 7.62×
- Total profit
- $96,335
- Equity at exit
- $4,496
Cash invested: $14,560 (down + closing). Projections, not guarantees.
Landlord ↔ Tenant lean methodology
- Overall (STATE)
- 27 Tenant-Leaning
- State Maryland
- 27 Tenant-Leaning · D+14
- County
- — inherits STATE
- City
- — inherits STATE
ZIP-level market 21638
- Home prices YoY
- -4.7%
- Active inventory
- 52
- Price-to-rent
- 2.4×
Monthly cashflow live
- Estimated rent
- $1,800 medium interval (Pro) →
- Mortgage (P&I)
- −$273
- Tax est. 1.5%
- −$65 /mo · $780/yr
- Insurance
- −$22
- Flood insurance flood zone
- −$66 /mo · $798/yr
- HOA
- −$250
- Vacancy / Maint / Mgmt
- −$378
- Net cashflow
- $746
Break-even live
Sensitivity live
| Price | -10% $782 | -5% $764 | +0% $746 | +5% $728 | +10% $710 |
|---|---|---|---|---|---|
| Rent | -10% $604 | -5% $675 | +0% $746 | +5% $817 | +10% $888 |
| Rate | -1.0pp $772 | -0.5pp $759 | base $746 | +0.5pp $733 | +1.0pp $719 |
UW: 25.0% down · 7.5% · 30yr · 1.5% tax · 5.0% vac · 8.0% maint · 8.0% mgmt
Financing live
Cash to close
- Down payment
- $13,000
- Closing costs
- $1,560
- Reserves months
- —
- Total cash needed
- —
Loan-product check · same deal, 3 products live
Conventional
25% down · 7.5% · 30yr
- Down + closing
- —
- Monthly P&I
- —
- Monthly cashflow
- —
- DSCR
- —
- Eligible?
- —
Personal DTI + credit; lowest rate.
DSCR
20% down · 8.5% · 30yr
- Down + closing
- —
- Monthly P&I
- —
- Monthly cashflow
- —
- DSCR
- —
- Eligible?
- —
No personal income docs; deal must DSCR.
Hard money
10% down · 12.0% · 12mo
- Down + closing
- —
- Monthly P&I
- —
- Monthly cashflow
- —
- DSCR
- —
- Eligible?
- —
Short-term bridge; refi at stabilization.
Rent comps 1 comps
| Address | Beds | Baths | Sqft | Rent | $/sqft | DOM | Units | Dist |
|---|---|---|---|---|---|---|---|---|
| 107 Winchester Ave Unit 107 Grasonville, MD | 1.0 | 1.0 | 560 | $1,800 | $3.21 | 11d | 1 | 0.81mi |
HOA detail condo
- Monthly dues
- $250 · $3,000/yr
- Likely covers
- waterpoolsecurity
- Assessments
- None detected in remarks — confirm with the listing agent.
Listing history 21 events
-
2026-06-18days on market $52,000 Active 43 DOM
-
2026-06-17days on market $52,000 Active 42 DOM
-
2026-06-16days on market $52,000 Active 41 DOM
-
2026-06-15days on market $52,000 Active 40 DOM
-
2026-06-13days on market $52,000 Active 38 DOM
-
2026-06-09days on market $52,000 Active 34 DOM
-
2026-06-08days on market $52,000 Active 33 DOM
-
2026-06-07days on market $52,000 Active 32 DOM
-
2026-06-04days on market $52,000 Active 29 DOM
-
2026-06-03days on market $52,000 Active 28 DOM
-
2026-06-02days on market $52,000 Active 27 DOM
-
2026-06-01days on market $52,000 Active 26 DOM
-
2026-05-31days on market $52,000 Active 25 DOM
-
2026-05-18price $52,000
-
2026-05-06$60,000 Active
-
2025-10-25historical
-
2025-09-07price $58,000
-
2025-07-25$62,000 Active
-
2025-07-23historical
-
2025-05-29price $62,000
-
2025-01-03$65,000 Active
ⓘ Source: listings_history table (triggers on properties + properties_extension) + one-shot
backfill from property_details.listing_events for pre-trigger history.
Climate risk First Street
- Flood 8/10 Severe FEMA zone X (shaded) · 97% chance over 30 yrs
- Wildfire 4/10 Moderate
- Heat 8/10 Severe 7 d/yr ≥104°F today · 16 d/yr by 30 yrs out
- Wind 6/10 Major 72% chance of damaging wind over 30 yrs
- Air quality 4/10 Moderate 4 unhealthy d/yr today · 6 by 30 yrs out
Nearby sold comps map
Loading sold comps map…
Walkable amenities ~0.75 mi
Loading nearby amenities…
Taxation est. · year 1
- Rental income
- $21,600
- − Mortgage interest
- −$2,913
- − Property taxes
- −$780
- − Insurance
- −$1,058
- − Repairs & maintenance
- −$1,728
- − Management
- −$1,728
- − HOA
- −$3,000
- − Depreciation
- −$1,513
- Taxable income
- $8,881
- Est. tax owed @ 24.0%
- −$2,131
- After-tax cash flow
- $6,823/yr
For passive investors: Depreciation is non-cash, so a rental often shows a tax loss while cash-flowing — sheltering income. Rental losses are passive: they offset passive income freely, and up to $25,000/yr can offset ordinary (W-2) income if you actively participate and your MAGI is under $100k (phasing out to $0 by $150k); unused losses carry forward. On sale, claimed depreciation is recaptured at up to 25%, and gains may owe capital-gains tax (a 1031 exchange can defer both). Figures are a year-1 estimate at your 24.0% rate — not tax advice; consult a CPA.
Condition & rehab AI · 12 photos
This property requires significant repairs and renovations, but has potential for a substantial increase in value with proper updates.
Repairs flagged
- Major roof — Significant debris and construction materials are visible
- Major exterior siding — Significant debris and construction materials are visible
- Minor interior walls/paint — Paint appears faded
Value-add opportunities
- Both Painting — Fresh paint can improve the home's curb appeal and interior aesthetics
- Both Flooring replacement — New flooring can improve the home's appearance and functionality
- Both Appliance replacement — Modern appliances can improve the home's functionality and appeal
Renovation cost estimate screening
| Repair item | Severity | Est. cost |
|---|---|---|
| roof · Significant debris and construction materials are visible | Major | $15,000–50,000 |
| exterior siding · Significant debris and construction materials are visible | Major | $15,000–50,000 |
| interior walls/paint · Paint appears faded | Minor | $500–3,000 |
| Total estimated repair cost · 3 items | $30,500–103,000 |
Value-add ROI direction
- Both Painting — Fresh paint can improve the home's curb appeal and interior aesthetics ↑
- Both Flooring replacement — New flooring can improve the home's appearance and functionality ↑
- Both Appliance replacement — Modern appliances can improve the home's functionality and appeal ↑
ⓘ Cost ranges are severity-bucket heuristics (US national rule-of-thumb). Get contractor quotes + a written scope before underwriting a rehab budget.
Schools (NCES district)
- District
- Queen Anne'S County Public Schools
- NCES district ID
- 2400540
- Math proficiency
- 22% ▼ -30.00%
- Reading proficiency
- 39% ▼ -22.00%
- Median HH income
- $84,577
- Composite
- 29.86/100
- National rank
- #6406
- State rank
- #7 of 24 in MD
Livability — Grasonville
- Score
- 74/100
- State rank
- #116
- US rank
- #4789
Category grades
Schools grade is shown separately in the Schools card above.
Census & demographics
- Census place
- Grasonville, MD
- Population (ZIP)
- 5,068
Population outlook (Queen Anne's County) Hauer SSP2
- Today (2025)
- 51,149 people
- By 2030
- 51,979 · +1.6%
- By 2040
- 52,728 · +3.1%
- By 2050
- 51,828 · +1.3%
- By 2075
- 50,169 · -1.9%
- By 2100
- 44,442 · -13.1%
Race, ethnicity, and origin ACS 2023
- Neighborhood character
- Predominantly White (80%)
- Race & ethnicity
- White 80% Two or more races 10% Hispanic / Latino 5% Black 5%
- Hispanic origin (detail)
- Common ancestry
- Slovak 4% Italian 3% Romanian 3%
- Foreign-born
- 4% · Canada, South Korea, Dominican Republic
- Languages at home
- 95% English-only · Spanish 3% Other Indo-European 1%
Political lean MEDSL · Queen Anne's
- 2024 margin
- Strong R (+27.8) · D 35.1% · R 62.9% · Other 2.1%
- 2008→2024 swing
- -0.7pp no change · 2008: -27.1pp · 2024: -27.8pp
- All cycles
- 2024: R+27.8 2020: R+26.5 2016: R+36.1 2012: R+30.1 2008: R+27.1
Not yet ingested
- Civics
- —
Market trends
- HPI YoY
- ▼ -12.55%
- Current HPI
- 256.8252
- Rent YoY
- —
- Metro
- —
- State GDP YoY
- ▲ 2.97%
- F500 in state
- 12
Industry mix (Fortune 500 HQ in MD)
| Industry | F500 HQs | Revenue |
|---|---|---|
| Aerospace / Defense | 1 | $71B |
|
||
| Utilities | 1 | $25B |
|
||
| Hotels | 1 | $24B |
|
||
| Consumer Goods | 1 | $7B |
|
||
| Real Estate | 1 | $6B |
|
||
| Chemicals | 1 | $2B |
|
||
Price history
-20.0% since first listed8 events — show timeline
- 2026-05-18 Price Changed $52,000 BRIGHT MLS
- 2026-05-06 Listed $60,000 BRIGHT MLS
- 2025-10-25 Listing Removed — BRIGHT MLS
- 2025-09-07 Price Changed $58,000 BRIGHT MLS
- 2025-07-25 Listed $62,000 BRIGHT MLS
- 2025-07-23 Listing Removed — BRIGHT MLS
- 2025-05-29 Price Changed $62,000 BRIGHT MLS
- 2025-01-03 Listed $65,000 BRIGHT MLS
Cash-flow waterfall
monthlySold comps — $/sqft
last 12 mo · ≤1 miLoading sold comps…