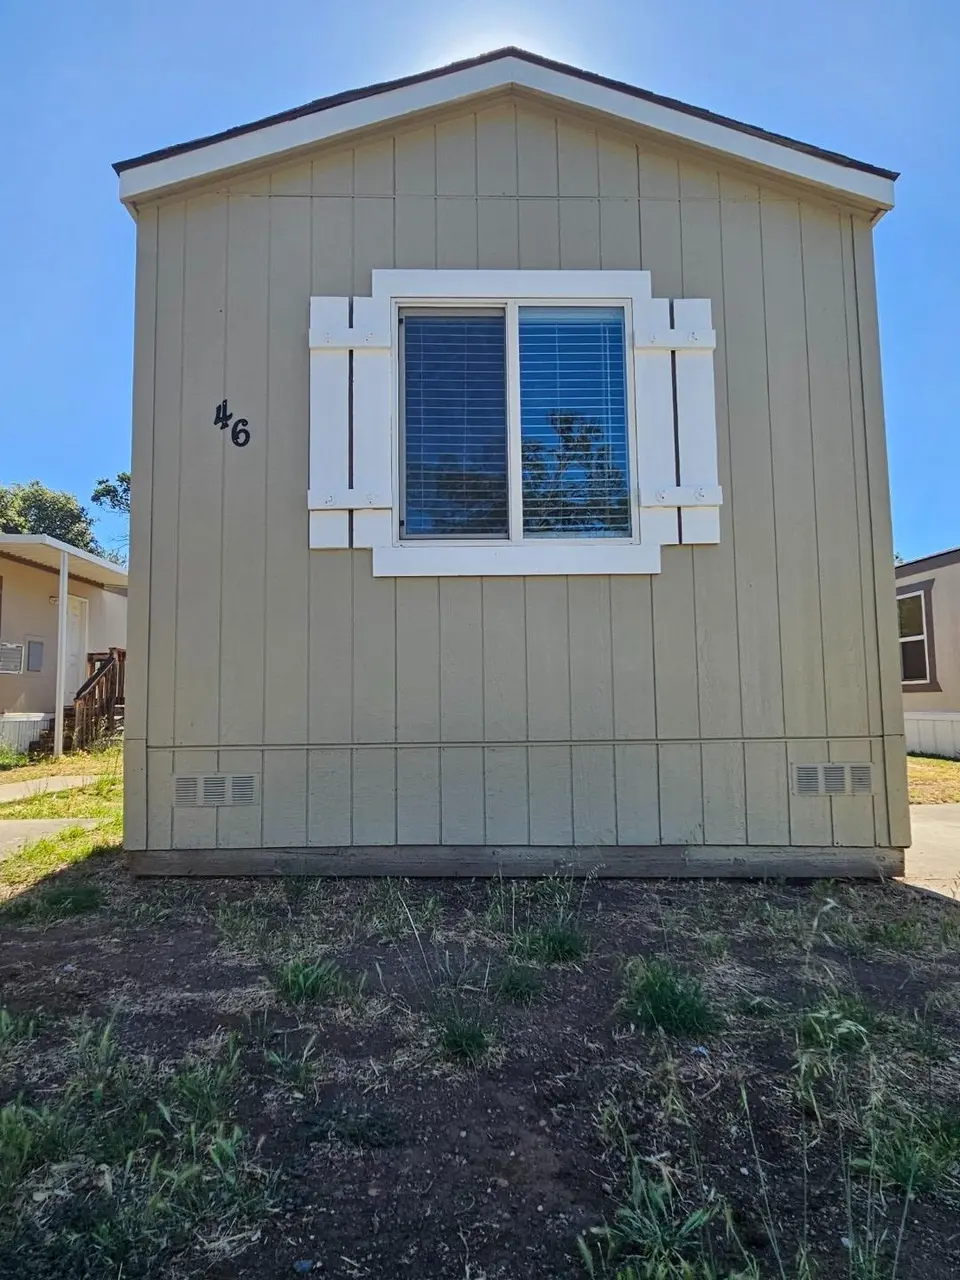
1616 Oro Dam Blvd E #46 · Oroville, CA
Flood risk No data
- FEMA flood zone
- —
- Chance of flooding over 30 yrs
- —
- Est. flood insurance / yr
- —
Fire risk No data
- Est. fire insurance / yr
- —
Heat risk No data
- Hot days now (above threshold)
- —
- Hot days in 30 yrs
- —
Wind risk No data
- Chance of severe wind over 30 yrs
- —
Air-quality risk No data
- Unhealthy air days now
- —
- Unhealthy air days in 30 yrs
- —
Risk factors via First Street. Map © Google.
Why this score? — see what drove the B- grade
The composite is a weighted blend of 9 inputs, each scored 0–100. Each bar is that input's sub-score; the figure is the points it added to the 100-point composite (weight × sub-score).
- Cash flow +30.0/30.0
- 1% rule +10.0/10.0
- DSCR +10.0/10.0
- ARV discount +7.5/15.0
- Condition / age +4.0/5.0
- Schools +2.8/10.0
- Rent growth +2.5/5.0
- Livability +2.5/5.0
- Appreciation +0.0/10.0
$49,990
🖨 Deal sheet 📄 Offer letter ✓ Due diligence
Listing remarks
Sundown Estates is the ideal sanctuary for people looking to lay down roots, settle in with family, or retreat for a peaceful retirement. This pet-friendly community welcomes people of all ages, and it won't take long to see why so many call Sundown Estates home. Green lawns and mature trees line the paved streets that wind through this welcoming neighborhood. And should you need assistance with anything, attentive and thoughtful staff are around to help get the job done. Home site #46 is a 2 bedroom, 1 bath that has recently been updated with new flooring throughout the home. All new windows. All new interior and exterior paint. Ask about financing options - affordable down and monthly pay
Key facts
- New flooring
- Green lawns
- Mature trees
Tags
Property features AI
Finance
- Other: Community directions: Located off Oro Dam Blvd. Refer to park map for exact home location.
- HOA & community: No homeowners association; Not a senior community; Land lease: No (listed land lease amount present)
Exterior
- Parking: Assigned parking; No garage
- Utilities: Individual electric meter; Public water; Public sewer
- Home design: Manufactured home located in a park; Single wide; Built in 2013; Located at 1616 Oro Dam Blvd E #46, Oroville, CA
- Construction: Aluminum skirting; Manufacturer: Clayton
- Exterior features: Composition roof; Lot features: Other
Interior
- Kitchen: Gas cook top; Dishwasher; Microwave
- Bedrooms: 2 bedrooms
- Flooring: Linoleum; Other flooring in living room (unspecified)
- Bathrooms: 1 full bathroom with tub/shower combination
- Heating & cooling: Central heating; Cooling: Other
- Interior features: Gas cook top; Dishwasher; Microwave; Pets allowed (cats and dogs); Living room (other features); Dining area open to kitchen/family
- Laundry & utility: Laundry area inside; 220V outlet in laundry
Neighborhood map
What this means for you Summary
Snapshot
- This is a 2-bed/1.0-bath manufactured listed at $50k. Condition is rated good.
Deal economics
- At list price, monthly cash flow is $690 ($8k/yr) — positive.
- The deal already cash-flows at list — no discount required.
- Meets the 1% rule at list price ($1k rent vs $50k).
- Recommended offer: $48k (3.0% below list) — sets the bar for market timing.
- Cap rate 22.9% vs local median 4.6% in Oroville — top-decile yield for the area; either an underpriced asset or a hidden risk that comps aren't pricing in. Stress-test before assuming the spread holds.
Location & tenants
- Location reads 50/100 on livability (#1,136 in CA) — a working-class tenant base; expect higher turnover. Watch: schools D, cost of living D, crime F.
- Oroville Union High (town): math 19% / reading 49% proficiency, ranked #300 of 517 in CA (top 58%) — families likely to look elsewhere, expect single-tenant / working-renter base with shorter leases.
- Market conditions: 372 active listings in the ZIP; 14 comparable units currently listed for rent nearby; rentals leasing fast (median 13d on market — plan ~1-2 weeks tenant-placement turnaround); 946 units permitted in Butte County in 2024 (254 in 5+ unit buildings).
Forward outlook
- Local home prices are declining (-3.0%/yr); year-one equity from $346 of loan paydown is wiped out by about $2k of value loss. Plan a longer hold.
- Butte County population projected at +10% by 2050 — modest demand growth; plan on rents tracking national, not racing it.
- At projected returns (-3.0% appreciation + 3.0% rent growth), your $14k cash investment doubles in ~2 years — after that, you're playing with house money.
Negotiation context
- It's been on market 35 days — a 3% lower offer ($48k) is reasonable based on typical stale-listing flexibility.
Questions for the listing agent
- It's been on market 35 days. Have you received any prior offers? Is the seller open to a 3% concession, seller financing, or rate buy-down credit?
- Is there a deadline driving the sale (1031 exchange, divorce, estate, relocation)? That informs how much negotiation room exists.
- Schools are D-rated, which usually means shorter tenancies and higher turnover. Who's the typical renter profile here, and what's been the actual vacancy rate?
- Crime grade is F in this area — have there been break-ins, vandalism, or insurance claims at this property in the last 3 years? What carrier currently insures it and at what premium?
- What's the average days-on-market for RENTAL listings here right now (not sales)? A rising rental-DOM trend means longer vacancies and softer asking-rent achievability than the comps imply.
- What's the recent tenant-quality profile in this submarket — average credit score on applications, eviction rate, late-payment / NSF rate, and stable-employment percentage? A property-management company in the area should have these aggregated.
- How much new for-sale + rental construction is in the pipeline within 1–3 miles? Heavy new supply typically softens prices + rents 12–24 months out; constrained supply supports both.
Investment metrics
- 1% rule
- 2.62% ✓
- Cap rate
- 22.86%
- Cash-on-cash
- 59.16%
- DSCR
- 3.63
- GRM
- 3.2
CMA / ARV
No comps found within radius.
Projected returns pro-forma
-3.0% appreciation · 3.0% rent growth · sell at horizon
- IRR
- 57.8%
- Equity multiple
- 3.56×
- Total profit
- $35,873
- Equity at exit
- $7,454
- IRR
- 62.7%
- Equity multiple
- 7.28×
- Total profit
- $87,915
- Equity at exit
- $4,322
Cash invested: $13,997 (down + closing). Projections, not guarantees.
Landlord ↔ Tenant lean methodology
- Overall (STATE)
- 18 Strongly Tenant-Friendly
- State California
- 18 Strongly Tenant-Friendly · D+13
- County
- — inherits STATE
- City
- — inherits STATE
ZIP-level market 95966
- Active inventory
- 372
- Price-to-rent
- 3.2×
Monthly cashflow live
- Estimated rent
- $1,311 high interval (Pro) →
- Mortgage (P&I)
- −$262
- Tax est. 1.5%
- −$62 /mo · $750/yr
- Insurance
- −$21
- HOA
- −$0
- Vacancy / Maint / Mgmt
- −$275
- Net cashflow
- $690
Break-even live
UW: 25.0% down · 7.5% · 30yr · 1.5% tax · 5.0% vac · 8.0% maint · 8.0% mgmt
Financing live
Cash to close
- Down payment
- $12,498
- Closing costs
- $1,500
- Reserves months
- —
- Total cash needed
- —
Loan-product check · same deal, 3 products live
Conventional
25% down · 7.5% · 30yr
- Down + closing
- —
- Monthly P&I
- —
- Monthly cashflow
- —
- DSCR
- —
- Eligible?
- —
Personal DTI + credit; lowest rate.
DSCR
20% down · 8.5% · 30yr
- Down + closing
- —
- Monthly P&I
- —
- Monthly cashflow
- —
- DSCR
- —
- Eligible?
- —
No personal income docs; deal must DSCR.
Hard money
10% down · 12.0% · 12mo
- Down + closing
- —
- Monthly P&I
- —
- Monthly cashflow
- —
- DSCR
- —
- Eligible?
- —
Short-term bridge; refi at stabilization.
Rent comps 14 comps
| Address | Beds | Baths | Sqft | Rent | $/sqft | DOM | Units | Dist |
|---|---|---|---|---|---|---|---|---|
| 1331 Pomona Ave Unit 4 Oroville, CA | 2.0 | 1.0 | 673 | $1,075 | $1.60 | 13d | 1 | 0.44mi |
| 1469 6th Ave Oroville, CA | 1.0 | 1.0 | 602 | $995 | $1.65 | 13d | 1 | 0.74mi |
| 2737 Gilmore Ln Unit 1 Oroville, CA | 2.0 | 1.0 | 720 | $1,595 | $2.22 | 13d | 1 | 0.76mi |
| 2739 Gilmore Ln Unit 4 Oroville, CA | 2.0 | 1.0 | 720 | $1,595 | $2.22 | 13d | 1 | 0.78mi |
| 501 Pomona Ave Unit 501_5 Oroville, CA | 2.0 | 1.0 | 676 | $1,125 | $1.66 | 13d | 1 | 0.78mi |
| 2741 Gilmore Ln Unit 3 Oroville, CA | 2.0 | 1.0 | 689 | $1,595 | $2.31 | 21d | 1 | 0.80mi |
| 1138 Elma St Apt 4 Oroville, CA | 1.0 | 1.0 | 500 | $975 | $1.95 | 13d | 1 | 0.82mi |
| 650 Bird St Unit 4 Oroville, CA | 1.0 | 1.0 | 510 | $1,150 | $2.25 | 13d | 1 | 0.85mi |
| 11 Hemstalk Ct Oroville, CA | 2.0 | 1.0 | 650 | $1,100 | $1.69 | 13d | 1 | 0.86mi |
| 1558 Bridge St Oroville, CA | 2.0 | 1.0 | 661 | $1,172 | $1.77 | 13d | 1 | 0.90mi |
| 2804 Orange Ave Unit 11 Oroville, CA | 1.0 | 1.0 | 526 | $1,095 | $2.08 | 13d | 1 | 1.01mi |
| 4566 Virginia Ave Unit 4574 Oroville, CA | 2.0 | 1.0 | 549 | $1,095 | $1.99 | 13d | 1 | 1.09mi |
| 1980 Fogg Ave Unit 2 Oroville, CA | 2.0 | 1.0 | 700 | $1,400 | $2.00 | 13d | 1 | 1.22mi |
| 177 Oroview Dr Unit A Oroville, CA | 2.0 | 1.0 | 750 | $1,400 | $1.87 | 13d | 1 | 1.26mi |
Listing history 15 events
-
2026-06-19days on market $49,990 Active 35 DOM
-
2026-06-18days on market $49,990 Active 34 DOM
-
2026-06-17days on market $49,990 Active 33 DOM
-
2026-06-16days on market $49,990 Active 32 DOM
-
2026-06-15days on market $49,990 Active 31 DOM
-
2026-06-14days on market $49,990 Active 29 DOM
-
2026-06-13days on market $49,990 Active 28 DOM
-
2026-06-10days on market $49,990 Active 26 DOM
-
2026-06-09days on market $49,990 Active 25 DOM
-
2026-06-08days on market $49,990 Active 24 DOM
-
2026-06-07days on market $49,990 Active 23 DOM
-
2026-06-02days on market $49,990 Active 18 DOM
-
2026-06-01days on market $49,990 Active 17 DOM
-
2026-05-31days on market $49,990 Active 16 DOM
-
2026-05-30days on market $49,990 Active 15 DOM
ⓘ Source: listings_history table (triggers on properties + properties_extension) + one-shot
backfill from property_details.listing_events for pre-trigger history.
Nearby sold comps map
Loading sold comps map…
Walkable amenities ~0.75 mi
Loading nearby amenities…
Taxation est. · year 1
- Rental income
- $15,730
- − Mortgage interest
- −$2,800
- − Property taxes
- −$750
- − Insurance
- −$250
- − Repairs & maintenance
- −$1,258
- − Management
- −$1,258
- − Depreciation
- −$1,454
- Taxable income
- $7,959
- Est. tax owed @ 24.0%
- −$1,910
- After-tax cash flow
- $6,371/yr
For passive investors: Depreciation is non-cash, so a rental often shows a tax loss while cash-flowing — sheltering income. Rental losses are passive: they offset passive income freely, and up to $25,000/yr can offset ordinary (W-2) income if you actively participate and your MAGI is under $100k (phasing out to $0 by $150k); unused losses carry forward. On sale, claimed depreciation is recaptured at up to 25%, and gains may owe capital-gains tax (a 1031 exchange can defer both). Figures are a year-1 estimate at your 24.0% rate — not tax advice; consult a CPA.
Condition & rehab AI · 12 photos
This Sundown Estates home is in excellent condition with recent updates, making it move-in ready and ideal for both resale and rental.
Value-add opportunities
- Both Painting exterior and interior walls — Enhances curb appeal and interior aesthetics
- Rental Refrigerator — Modernizes kitchen and attracts renters
- Resale Sink — Improves kitchen functionality and appearance
Renovation cost estimate screening
Value-add ROI direction
- Both Painting exterior and interior walls — Enhances curb appeal and interior aesthetics ↑
- Rental Refrigerator — Modernizes kitchen and attracts renters ↑
- Resale Sink — Improves kitchen functionality and appearance ↑
ⓘ Cost ranges are severity-bucket heuristics (US national rule-of-thumb). Get contractor quotes + a written scope before underwriting a rehab budget.
Schools (NCES district)
- District
- Oroville Union High
- NCES district ID
- 0629130
- Math proficiency
- 19% ▼ -2.00%
- Reading proficiency
- 49% ▼ -4.00%
- Median HH income
- $38,085
- Composite
- 28.26/100
- National rank
- #6794
- State rank
- #300 of 517 in CA
Livability — Oroville
- Score
- 50/100
- State rank
- #1136
- US rank
- #25715
Category grades
Schools grade is shown separately in the Schools card above.
Census & demographics
- Census place
- Oroville, CA
- County
- Butte County · 175,030 people
- Metro
- Chico, CA
- Population (ZIP)
- 28,503
- Household income
- $65,586
- Rent vs Own
- Severe rent burden
- 807.0
Population outlook (Butte County) Hauer SSP2
- Today (2025)
- 237,527 people
- By 2030
- 243,804 · +2.6%
- By 2040
- 253,899 · +6.9%
- By 2050
- 262,561 · +10.5%
- By 2075
- 283,709 · +19.4%
- By 2100
- 282,689 · +19.0%
Race, ethnicity, and origin ACS 2023
- Neighborhood character
- Predominantly White (67%)
- Race & ethnicity
- White 67% Hispanic / Latino 18% Two or more races 14% Asian 6% Native American 2% Black 2%
- Hispanic origin (detail)
- Mexican 16%
- Common ancestry
- Lithuanian 3% Slovak 3% Portuguese 2%
- Foreign-born
- 6% · Canada
- Languages at home
- 88% English-only · Spanish 7% Other Asian/Pacific 3% Russian/Polish/Slavic 1%
Political lean MEDSL · Butte
- 2024 margin
- Toss-up / Even · D 46.8% · R 49.9% · Other 3.3%
- 2008→2024 swing
- -5.5pp toward R · 2008: 2.4pp · 2024: -3.1pp
- All cycles
- 2024: R+3.1 2020: D+1.7 2016: R+4.0 2012: R+3.9 2008: D+2.4
Not yet ingested
- Civics
- —
Market trends
- HPI YoY
- ▼ -284.58%
- Current HPI
- 267.1415
- Rent YoY
- —
- Metro
- Chico, CA
- State GDP YoY
- ▲ 3.21%
- F500 in state
- 116
Industry mix (Fortune 500 HQ in CA)
| Industry | F500 HQs | Revenue |
|---|---|---|
| Technology | 27 | $1,492B |
|
||
| Financial Services | 3 | $174B |
|
||
| Retail | 3 | $44B |
|
||
| Insurance | 3 | $26B |
|
||
| Media / Entertainment | 2 | $115B |
|
||
| Pharmaceuticals / Biotech | 2 | $62B |
|
||
Cash-flow waterfall
monthlySold comps — $/sqft
last 12 mo · ≤1 miLoading sold comps…