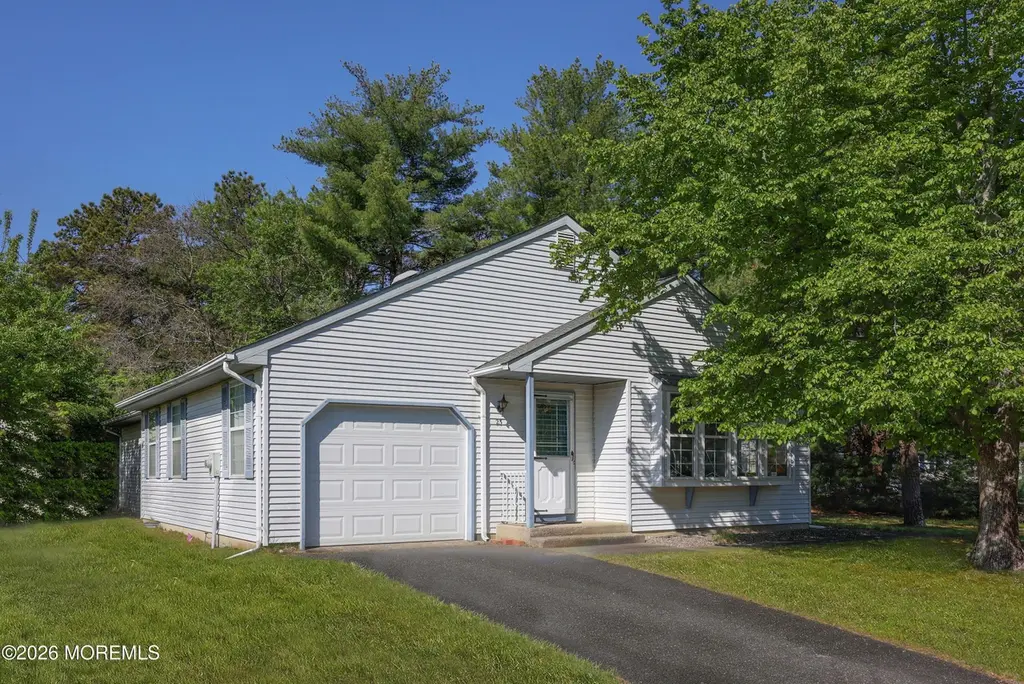
23 Easton Dr #61 · Crestwood Village, NJ
Flood risk 6/10 · Moderate
- FEMA flood zone
- X (unshaded)
- Chance of flooding over 30 yrs
- 0.75%
- Est. flood insurance / yr
- $507 – $1,088
Fire risk 6/10 · Moderate
- Est. fire insurance / yr
- $526 – $976
Heat risk 6/10 · Moderate
- Hot days now (above 103°F)
- 7 days/yr
- Hot days in 30 yrs
- 14 days/yr
Wind risk 6/10 · Moderate
- Chance of severe wind over 30 yrs
- 67.0%
Air-quality risk 3/10 · Minor
- Unhealthy air days now
- 3 days/yr
- Unhealthy air days in 30 yrs
- 4 days/yr
Risk factors via First Street. Map © Google.
Why this score? — see what drove the C- grade
The composite is a weighted blend of 9 inputs, each scored 0–100. Each bar is that input's sub-score; the figure is the points it added to the 100-point composite (weight × sub-score).
- Cash flow +17.0/30.0
- ARV discount +12.3/15.0
- 1% rule +5.6/10.0
- DSCR +5.3/10.0
- Livability +3.2/5.0
- Schools +2.9/10.0
- Rent growth +2.5/5.0
- Condition / age +2.5/5.0
- Appreciation +0.0/10.0
$209,000
🖨 Deal sheet 📄 Offer letter ✓ Due diligence
Listing remarks
Welcome to Crestwood Village Six, an established adult community offering the popular Lynnewood model. This home features two generously sized bedrooms and two full bathrooms, providing a comfortable and functional layout ready for your personal touch. A heated sunroom adds additional living space, perfect for year-round use, while the expansive living and dining area offers a great foundation for entertaining. The eat-in kitchen offers ample space and layout potential to be reimagined into your ideal design. While the home does require updates and renovations, it presents a great opportunity to customize and add value. Residents of Crestwood Village Six enjoy access to a clubhouse with a v
Key facts
- 0.28 acre lot
- Garage
- Built 1982
Property features AI
Finance
- HOA & community: HOA with monthly fee; Monthly association fee of 156.0; HOA covers trash, lawn maintenance, and snow removal; Community amenities include clubhouse and common area; no pool
Exterior
- Parking: Attached 1-car garage
- Utilities: Public sewer
- Home design: Model: Lynnewood; Fee simple ownership
- Construction: Crawl space basement
- Exterior features: Shingle roof
Interior
- Kitchen: Electric cooking; Microwave; Stove; Refrigerator; Dishwasher
- Bedrooms: 2 bedrooms
- Flooring: Vinyl; Ceramic tile
- Bathrooms: 2 full bathrooms
- Heating & cooling: Electric heating; Baseboard heating; Central air conditioning; Electric cooling
- Interior features: Outdoor lighting; Light fixtures; Garage door opener
- Laundry & utility: Washer; Dryer
Neighborhood map
What this means for you Summary
Snapshot
- This is a 2-bed/2.0-bath single-family listed at $209k.
Deal economics
- At list price, monthly cash flow is $143 ($2k/yr) — positive.
- The deal already cash-flows at list — no discount required.
- Meets the 1% rule at list price ($2k rent vs $209k).
- Recommended offer: $206k (1.5% below list) — sets the bar for market timing.
- Cap rate 7.1% vs local median 5.6% in Crestwood Village — meaningfully above typical; check what's discounted (condition, days-on-market, listing class) to confirm the premium yield is real.
Location & tenants
- Location reads 63/100 on livability (#422 in NJ) — a middle-class / working-renter tenant base. Strengths: cost of living A, housing A, health & safety B+; Watch: schools F, amenities F, commute F.
- Manchester Township School District (suburban): math 25% / reading 44% proficiency, ranked #320 of 472 in NJ (top 68%) — families likely to look elsewhere, expect single-tenant / working-renter base with shorter leases.
- Market conditions: 648 active listings in the ZIP; 10 comparable units currently listed for rent nearby; rentals leasing fast (median 10d on market — plan ~1-2 weeks tenant-placement turnaround); 4,434 units permitted in Ocean County in 2024 (868 in 5+ unit buildings).
Forward outlook
- Local home prices are declining (-3.0%/yr); year-one equity from $1k of loan paydown is wiped out by about $6k of value loss. Plan a longer hold.
- Ocean County population projected to shrink 8% by 2050 — rents likely to lag national; underwrite the cash flow, not the appreciation.
Negotiation context
- It's been on market 16 days — a 2% lower offer ($206k) is reasonable based on typical stale-listing flexibility.
- Current owner paid $85k; list at $209k implies a 146% gain — meaningful room to come down on a strong offer.
Risks & watch-outs
- Climate carrying-cost: major flood risk; major wind risk, 67% chance of damaging wind over 30y; major wildfire risk; extreme-heat days projected 7→14/yr by 2055 (HVAC capex compounding) — expect insurance premiums to compound above CPI over the hold.
Questions for the listing agent
- What does the HOA fee cover, when was the last increase, and are there any pending special assessments or reserve-fund shortfalls?
- Is there a deadline driving the sale (1031 exchange, divorce, estate, relocation)? That informs how much negotiation room exists.
- Schools are F-rated, which usually means shorter tenancies and higher turnover. Who's the typical renter profile here, and what's been the actual vacancy rate?
- What's the average days-on-market for RENTAL listings here right now (not sales)? A rising rental-DOM trend means longer vacancies and softer asking-rent achievability than the comps imply.
- What's the recent tenant-quality profile in this submarket — average credit score on applications, eviction rate, late-payment / NSF rate, and stable-employment percentage? A property-management company in the area should have these aggregated.
- How much new for-sale + rental construction is in the pipeline within 1–3 miles? Heavy new supply typically softens prices + rents 12–24 months out; constrained supply supports both.
Investment metrics
- 1% rule
- 1.06% ✓
- Cap rate
- 7.11%
- Cash-on-cash
- 2.93%
- DSCR
- 1.13
- GRM
- 7.9
CMA / ARV
- ARV (median comp)
- $233,757
- List price
- $209,000
- Delta
- -10.59%
- Verdict
- UNDERPRICED
- Comps
- 20 within 1.0 mi
Show comp detail 12 sales within ~0.75 mi
| Address | Dist | Beds/Ba | Sqft | Sold | Price | $/sf | Match |
|---|---|---|---|---|---|---|---|
| 44 Penwood Dr #55 | 0.07mi | 2/2.0 | 1,568 (0%) | 0mo | $339,000 | $216 | 96 |
| 11 Ardmore St | 0.17mi | 2/2.0 | 1,568 (0%) | 6mo | $367,000 | $234 | 87 |
| 14-B Penwood Dr Sec 54a | 0.30mi | 2/2.0 | 1,544 (-2%) | 1mo | $2,929,000 | $1,897 | 82 |
| 2A Easton Ct | 0.26mi | 2/2.0 | 1,544 (-2%) | 4mo | $210,000 | $136 | 82 |
| 44B Sunset Rd #55 | 0.32mi | 2/2.0 | 1,544 (-2%) | 1mo | $215,000 | $139 | 82 |
| 111 Sunset Rd #60 | 0.36mi | 2/2.0 | 1,568 (0%) | 1mo | $325,000 | $207 | 82 |
| 4B Winthrop Pl #55 | 0.29mi | 2/2.0 | 1,544 (-2%) | 4mo | $292,000 | $189 | 80 |
| 14 Penwood Dr Unit A | 0.31mi | 2/2.0 | 1,544 (-2%) | 7mo | $239,000 | $155 | 77 |
| 7-B Drake St Sec 53 | 0.50mi | 2/2.0 | 1,544 (-2%) | 3mo | $220,000 | $142 | 72 |
| 16 Ivy Ct Unit A | 0.45mi | 2/2.0 | 1,544 (-2%) | 7mo | $175,000 | $113 | 70 |
| 48 B Auburn St Unit 54B | 0.25mi | 2/2.0 | 1,392 (-11%) | 6mo | $219,000 | $157 | 65 |
| 3B Drake St #53 | 0.52mi | 2/2.0 | 1,392 (-11%) | 3mo | $210,000 | $151 | 55 |
Match score weights: distance 35% · size 25% · config 20% · recency 20%. Top-matched comps best support the ARV.
Projected returns pro-forma
-3.0% appreciation · 3.0% rent growth · sell at horizon
- IRR
- -11.6%
- Equity multiple
- 0.58×
- Total profit
- $-24,643
- Equity at exit
- $31,163
- IRR
- -2.3%
- Equity multiple
- 0.84×
- Total profit
- $-9,213
- Equity at exit
- $18,071
Cash invested: $58,520 (down + closing). Projections, not guarantees.
Landlord ↔ Tenant lean methodology
- Overall (STATE)
- 21 Tenant-Leaning
- State New Jersey
- 21 Tenant-Leaning · D+6
- County
- — inherits STATE
- City
- — inherits STATE
ZIP-level market 08759
- Active inventory
- 648
- Price-to-rent
- 7.9×
Monthly cashflow live
- Estimated rent
- $2,214 high interval (Pro) →
- Mortgage (P&I)
- −$1,096
- Tax from tax record
- −$267 /mo · $3,204/yr
- Insurance
- −$87
- HOA
- −$156
- Vacancy / Maint / Mgmt
- −$465
- Net cashflow
- $143
Break-even live
UW: 25.0% down · 7.5% · 30yr · 1.5% tax · 5.0% vac · 8.0% maint · 8.0% mgmt
Financing live
Cash to close
- Down payment
- $52,250
- Closing costs
- $6,270
- Reserves months
- —
- Total cash needed
- —
Loan-product check · same deal, 3 products live
Conventional
25% down · 7.5% · 30yr
- Down + closing
- —
- Monthly P&I
- —
- Monthly cashflow
- —
- DSCR
- —
- Eligible?
- —
Personal DTI + credit; lowest rate.
DSCR
20% down · 8.5% · 30yr
- Down + closing
- —
- Monthly P&I
- —
- Monthly cashflow
- —
- DSCR
- —
- Eligible?
- —
No personal income docs; deal must DSCR.
Hard money
10% down · 12.0% · 12mo
- Down + closing
- —
- Monthly P&I
- —
- Monthly cashflow
- —
- DSCR
- —
- Eligible?
- —
Short-term bridge; refi at stabilization.
Rent comps 10 comps
| Address | Beds | Baths | Sqft | Rent | $/sqft | DOM | Units | Dist |
|---|---|---|---|---|---|---|---|---|
| 9B Portsmouth St Unit 54B Whiting, NJ | 2.0 | 2.0 | 1544 | $2,350 | $1.52 | 20d | 1 | 0.28mi |
| 9B Portsmouth St Unit 54B Whiting, NJ | 2.0 | 2.0 | 1544 | $2,400 | $1.55 | 1d | 1 | 0.28mi |
| 16B Ivy Ct Unit A Manchester Township, NJ | 2.0 | 2.0 | 1544 | $2,400 | $1.55 | 1d | 1 | 0.41mi |
| 19B Maplewood Dr #52 Whiting, NJ | 2.0 | 1.5 | 1109 | $2,250 | $2.03 | 16d | 1 | 0.65mi |
| 1 Morning Glory Ln Whiting, NJ | 2.0 | 2.5 | 1312 | $1,200 | $0.91 | 3d | 1 | 1.29mi |
| 24 Partridge Pl Manchester Township, NJ | 3.0 | 2.0 | 1248 | $1,780 | $1.43 | 12d | 1 | 1.30mi |
| — Manchester Township, NJ | 2.0 | 2.0 | 1141 | $1,700 | $1.49 | 10d | 1 | 1.34mi |
| 7 Teal Ct Whiting, NJ | 2.0 | 2.0 | 1056 | $1,600 | $1.52 | 3d | 1 | 1.46mi |
| 49 Westport Dr #71 Whiting, NJ | 2.0 | 1.5 | 1192 | $1,995 | $1.67 | 43d | 1 | 1.47mi |
| 50 Westport Dr #71 Whiting, NJ | 2.0 | 1.0 | 1120 | $2,200 | $1.96 | 1d | 1 | 1.49mi |
HOA detail
- Monthly dues
- $156 · $1,872/yr
Listing history 3 events
-
2026-05-06$209,000 Active 799-char remark
-
1996-08-28soldstatus $85,000
-
1982-09-01soldstatus $66,955
ⓘ Source: listings_history table (triggers on properties + properties_extension) + one-shot
backfill from property_details.listing_events for pre-trigger history.
Tax reassessment forecast NJ · Partial reset (capped growth)
- Current annual tax
- $3,204 · $267/mo
- Projected year-2 tax
- $4,204 · $350/mo
- Expected delta
- +$1,000/yr (+$83/mo · 31.2%)
ⓘ Screening estimate from a state-policy table — verify with the county assessor before closing.
Climate risk First Street
- Flood 6/10 Major FEMA zone X (unshaded) · 75% chance over 30 yrs
- Wildfire 6/10 Major
- Heat 6/10 Major 7 d/yr ≥103°F today · 14 d/yr by 30 yrs out
- Wind 6/10 Major 67% chance of damaging wind over 30 yrs
- Air quality 3/10 Moderate 3 unhealthy d/yr today · 4 by 30 yrs out
Nearby sold comps map
Loading sold comps map…
Walkable amenities ~0.75 mi
Loading nearby amenities…
Taxation est. · year 1
- Rental income
- $26,565
- − Mortgage interest
- −$11,707
- − Property taxes
- −$3,204
- − Insurance
- −$1,045
- − Repairs & maintenance
- −$2,125
- − Management
- −$2,125
- − HOA
- −$1,872
- − Depreciation
- −$6,080
- Taxable loss
- −$1,594
- Est. tax savings @ 24.0%
- +$383
- After-tax cash flow
- $2,095/yr
For passive investors: Depreciation is non-cash, so a rental often shows a tax loss while cash-flowing — sheltering income. Rental losses are passive: they offset passive income freely, and up to $25,000/yr can offset ordinary (W-2) income if you actively participate and your MAGI is under $100k (phasing out to $0 by $150k); unused losses carry forward. On sale, claimed depreciation is recaptured at up to 25%, and gains may owe capital-gains tax (a 1031 exchange can defer both). Figures are a year-1 estimate at your 24.0% rate — not tax advice; consult a CPA.
Schools (NCES district)
- District
- Manchester Township School District
- NCES district ID
- 3409450
- Math proficiency
- 25% ▼ -17.00%
- Reading proficiency
- 44% ▼ -5.00%
- Median HH income
- $38,905
- Composite
- 28.8/100
- National rank
- #6662
- State rank
- #320 of 472 in NJ
Livability — Crestwood Village
- Score
- 63/100
- State rank
- #422
- US rank
- #15006
Category grades
Schools grade is shown separately in the Schools card above.
Census & demographics
- Census place
- Crestwood Village, NJ
- City population
- 34,290
- Population (ZIP)
- 34,290
Population outlook (Ocean County) Hauer SSP2
- Today (2025)
- 586,991 people
- By 2030
- 581,403 · -1.0%
- By 2040
- 564,913 · -3.8%
- By 2050
- 538,149 · -8.3%
- By 2075
- 468,845 · -20.1%
- By 2100
- 350,297 · -40.3%
Race, ethnicity, and origin ACS 2023
- Neighborhood character
- Predominantly White (87%)
- Race & ethnicity
- White 87% Hispanic / Latino 5% Black 4% Two or more races 4% Asian 2%
- Hispanic origin (detail)
- Puerto Rican 2%
- Common ancestry
- Romanian 8% Scotch-Irish 2% Lithuanian 2%
- Foreign-born
- 11% · Canada, China
- Languages at home
- 88% English-only · Spanish 3% Russian/Polish/Slavic 2% Other Indo-European 2%
Political lean MEDSL · Ocean
- 2024 margin
- Solid R (+36.0) · D 31.4% · R 67.4% · Other 1.2%
- 2008→2024 swing
- -17.6pp toward R · 2008: -18.4pp · 2024: -36.0pp
- All cycles
- 2024: R+36.0 2020: R+28.7 2016: R+34.0 2012: R+17.7 2008: R+18.4
Not yet ingested
- Civics
- —
Market trends
- HPI YoY
- ▼ -347.85%
- Current HPI
- 274.4679
- Rent YoY
- —
- Metro
- —
- State GDP YoY
- ▲ 2.05%
- F500 in state
- 34
Industry mix (Fortune 500 HQ in NJ)
| Industry | F500 HQs | Revenue |
|---|---|---|
| Consumer Goods | 3 | $31B |
|
||
| Pharmaceuticals | 2 | $153B |
|
||
| Technology | 2 | $21B |
|
||
| Insurance | 2 | $20B |
|
||
| Healthcare | 2 | $19B |
|
||
| Financial Services | 1 | $70B |
|
||
Price history
+212.1% since first listed4 events — show timeline
- 2026-05-22 Pending — MOMLS
- 2026-05-06 Listed $209,000 MOMLS
- 1996-08-28 Sold (Public Records) $85,000 Public Records
- 1982-09-01 Sold (Public Records) $66,955 Public Records
Property tax history
+2.7%/yrLatest (2025): $3,204 · -5.4% YoY. Source: county tax records.
Cash-flow waterfall
monthlySold comps — $/sqft
last 12 mo · ≤1 miLoading sold comps…