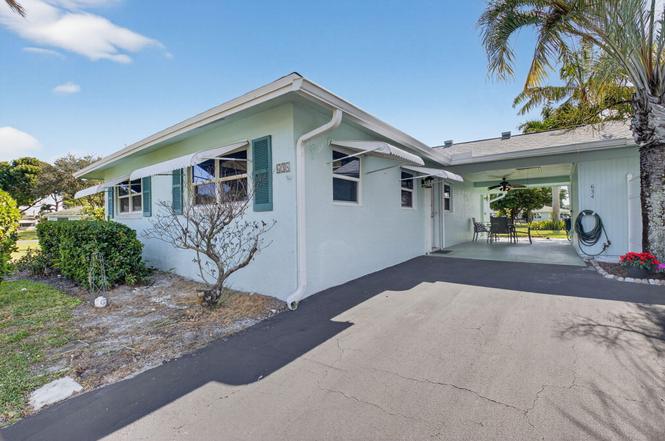
634 Hummingbird Ln · Delray Beach, FL
Flood risk 4/10 · Minor
- FEMA flood zone
- X (unshaded)
- Chance of flooding over 30 yrs
- 0.22%
- Est. flood insurance / yr
- $507 – $1,088
Fire risk 1/10 · Minimal
- Est. fire insurance / yr
- $947 – $1,759
Heat risk 9/10 · Severe
- Hot days now (above 106°F)
- 7 days/yr
- Hot days in 30 yrs
- 26 days/yr
Wind risk 10/10 · Severe
- Chance of severe wind over 30 yrs
- 99.0%
Air-quality risk 2/10 · Minimal
- Unhealthy air days now
- 1 days/yr
- Unhealthy air days in 30 yrs
- 2 days/yr
Risk factors via First Street. Map © Google.
Why this score? — see what drove the C- grade
The composite is a weighted blend of 9 inputs, each scored 0–100. Each bar is that input's sub-score; the figure is the points it added to the 100-point composite (weight × sub-score).
- Cash flow +19.7/30.0
- ARV discount +7.5/15.0
- 1% rule +6.9/10.0
- DSCR +6.2/10.0
- Schools +4.3/10.0
- Livability +3.9/5.0
- Rent growth +3.0/5.0
- Condition / age +2.5/5.0
- Appreciation +0.0/10.0
$240,000
🖨 Deal sheet (PDF) 📄 Offer letter ✓ Due diligence
Listing remarks
LOVELY COUNTRY MANORS! PEACEFUL COMMUNITY LOCATED IN THE HEART OF DELRAY BEACH OFF LAKE IDA, MINUTES TO BEAUTIFUL BEACHES AND ALL THE FUN OF THE AVENUE! THIS WONDERFUL ONE STORY VILLA HAS BEEN ENLARGED AND EXPANDED OFFING THE LARGEST AND MOST SPACIOUS LAYOUT, THIS HOME IS SITUATED ON THE PERFECT LOT WITH NO BACKYARD NEIGHBORS ENSURING PRIVACY, THE KITCHEN HAS ALSO RENNOVATED, EXPANDED AND ENLARGED AND OFFERS BEAUTIFUL REAL WOOD LIGHT HICKORY CABINETS, THIS HOME PROVIDES SAFTEY AND SECURITY WITH A BRAND NEW ROOF AND IMPACT WINDOWS AND DOOR, THE HOMES CLAMSHELL SUTTERS ARE FULLY OPERATIONAL ADDING AN EXTRA LAYER OF PROTECTION FOR YOUR HOME AND BEAUTIFUL NEW WINDOWS, IT'S TIME TO RELAX AND E
Key facts
- Brand new roof
- Clamshell shutters
- Renovated kitchen
Tags
Property features AI
Finance
- Financial info: Part of a community of approximately 440 units; No pets allowed (per community rules)
- HOA & community: Community association with monthly fee; HOA dues include cable TV, water, common area maintenance, common area taxes, and maintenance of grounds; Association amenities: clubhouse, pool, billiard room, shuffleboard court; Monthly association fee
Exterior
- Parking: Attached carport (covered); 1 carport space; 2 open parking spaces
- Utilities: Public water; Public sewer; Cable available; Underground utilities; Water available; Sewer available
- Home design: Villa; Single-story (1 story); Multi/split levels; Resale property; Faces east
- Construction: Built with concrete block (CBS); Composition/shingle roof
- Exterior features: Covered patio; Patio
Interior
- Kitchen: Disposal; Dishwasher; Electric range; Refrigerator
- Bedrooms: 2 bedrooms on the main level
- Flooring: Carpet; Ceramic tile
- Bathrooms: 2 full bathrooms on the main level
- Heating & cooling: Central electric heating; Central air conditioning; Ceiling fans
- Interior features: Walk-in closets; Pull-down attic stairs; Partially furnished; Blinds on windows
- Laundry & utility: Inside laundry in a laundry closet
Neighborhood map
What this means for you Summary
Snapshot
- This is a 2-bed/2.0-bath condo listed at $240k.
Deal economics
- At list price, monthly cash flow is $281 ($3k/yr) — positive.
- The deal already cash-flows at list — no discount required.
- Meets the 1% rule at list price ($3k rent vs $240k).
- Recommended offer: $211k (12.0% below list) — sets the bar for market timing.
- Cap rate 7.7% vs local median 4.3% in Delray Beach — top-decile yield for the area; either an underpriced asset or a hidden risk that comps aren't pricing in. Stress-test before assuming the spread holds.
Location & tenants
- Location reads 77/100 on livability (#202 in FL, #3,160 nationally) — a middle-class / working-renter tenant base. Strengths: housing A+, health & safety A+, commute A-; Watch: cost of living C-, crime D-, amenities F.
- Palm Beach (suburban): math 46% / reading 53% proficiency, ranked #34 of 73 in FL (top 47%) — families likely to look elsewhere, expect single-tenant / working-renter base with shorter leases.
- Zoned schools: Banyan Creek Elementary School (math 62% / reading 64%, grade B, #582 of 2,144 statewide, top 28%, 844 students, 51% FRL); Carver Middle School (math 22% / reading 34%, grade F, #486 of 571 statewide, top 86%, 732 students, 73% FRL); Atlantic High School (math 28% / reading 52%, grade F, #296 of 667 statewide, top 45%, 1,889 students, 59% FRL).
- Market conditions: Rents rising (+1.8%/yr); 359 active listings in the ZIP; 40 comparable units currently listed for rent nearby; rentals at typical pace (median 26d on market — plan ~3-4 weeks tenant-placement turnaround); solid renter incomes; 3,974 units permitted in Palm Beach County in 2024 (1,012 in 5+ unit buildings).
- This rent runs 44% of the median local income ($78k/yr) — at the standard rent-burdened threshold; future hikes will face affordability resistance.
Forward outlook
- Local home prices are declining (-3.0%/yr); year-one equity from $2k of loan paydown is wiped out by about $7k of value loss. Plan a longer hold.
- Palm Beach County population projected at +30% by 2050 — long-run rental-demand tailwind backs the buy-and-hold thesis.
Negotiation context
- It's been on market 217 days — a 12% lower offer ($211k) is reasonable based on typical stale-listing flexibility.
- 2 sale attempts; this cycle's ask has dropped $20k (8%) from the opening price — seller is motivated, your offer sets the floor, not the list.
- Current owner paid $42k; list at $240k implies a 471% gain — meaningful room to come down on a strong offer.
Risks & watch-outs
- Climate carrying-cost: severe wind risk, 99% chance of damaging wind over 30y; extreme-heat days projected 7→26/yr by 2055 (HVAC capex compounding) — expect insurance premiums to compound above CPI over the hold.
Questions for the listing agent
- It's been on market 217 days. Have you received any prior offers? Is the seller open to a 12% concession, seller financing, or rate buy-down credit?
- Built in 1975 — when were the roof, HVAC, electrical panel, plumbing, and water heater last replaced?
- What does the HOA fee cover, when was the last increase, and are there any pending special assessments or reserve-fund shortfalls?
- Any open or pending special assessments — roof, HVAC, plumbing, elevator, façade? What's the per-unit balance and payoff schedule, and is the seller paying it off at close or rolling it to the buyer?
- Why hasn't it sold? Are there any deal-killer items the seller is aware of (foundation, flood, title, zoning, code violations)?
- Is there a deadline driving the sale (1031 exchange, divorce, estate, relocation)? That informs how much negotiation room exists.
- Schools are B-rated — typically a magnet for longer-tenancy family renters. What's the average tenant stay here, and is there a school-zone premium baked into asking?
- Crime grade is D in this area — have there been break-ins, vandalism, or insurance claims at this property in the last 3 years? What carrier currently insures it and at what premium?
- What's the average days-on-market for RENTAL listings here right now (not sales)? A rising rental-DOM trend means longer vacancies and softer asking-rent achievability than the comps imply.
- What's the recent tenant-quality profile in this submarket — average credit score on applications, eviction rate, late-payment / NSF rate, and stable-employment percentage? A property-management company in the area should have these aggregated.
- How much new apartment / multifamily construction is in the pipeline within 1–3 miles? Heavy new supply (>2% of stock underway) typically softens rents 12–24 months out; light construction supports rent growth.
Investment metrics
- 1% rule
- 1.19% ✓
- Cap rate
- 7.70%
- Cash-on-cash
- 5.02%
- DSCR
- 1.22
- GRM
- 7.0
CMA / ARV
No comps found within radius.
Projected returns pro-forma
-3.0% appreciation · 1.83% rent growth · sell at horizon
- IRR
- -9.9%
- Equity multiple
- 0.64×
- Total profit
- $-24,060
- Equity at exit
- $35,785
- IRR
- -2.4%
- Equity multiple
- 0.85×
- Total profit
- $-10,233
- Equity at exit
- $20,751
Cash invested: $67,200 (down + closing). Projections, not guarantees.
Landlord ↔ Tenant lean methodology
- Overall (STATE)
- 87 Strongly Landlord-Friendly
- State Florida
- 87 Strongly Landlord-Friendly · R+3
- County
- — inherits STATE
- City
- — inherits STATE
ZIP-level market 33445
- Rents YoY
- 1.8%
- Active inventory
- 359
- Price-to-rent
- 7.0×
Monthly cashflow live
- Estimated rent
- $2,854 high interval (Pro) →
- Mortgage (P&I)
- −$1,259
- Tax from tax record
- −$289 /mo · $3,466/yr
- Insurance
- −$100
- HOA
- −$326
- Vacancy / Maint / Mgmt
- −$599
- Net cashflow
- $281
Break-even live
Sensitivity live
| Price | -10% $417 | -5% $349 | +0% $281 | +5% $213 | +10% $145 |
|---|---|---|---|---|---|
| Rent | -10% $56 | -5% $169 | +0% $281 | +5% $394 | +10% $507 |
| Rate | -1.0pp $402 | -0.5pp $342 | base $281 | +0.5pp $219 | +1.0pp $156 |
UW: 25.0% down · 7.5% · 30yr · 1.5% tax · 5.0% vac · 8.0% maint · 8.0% mgmt
Financing live
Cash to close
- Down payment
- $60,000
- Closing costs
- $7,200
- Reserves months
- —
- Total cash needed
- —
Loan-product check · same deal, 3 products live
Conventional
25% down · 7.5% · 30yr
- Down + closing
- —
- Monthly P&I
- —
- Monthly cashflow
- —
- DSCR
- —
- Eligible?
- —
Personal DTI + credit; lowest rate.
DSCR
20% down · 8.5% · 30yr
- Down + closing
- —
- Monthly P&I
- —
- Monthly cashflow
- —
- DSCR
- —
- Eligible?
- —
No personal income docs; deal must DSCR.
Hard money
10% down · 12.0% · 12mo
- Down + closing
- —
- Monthly P&I
- —
- Monthly cashflow
- —
- DSCR
- —
- Eligible?
- —
Short-term bridge; refi at stabilization.
Rent comps 40 comps
| Address | Beds | Baths | Sqft | Rent | $/sqft | DOM | Units | Dist |
|---|---|---|---|---|---|---|---|---|
| 1418 W Wickham Cir Unit B Delray Beach, FL | 3.0 | 2.5 | 1316 | $3,200 | $2.43 | 19d | 1 | 0.12mi |
| 4809 N Wickham Cir Unit A Delray Beach, FL | 2.0 | 2.0 | 1028 | $2,600 | $2.53 | 26d | 1 | 0.16mi |
| 5093 Privet Pl Unit A-1 Delray Beach, FL | 2.0 | 2.0 | 1220 | $2,350 | $1.93 | 26d | 1 | 0.21mi |
| 13419 Noble Dr Delray Beach, FL | 2.0 | 2.0 | 1410 | $3,600 | $2.55 | 19d | 1 | 0.25mi |
| 5260 Grande Palm Cir Delray Beach, FL | 3.0 | 2.0 | 1464 | $2,800 | $1.91 | 26d | 1 | 0.34mi |
| 5200 Privet Pl Unit C Delray Beach, FL | 2.0 | 2.0 | 1457 | $1,850 | $1.27 | 26d | 1 | 0.34mi |
| 13487 Barwick Rd Unit B Delray Beach, FL | 2.0 | 1.5 | 1092 | $3,600 | $3.30 | 1d | 1 | 0.38mi |
| 5061 Nesting Way Unit D Delray Beach, FL | 2.0 | 2.0 | 1255 | $2,400 | $1.91 | 26d | 1 | 0.50mi |
| 4477 NW 3rd Dr Delray Beach, FL | 2.0 | 1.5 | 1109 | $2,550 | $2.30 | 26d | 1 | 0.51mi |
| 4311 N Magnolia Cir Delray Beach, FL | 3.0 | 2.0 | 1705 | $3,100 | $1.82 | 26d | 1 | 0.53mi |
| 13255 Royale Sabal Ct Delray Beach, FL | 3.0 | 2.5 | 1618 | $4,300 | $2.66 | 26d | 1 | 0.54mi |
| 1225 E Magnolia Cir Delray Beach, FL | 3.0 | 2.0 | 1705 | $3,700 | $2.17 | 26d | 1 | 0.55mi |
| 5462 Via Delray #123 Delray Beach, FL | 2.0 | 2.0 | 1200 | $2,700 | $2.25 | 22d | 1 | 0.55mi |
| 4574 Danson Way Delray Beach, FL | 3.0 | 2.5 | 1654 | $3,300 | $2.00 | 26d | 1 | 0.55mi |
| 5449 Grande Palm Cir Delray Beach, FL | 3.0 | 2.5 | 1618 | $4,000 | $2.47 | 19d | 1 | 0.57mi |
| 5449 Grande Palm Cir Delray Beach, FL | 3.0 | 2.5 | 1618 | $4,000 | $2.47 | 26d | 1 | 0.57mi |
| 13990 Nesting Way Unit C Delray Beach, FL | 1.0 | 2.0 | 1092 | $2,300 | $2.11 | 26d | 1 | 0.59mi |
| 4110 NW 10th St Delray Beach, FL | 3.0 | 2.5 | 1839 | $4,500 | $2.45 | 26d | 1 | 0.60mi |
| 5265 NW 3rd St Unit C Delray Beach, FL | 1.0 | 1.5 | 1080 | $2,200 | $2.04 | 26d | 1 | 0.62mi |
| 4510 NW 2nd St Unit A Delray Beach, FL | 2.0 | 2.0 | 1080 | $1,800 | $1.67 | 26d | 1 | 0.64mi |
| 4515 NW 3rd Ct Unit C Delray Beach, FL | 1.0 | 2.0 | 1080 | $1,900 | $1.76 | 26d | 1 | 0.66mi |
| 13759 Date Palm Ct Unit A Delray Beach, FL | 2.0 | 2.0 | 1247 | $3,500 | $2.81 | 26d | 1 | 0.67mi |
| 13670 Via Flora Delray Beach, FL | 2.0 | 2.0 | 1021 | $1,400 | $1.37 | 26d | 1 | 0.68mi |
| 13670 Via Flora Delray Beach, FL | 2.0 | 2.0 | 1021 | $1,400 | $1.37 | 17d | 1 | 0.68mi |
| 14040 Nesting Way Unit B Delray Beach, FL | 1.0 | 2.0 | 1092 | $1,700 | $1.56 | 26d | 1 | 0.69mi |
| 13682 Via Flora Unit H Delray Beach, FL | 2.0 | 2.0 | 1097 | $1,900 | $1.73 | 26d | 1 | 0.69mi |
| 3996 NW 7th Ct Delray Beach, FL | 3.0 | 2.0 | 1480 | $5,000 | $3.38 | 26d | 1 | 0.70mi |
| 4310 Village Dr Unit D Delray Beach, FL | 3.0 | 3.0 | 1326 | $2,600 | $1.96 | 26d | 1 | 0.71mi |
| 945 Sunflower Ave Delray Beach, FL | 3.0 | 2.0 | 1755 | $4,500 | $2.56 | 9d | 1 | 0.73mi |
| 5033 S La Sedona Cir Delray Beach, FL | 3.0 | 2.0 | 1594 | $3,500 | $2.20 | 26d | 1 | 0.73mi |
| 13653 Jubilee Ln Delray Beach, FL | 3.0 | 2.0 | 1305 | $3,450 | $2.64 | 15d | 1 | 0.75mi |
| 13721 Flora Pl Unit D Delray Beach, FL | 2.0 | 2.0 | 1097 | $1,900 | $1.73 | 7d | 1 | 0.75mi |
| 13721 Flora Pl Unit D Delray Beach, FL | 2.0 | 2.0 | 1097 | $1,850 | $1.69 | 26d | 1 | 0.75mi |
| 13817 Royal Palm Ct Unit B Delray Beach, FL | 2.0 | 2.0 | 1205 | $3,200 | $2.66 | 26d | 1 | 0.77mi |
| 5655 Via Delray Delray Beach, FL | 2.0 | 2.0 | 1205 | $2,200 | $1.83 | 26d | 1 | 0.77mi |
| 13431 Amber Waves Ave Delray Beach, FL | 2.0 | 2.0 | 1390 | $3,500 | $2.52 | 26d | 1 | 0.77mi |
| 13741 Flora Pl Unit B Delray Beach, FL | 2.0 | 2.0 | 989 | $2,100 | $2.12 | 23d | 1 | 0.78mi |
| 14139 Nesting Way Unit A Delray Beach, FL | 2.0 | 2.0 | 1255 | $2,000 | $1.59 | 0d | 1 | 0.78mi |
| 13731 Flora Pl Unit A Delray Beach, FL | 2.0 | 2.0 | 1097 | $1,850 | $1.69 | 26d | 1 | 0.79mi |
| 13921 Royal Palm Ct Unit D Delray Beach, FL | 2.0 | 2.0 | 1205 | $4,000 | $3.32 | 9d | 1 | 0.81mi |
HOA detail condo
- Monthly dues
- $326 · $3,912/yr
- Likely covers
- security
- Assessments
- None detected in remarks — confirm with the listing agent.
Listing history 19 events
-
2026-06-21days on market $240,000 Active 217 DOM
-
2026-06-18days on market $240,000 Active 214 DOM
-
2026-06-17days on market $240,000 Active 213 DOM
-
2026-06-16days on market $240,000 Active 212 DOM
-
2026-06-15days on market $240,000 Active 211 DOM
-
2026-06-13days on market $240,000 Active 209 DOM
-
2026-06-09days on market $240,000 Active 205 DOM
-
2026-06-07days on market $240,000 Active 203 DOM
-
2026-06-04days on market $240,000 Active 200 DOM
-
2026-06-03days on market $240,000 Active 199 DOM
-
2026-06-01days on market $240,000 Active 197 DOM
-
2026-05-31days on market $240,000 Active 196 DOM
-
2026-05-05price $240,000
-
2026-02-13price $250,000
-
2025-11-15$260,000 Active
-
2025-11-05historical
-
2025-09-05price $270,000
-
2025-04-05$298,000 Active
-
1996-02-29soldstatus $42,000
ⓘ Source: listings_history table (triggers on properties + properties_extension) + one-shot
backfill from property_details.listing_events for pre-trigger history.
Tax reassessment forecast FL · Resets to sale price
- Current annual tax
- $3,466 · $289/mo
- Projected year-2 tax
- $3,466 · $289/mo
- Expected delta
- $0/yr ($0/mo · 0.0%)
ⓘ Screening estimate from a state-policy table — verify with the county assessor before closing.
Climate risk First Street
- Flood 4/10 Moderate FEMA zone X (unshaded) · 22% chance over 30 yrs
- Wildfire 1/10 Low
- Heat 9/10 Extreme 7 d/yr ≥106°F today · 26 d/yr by 30 yrs out
- Wind 10/10 Extreme 99% chance of damaging wind over 30 yrs
- Air quality 2/10 Low 1 unhealthy d/yr today · 2 by 30 yrs out
Nearby sold comps map
Loading sold comps map…
Walkable amenities ~0.75 mi
Loading nearby amenities…
Taxation est. · year 1
- Rental income
- $34,249
- − Mortgage interest
- −$13,444
- − Property taxes
- −$3,466
- − Insurance
- −$1,200
- − Repairs & maintenance
- −$2,740
- − Management
- −$2,740
- − HOA
- −$3,912
- − Depreciation
- −$6,982
- Taxable loss
- −$235
- Est. tax savings @ 24.0%
- +$56
- After-tax cash flow
- $3,432/yr
For passive investors: Depreciation is non-cash, so a rental often shows a tax loss while cash-flowing — sheltering income. Rental losses are passive: they offset passive income freely, and up to $25,000/yr can offset ordinary (W-2) income if you actively participate and your MAGI is under $100k (phasing out to $0 by $150k); unused losses carry forward. On sale, claimed depreciation is recaptured at up to 25%, and gains may owe capital-gains tax (a 1031 exchange can defer both). Figures are a year-1 estimate at your 24.0% rate — not tax advice; consult a CPA.
Schools (NCES district)
- District
- Palm Beach
- NCES district ID
- 1201500
- Math proficiency
- 46% ▼ -16.00%
- Reading proficiency
- 53% ▼ -4.00%
- Median HH income
- $53,943
- Composite
- 42.72/100
- National rank
- #3160
- State rank
- #34 of 73 in FL
Livability — Delray Beach
- Score
- 77/100
- State rank
- #202
- US rank
- #3160
Category grades
Schools grade is shown separately in the Schools card above.
Census & demographics
- Census place
- Delray Beach, FL
- County
- Palm Beach County · 1,438,312 people
- City population
- 123,167
- Metro
- Miami-Fort Lauderdale-Pompano Beach, FL
- Population (ZIP)
- 33,122
- Household income
- $78,163
- Rent vs Own
- Severe rent burden
- 1649.0
Population outlook (Palm Beach County) Hauer SSP2
- Today (2025)
- 1,637,487 people
- By 2030
- 1,743,255 · +6.5%
- By 2040
- 1,948,712 · +19.0%
- By 2050
- 2,132,979 · +30.3%
- By 2075
- 2,530,027 · +54.5%
- By 2100
- 2,706,979 · +65.3%
Race, ethnicity, and origin ACS 2023
- Neighborhood character
- Diverse neighborhood (Simpson 0.62)
- Race & ethnicity
- White 55% Black 24% Hispanic / Latino 11% Two or more races 11% Asian 4%
- Hispanic origin (detail)
- Puerto Rican 3% Cuban 2%
- Common ancestry
- Hispanic 14% Romanian 3% Scotch-Irish 3%
- Foreign-born
- 27% · Canada, Jamaica, Dominican Republic
- Languages at home
- 66% English-only · French/Haitian/Cajun 18% Spanish 9% Other Indo-European 4%
Political lean MEDSL · Palm Beach
- 2024 margin
- Toss-up / Even · D 50.0% · R 49.2%
- 2008→2024 swing
- -22.1pp toward R · 2008: 22.9pp · 2024: 0.8pp
- All cycles
- 2024: D+0.8 2020: D+12.8 2016: D+15.3 2012: D+17.0 2008: D+22.9
Not yet ingested
- Civics
- —
Market trends
- HPI YoY
- ▼ -258.16%
- Current HPI
- 349.5505
- Rent YoY
- ▲ 1.83%
- Metro
- Miami-Fort Lauderdale-Pompano Beach, FL
- State GDP YoY
- ▲ 3.28%
- F500 in state
- 36
Industry mix (Fortune 500 HQ in FL)
| Industry | F500 HQs | Revenue |
|---|---|---|
| Industrial Technology | 2 | $29B |
|
||
| Insurance | 2 | $17B |
|
||
| Retail | 1 | $60B |
|
||
| Technology Distribution | 1 | $58B |
|
||
| Homebuilding | 1 | $35B |
|
||
| Technology Manufacturing | 1 | $35B |
|
||
Price history
+471.4% since first listed7 events — show timeline
- 2026-05-05 Price Changed $240,000 Beaches MLS
- 2026-02-13 Price Changed $250,000 Beaches MLS
- 2025-11-15 Listed $260,000 Beaches MLS
- 2025-11-05 Listing Removed — Beaches MLS
- 2025-09-05 Price Changed $270,000 Beaches MLS
- 2025-04-05 Listed $298,000 Beaches MLS
- 1996-02-29 Sold (Public Records) $42,000 Public Records
Property tax history
+12.5%/yrLatest (2025): $3,466 · +355.6% YoY. Source: county tax records.
Cash-flow waterfall
monthlySold comps — $/sqft
last 12 mo · ≤1 miLoading sold comps…