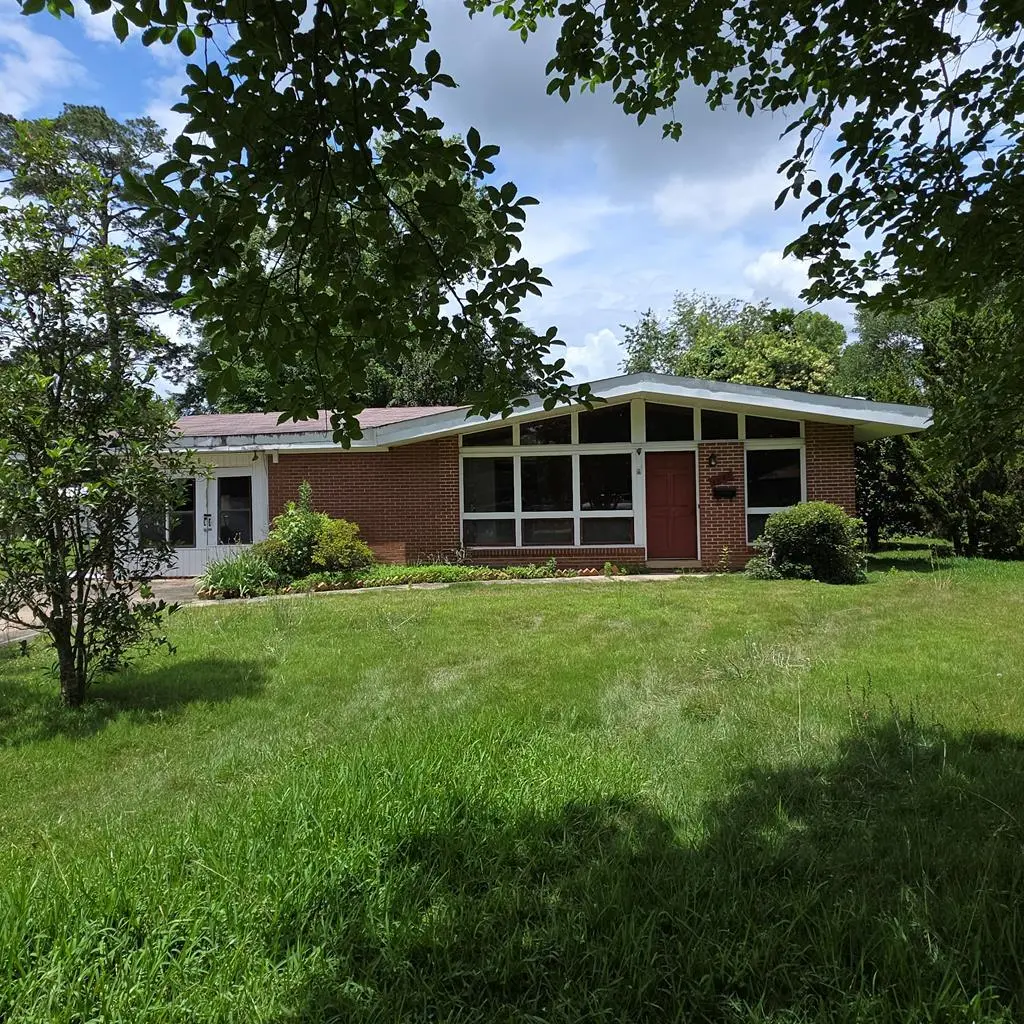
3023 Colonial Dr · Columbus, GA
Flood risk 3/10 · Minor
- FEMA flood zone
- X (unshaded)
- Chance of flooding over 30 yrs
- 0.2%
- Est. flood insurance / yr
- $507 – $1,088
Fire risk 3/10 · Minor
- Est. fire insurance / yr
- $963 – $1,789
Heat risk 7/10 · Major
- Hot days now (above 107°F)
- 7 days/yr
- Hot days in 30 yrs
- 19 days/yr
Wind risk 7/10 · Major
- Chance of severe wind over 30 yrs
- 78.0%
Air-quality risk 4/10 · Minor
- Unhealthy air days now
- 4 days/yr
- Unhealthy air days in 30 yrs
- 5 days/yr
Risk factors via First Street. Map © Google.
Why this score? — see what drove the B- grade
The composite is a weighted blend of 9 inputs, each scored 0–100. Each bar is that input's sub-score; the figure is the points it added to the 100-point composite (weight × sub-score).
- Cash flow +30.0/30.0
- 1% rule +10.0/10.0
- DSCR +10.0/10.0
- ARV discount +7.5/15.0
- Livability +3.2/5.0
- Rent growth +3.0/5.0
- Condition / age +2.5/5.0
- Schools +2.2/10.0
- Appreciation +0.0/10.0
$70,000
🖨 Deal sheet 📄 Offer letter ✓ Due diligence
Listing remarks
Opportunity awaits with this 3-bedroom, 1-bath home full of potential! Whether you're looking for your next home, an investment property, or your next renovation project, this property offers endless possibilities. Inside, you'll find spacious living areas featuring large windows that fill the dining and living room spaces with natural light. Vaulted ceilings add character and an open feel, while the den with fireplace creates a cozy space to relax and gather. With great bones and plenty of charm, this home is ready for your personal touch and vision. Conveniently located and packed with potential, this is an opportunity you won't want to miss! Schedule your showing today.
Key facts
- Large windows
- Vaulted ceilings
- Den with fireplace
Tags
Property features AI
Exterior
- Utilities: Public water; Public sewer
- Home design: Single-family residential
- Construction: Brick and vinyl siding construction
- Exterior features: Fenced yard; Level lot
Interior
- Bathrooms: 1 full bathroom
- Heating & cooling: Electric heating
- Interior features: Fireplace (1)
- Laundry & utility: Laundry room
Neighborhood map
What this means for you Summary
Snapshot
- This is a 3-bed/2.0-bath single-family listed at $70k.
Deal economics
- At list price, monthly cash flow is $414 ($5k/yr) — positive.
- The deal already cash-flows at list — no discount required.
- Meets the 1% rule at list price ($1k rent vs $70k).
- Cap rate 13.4% vs local median 4.7% in Columbus — top-decile yield for the area; either an underpriced asset or a hidden risk that comps aren't pricing in. Stress-test before assuming the spread holds.
Location & tenants
- Location reads 64/100 on livability (#254 in GA) — a middle-class / working-renter tenant base. Strengths: cost of living A+, housing A+, health & safety B; Watch: amenities D+, schools F, crime F.
- Muscogee County (urban): math 21% / reading 30% proficiency, ranked #120 of 174 in GA (top 69%) — low school quality limits family demand, transient renter base, plan for 1-2y turnover; 61% free/reduced lunch — lower-income household profile, screen leases tightly.
- Market conditions: Rents rising (+1.8%/yr); 100 active listings in the ZIP; 9 comparable units currently listed for rent nearby; rentals leasing fast (median 14d on market — plan ~1-2 weeks tenant-placement turnaround); lower-income renter base — watch delinquency; 291 units permitted in Muscogee County in 2024 (30 in 5+ unit buildings).
- This rent runs 42% of the median local income ($32k/yr) — at the standard rent-burdened threshold; future hikes will face affordability resistance.
Forward outlook
- Local home prices are declining (-3.0%/yr); year-one equity from $484 of loan paydown is wiped out by about $2k of value loss. Plan a longer hold.
- Muscogee County population projected at +15% by 2050 — modest demand growth; plan on rents tracking national, not racing it.
- At projected returns (-3.0% appreciation + 1.8% rent growth), your $20k cash investment doubles in ~6 years — after that, you're playing with house money.
Negotiation context
- Only 5 days on market — expect competitive offers; lowballing is unlikely to land.
Risks & watch-outs
- Watch-outs: built in 1958 — expect roof / HVAC / electrical / plumbing capex.
- Climate carrying-cost: major wind risk, 78% chance of damaging wind over 30y; extreme-heat days projected 7→19/yr by 2055 (HVAC capex compounding) — expect insurance premiums to compound above CPI over the hold.
Questions for the listing agent
- Built in 1958 — when were the roof, HVAC, electrical panel, plumbing, and water heater last replaced?
- Is there a deadline driving the sale (1031 exchange, divorce, estate, relocation)? That informs how much negotiation room exists.
- Schools are F-rated, which usually means shorter tenancies and higher turnover. Who's the typical renter profile here, and what's been the actual vacancy rate?
- Crime grade is F in this area — have there been break-ins, vandalism, or insurance claims at this property in the last 3 years? What carrier currently insures it and at what premium?
- What's the average days-on-market for RENTAL listings here right now (not sales)? A rising rental-DOM trend means longer vacancies and softer asking-rent achievability than the comps imply.
- What's the recent tenant-quality profile in this submarket — average credit score on applications, eviction rate, late-payment / NSF rate, and stable-employment percentage? A property-management company in the area should have these aggregated.
- How much new for-sale + rental construction is in the pipeline within 1–3 miles? Heavy new supply typically softens prices + rents 12–24 months out; constrained supply supports both.
Investment metrics
- 1% rule
- 1.62% ✓
- Cap rate
- 13.39%
- Cash-on-cash
- 25.35%
- DSCR
- 2.13
- GRM
- 5.1
CMA / ARV
- ARV (on-the-fly)
- $147,664
- Comps found
- 12
Show comp detail 12 sales within ~0.75 mi
| Address | Dist | Beds/Ba | Sqft | Sold | Price | $/sf | Match |
|---|---|---|---|---|---|---|---|
| 2941 Luckie St | 0.26mi | 3/2.0 | 1,652 (-2%) | 11mo | $165,500 | $100 | 76 |
| 3001 Plantation Rd | 0.20mi | 4/2.0 (+1) | 1,595 (-5%) | 8mo | $86,000 | $54 | 71 |
| 2951 Peyton Dr | 0.33mi | 3/2.0 | 1,700 (+1%) | 14mo | $149,900 | $88 | 70 |
| 3020 Drake St | 0.31mi | 4/2.0 (+1) | 1,740 (+4%) | 14mo | $115,000 | $66 | 63 |
| 3042 Hendrix St | 0.11mi | 4/2.0 (+1) | 1,470 (-12%) | 18mo | $148,000 | $101 | 54 |
| 2892 Ramsey Rd | 0.49mi | 4/2.0 (+1) | 1,600 (-5%) | 14mo | $110,000 | $69 | 53 |
| 2433 Bond Ave | 0.51mi | 3/2.0 | 1,598 (-5%) | 19mo | $127,500 | $80 | 52 |
| 3021 Emory St | 0.45mi | 4/2.0 (+1) | 1,502 (-10%) | 8mo | $95,000 | $63 | 50 |
| 1826 Oakland Ave | 0.38mi | 3/2.0 | 1,457 (-13%) | 16mo | $129,900 | $89 | 47 |
| 3115 Meade St | 0.48mi | 3/2.0 | 1,437 (-14%) | 10mo | $15,000 | $10 | 45 |
| 2303 Ginny Ave | 0.48mi | 4/1.0 (+1) | 1,526 (-9%) | 12mo | $144,900 | $95 | 44 |
| 2505 Broadmoor Dr | 0.69mi | 3/1.0 | 1,437 (-14%) | 2mo | $145,000 | $101 | 39 |
Match score weights: distance 35% · size 25% · config 20% · recency 20%. Top-matched comps best support the ARV.
Projected returns pro-forma
-3.0% appreciation · 1.82% rent growth · sell at horizon
- IRR
- 17.6%
- Equity multiple
- 1.70×
- Total profit
- $13,708
- Equity at exit
- $10,437
- IRR
- 25.2%
- Equity multiple
- 3.07×
- Total profit
- $40,616
- Equity at exit
- $6,052
Cash invested: $19,600 (down + closing). Projections, not guarantees.
Landlord ↔ Tenant lean methodology
- Overall (STATE)
- 90 Strongly Landlord-Friendly
- State Georgia
- 90 Strongly Landlord-Friendly · R+3
- County
- — inherits STATE
- City
- — inherits STATE
ZIP-level market 31903
- Home prices YoY
- -14.5%
- Rents YoY
- 1.8%
- Active inventory
- 100
- Price-to-rent
- 5.1×
Monthly cashflow live
- Estimated rent
- $1,136 high interval (Pro) →
- Mortgage (P&I)
- −$367
- Tax est. 1.5%
- −$88 /mo · $1,050/yr
- Insurance
- −$29
- HOA
- −$0
- Vacancy / Maint / Mgmt
- −$239
- Net cashflow
- $414
Break-even live
UW: 25.0% down · 7.5% · 30yr · 1.5% tax · 5.0% vac · 8.0% maint · 8.0% mgmt
Financing live
Cash to close
- Down payment
- $17,500
- Closing costs
- $2,100
- Reserves months
- —
- Total cash needed
- —
Loan-product check · same deal, 3 products live
Conventional
25% down · 7.5% · 30yr
- Down + closing
- —
- Monthly P&I
- —
- Monthly cashflow
- —
- DSCR
- —
- Eligible?
- —
Personal DTI + credit; lowest rate.
DSCR
20% down · 8.5% · 30yr
- Down + closing
- —
- Monthly P&I
- —
- Monthly cashflow
- —
- DSCR
- —
- Eligible?
- —
No personal income docs; deal must DSCR.
Hard money
10% down · 12.0% · 12mo
- Down + closing
- —
- Monthly P&I
- —
- Monthly cashflow
- —
- DSCR
- —
- Eligible?
- —
Short-term bridge; refi at stabilization.
Rent comps 9 comps
| Address | Beds | Baths | Sqft | Rent | $/sqft | DOM | Units | Dist |
|---|---|---|---|---|---|---|---|---|
| 2051 Somerset Ave Columbus, GA | 3.0 | 1.0 | 1092 | $1,100 | $1.01 | 43d | 1 | 0.25mi |
| 2829 Ramsey Rd Columbus, GA | 3.0 | 1.0 | 1252 | $1,100 | $0.88 | 13d | 1 | 0.50mi |
| 2885 Ramsey Rd Columbus, GA | 3.0 | 2.0 | 1290 | $1,075 | $0.83 | 13d | 1 | 0.52mi |
| 2558 Rice St Columbus, GA | 3.0 | 2.0 | 1618 | $1,450 | $0.90 | 13d | 1 | 0.83mi |
| 2550 Wedgefield Ct Columbus, GA | 2.0 | 2.0 | 1100 | $788 | $0.72 | 13d | 1 | 0.94mi |
| 76 Mathews St Columbus, GA | 3.0 | 2.0 | 1100 | $1,100 | $1.00 | 13d | 1 | 0.97mi |
| 88 Infantry Dr Columbus, GA | 2.0 | 1.0 | 1122 | $900 | $0.80 | 43d | 1 | 1.20mi |
| 50 Eddy Dr Columbus, GA | 3.0 | 1.0 | 1348 | $900 | $0.67 | 43d | 1 | 1.29mi |
| 3390 N Lumpkin Rd Columbus, GA | 2.0–3.0 | 2.0 | 1073 | $1,099 | $1.02 | 13d | 14 | 1.33mi |
Listing history 6 events
-
2026-06-03status $70,000 Pending 5 DOM
-
2026-06-02days on market $70,000 Active 5 DOM
-
2026-06-01days on market $70,000 Active 4 DOM
-
2026-05-31days on market $70,000 Active 3 DOM
-
2026-05-30days on market $70,000 Active 2 DOM
-
2026-05-28$70,000 Active
ⓘ Source: listings_history table (triggers on properties + properties_extension) + one-shot
backfill from property_details.listing_events for pre-trigger history.
Climate risk First Street
- Flood 3/10 Moderate FEMA zone X (unshaded) · 20% chance over 30 yrs
- Wildfire 3/10 Moderate
- Heat 7/10 Severe 7 d/yr ≥107°F today · 19 d/yr by 30 yrs out
- Wind 7/10 Severe 78% chance of damaging wind over 30 yrs
- Air quality 4/10 Moderate 4 unhealthy d/yr today · 5 by 30 yrs out
Nearby sold comps map
Loading sold comps map…
Walkable amenities ~0.75 mi
Loading nearby amenities…
Taxation est. · year 1
- Rental income
- $13,637
- − Mortgage interest
- −$3,921
- − Property taxes
- −$1,050
- − Insurance
- −$350
- − Repairs & maintenance
- −$1,091
- − Management
- −$1,091
- − Depreciation
- −$2,036
- Taxable income
- $4,097
- Est. tax owed @ 24.0%
- −$983
- After-tax cash flow
- $3,985/yr
For passive investors: Depreciation is non-cash, so a rental often shows a tax loss while cash-flowing — sheltering income. Rental losses are passive: they offset passive income freely, and up to $25,000/yr can offset ordinary (W-2) income if you actively participate and your MAGI is under $100k (phasing out to $0 by $150k); unused losses carry forward. On sale, claimed depreciation is recaptured at up to 25%, and gains may owe capital-gains tax (a 1031 exchange can defer both). Figures are a year-1 estimate at your 24.0% rate — not tax advice; consult a CPA.
Schools (NCES district)
- District
- Muscogee County
- NCES district ID
- 1303870
- Math proficiency
- 21% ▼ -11.00%
- Reading proficiency
- 30% ▼ -7.00%
- Median HH income
- $41,176
- Composite
- 21.6/100
- National rank
- #8297
- State rank
- #120 of 174 in GA
Livability — Columbus
- Score
- 64/100
- State rank
- #254
- US rank
- #14102
Category grades
Schools grade is shown separately in the Schools card above.
Census & demographics
- Census place
- Columbus, GA
- County
- Muscogee County · 180,764 people
- City population
- 180,764
- Metro
- Columbus, GA-AL
- Population (ZIP)
- 20,644
- Household income
- $32,401
- Rent vs Own
- Severe rent burden
- 1878.0
Population outlook (Muscogee County) Hauer SSP2
- Today (2025)
- 216,729 people
- By 2030
- 224,504 · +3.6%
- By 2040
- 238,318 · +10.0%
- By 2050
- 249,027 · +14.9%
- By 2075
- 264,862 · +22.2%
- By 2100
- 254,786 · +17.6%
Race, ethnicity, and origin ACS 2023
- Neighborhood character
- Predominantly Black (77%)
- Race & ethnicity
- Black 77% Hispanic / Latino 11% White 9% Two or more races 3% Asian 1%
- Hispanic origin (detail)
- Mexican 6% Puerto Rican 2%
- Foreign-born
- 6% · Canada
- Languages at home
- 88% English-only · Spanish 10% Other Indo-European 1%
Political lean MEDSL · Muscogee
- 2024 margin
- Strong D (+23.4) · D 61.4% · R 38.0%
- 2008→2024 swing
- +3.7pp toward D · 2008: 19.7pp · 2024: 23.4pp
- All cycles
- 2024: D+23.4 2020: D+24.0 2016: D+18.6 2012: D+21.3 2008: D+19.7
Not yet ingested
- Civics
- —
Market trends
- HPI YoY
- ▼ -22.30%
- Current HPI
- 131.4761
- Rent YoY
- ▲ 1.82%
- Metro
- Columbus, GA-AL
- State GDP YoY
- ▲ 2.66%
- F500 in state
- 28
Industry mix (Fortune 500 HQ in GA)
| Industry | F500 HQs | Revenue |
|---|---|---|
| Paper / Packaging | 2 | $29B |
|
||
| Retail | 1 | $160B |
|
||
| Transportation / Logistics | 1 | $91B |
|
||
| Airlines | 1 | $62B |
|
||
| Consumer Goods | 1 | $47B |
|
||
| Utilities | 1 | $25B |
|
||
Price history
1 event — show timeline
- 2026-05-28 Listed $70,000 CBOR
Property tax history
-8.4%/yrLatest (2025): $67 · -59.7% YoY. Source: county tax records.
Cash-flow waterfall
monthlySold comps — $/sqft
last 12 mo · ≤1 miLoading sold comps…