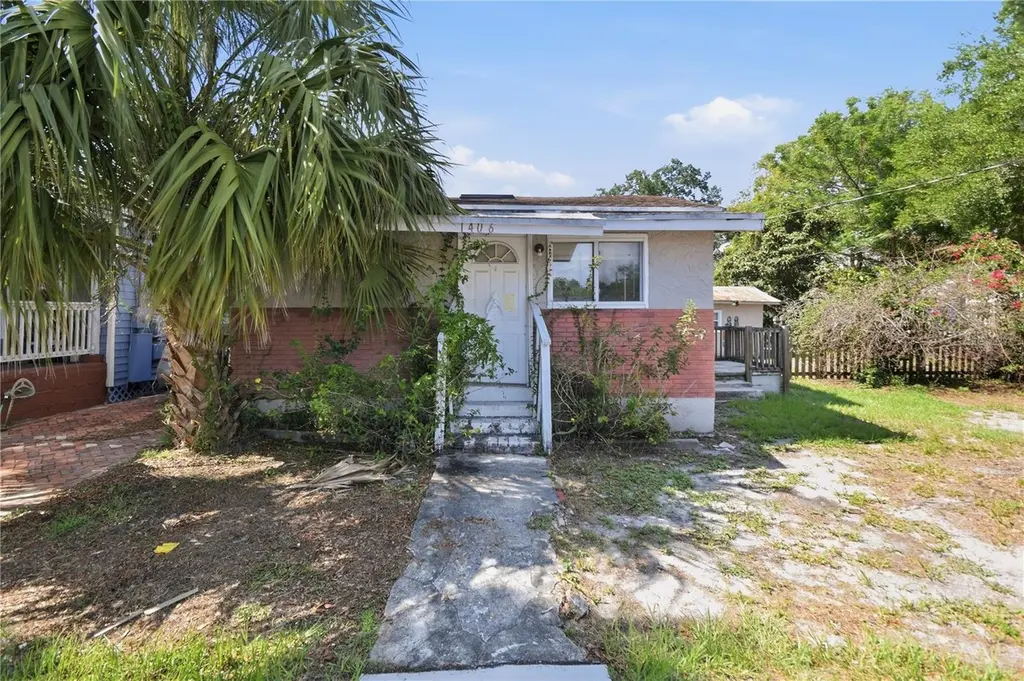
1406 E Louisiana Ave · Tampa, FL
Flood risk 1/10 · Minimal
- FEMA flood zone
- X (unshaded)
- Chance of flooding over 30 yrs
- 0.0%
- Est. flood insurance / yr
- $507 – $1,088
Fire risk 1/10 · Minimal
- Est. fire insurance / yr
- $947 – $1,759
Heat risk 10/10 · Severe
- Hot days now (above 108°F)
- 7 days/yr
- Hot days in 30 yrs
- 23 days/yr
Wind risk 9/10 · Severe
- Chance of severe wind over 30 yrs
- 99.0%
Air-quality risk 3/10 · Minor
- Unhealthy air days now
- 3 days/yr
- Unhealthy air days in 30 yrs
- 4 days/yr
Risk factors via First Street. Map © Google.
Why this score? — see what drove the B grade
The composite is a weighted blend of 9 inputs, each scored 0–100. Each bar is that input's sub-score; the figure is the points it added to the 100-point composite (weight × sub-score).
- Cash flow +30.0/30.0
- 1% rule +10.0/10.0
- DSCR +10.0/10.0
- ARV discount +7.5/15.0
- Schools +4.2/10.0
- Livability +4.0/5.0
- Condition / age +2.5/5.0
- Rent growth +2.2/5.0
- Appreciation +0.0/10.0
$129,999
🖨 Deal sheet (PDF) 📄 Offer letter ✓ Due diligence
Listing remarks
One or more photo(s) has been virtually staged. Opportunity awaits in this centrally located Tampa property with convenient access to downtown, major highways, dining, shopping, and local attractions. This home offers a functional layout and solid potential for buyers looking to renovate, update, or customize to their vision. Spacious living areas and a sizable yard provide a strong foundation for improvement and added value. Ideal for investors, renovators, or buyers seeking a project in an established neighborhood with continued growth and redevelopment nearby.
Key facts
- Sizable yard
- Strong foundation
- Centrally located
Tags
Property features AI
Finance
- Other: Lot size about 0.11 acre
- HOA & community: No association; Pets allowed
Exterior
- Utilities: Water source: see remarks; Sewer: other; Other utilities
- Home design: Single family residence; Residential property; One story; Facing east; Zoned SH-RS; Entry level: One
- Construction: Shingle roof; Other construction materials; Slab foundation; Built as a single-story structure
- Exterior features: Private mailbox; Asphalt road access
Interior
- Kitchen: Other appliances
- Bedrooms: 2 bedrooms
- Flooring: Tile flooring; Wood flooring
- Bathrooms: 1 full bathroom
- Heating & cooling: Electric heating; Other cooling
- Interior features: Other interior features; 6 total rooms
- Laundry & utility: Laundry: Other
Neighborhood map
What this means for you Summary
Snapshot
- This is a 2-bed/1.0-bath single-family listed at $130k.
Deal economics
- At list price, monthly cash flow is $673 ($8k/yr) — positive.
- The deal already cash-flows at list — no discount required.
- Meets the 1% rule at list price ($2k rent vs $130k).
Location & tenants
- Location reads 79/100 on livability (#142 in FL, #2,135 nationally) — a middle-class / working-renter tenant base. Strengths: commute A+, housing A+, health & safety A+; Watch: crime D+.
- Hillsborough (suburban): math 47% / reading 50% proficiency, ranked #41 of 73 in FL (top 56%) — families likely to look elsewhere, expect single-tenant / working-renter base with shorter leases.
- Zoned schools: Middleton High School (math 23% / reading 51%, grade F, #340 of 667 statewide, top 52%, 1,511 students, 57% FRL).
- Market conditions: Rents soft (-1.3%/yr); 212 active listings in the ZIP; 40 comparable units currently listed for rent nearby; rentals at typical pace (median 23d on market — plan ~3-4 weeks tenant-placement turnaround); 9,053 units permitted in Hillsborough County in 2024 (4,555 in 5+ unit buildings).
- This rent runs 34% of the median local income ($74k/yr) — at the standard rent-burdened threshold; future hikes will face affordability resistance.
Forward outlook
- Local home prices are declining (-3.0%/yr); year-one equity from $899 of loan paydown is wiped out by about $4k of value loss. Plan a longer hold.
- Hillsborough County population projected at +37% by 2050 — long-run rental-demand tailwind backs the buy-and-hold thesis.
- At projected returns (-3.0% appreciation + 0.0% rent growth), your $36k cash investment doubles in ~7 years — after that, you're playing with house money.
Negotiation context
- Only 14 days on market — expect competitive offers; lowballing is unlikely to land.
- 4 sale attempts since 20y ago with the ask held roughly flat each time — persistent listings suggest the price (not the market) is what's stuck; bring a comps-based counter.
Risks & watch-outs
- Watch-outs: built in 1926 — expect roof / HVAC / electrical / plumbing capex.
- Climate carrying-cost: severe wind risk, 99% chance of damaging wind over 30y; extreme-heat days projected 7→23/yr by 2055 (HVAC capex compounding) — expect insurance premiums to compound above CPI over the hold.
Questions for the listing agent
- Built in 1926 — when were the roof, HVAC, electrical panel, plumbing, and water heater last replaced?
- Is there a deadline driving the sale (1031 exchange, divorce, estate, relocation)? That informs how much negotiation room exists.
- Crime grade is D in this area — have there been break-ins, vandalism, or insurance claims at this property in the last 3 years? What carrier currently insures it and at what premium?
- What's the average days-on-market for RENTAL listings here right now (not sales)? A rising rental-DOM trend means longer vacancies and softer asking-rent achievability than the comps imply.
- What's the recent tenant-quality profile in this submarket — average credit score on applications, eviction rate, late-payment / NSF rate, and stable-employment percentage? A property-management company in the area should have these aggregated.
- How much new for-sale + rental construction is in the pipeline within 1–3 miles? Heavy new supply typically softens prices + rents 12–24 months out; constrained supply supports both.
Investment metrics
- 1% rule
- 1.61% ✓
- Cap rate
- 12.50%
- Cash-on-cash
- 22.18%
- DSCR
- 1.99
- GRM
- 5.2
CMA / ARV
No comps found within radius.
Projected returns pro-forma
-3.0% appreciation · 0.0% rent growth · sell at horizon
- IRR
- 11.3%
- Equity multiple
- 1.43×
- Total profit
- $15,739
- Equity at exit
- $19,383
- IRR
- 17.7%
- Equity multiple
- 2.25×
- Total profit
- $45,552
- Equity at exit
- $11,240
Cash invested: $36,400 (down + closing). Projections, not guarantees.
Landlord ↔ Tenant lean methodology
- Overall (STATE)
- 87 Strongly Landlord-Friendly
- State Florida
- 87 Strongly Landlord-Friendly · R+3
- County
- — inherits STATE
- City
- — inherits STATE
ZIP-level market 33603
- Rents YoY
- -1.3%
- Active inventory
- 212
- Price-to-rent
- 5.2×
Monthly cashflow live
- Estimated rent
- $2,088 high interval (Pro) →
- Mortgage (P&I)
- −$682
- Tax from tax record
- −$241 /mo · $2,888/yr
- Insurance
- −$54
- HOA
- −$0
- Vacancy / Maint / Mgmt
- −$438
- Net cashflow
- $673
Break-even live
Sensitivity live
| Price | -10% $746 | -5% $709 | +0% $673 | +5% $636 | +10% $599 |
|---|---|---|---|---|---|
| Rent | -10% $508 | -5% $590 | +0% $673 | +5% $755 | +10% $838 |
| Rate | -1.0pp $738 | -0.5pp $706 | base $673 | +0.5pp $639 | +1.0pp $605 |
UW: 25.0% down · 7.5% · 30yr · 1.5% tax · 5.0% vac · 8.0% maint · 8.0% mgmt
Financing live
Cash to close
- Down payment
- $32,500
- Closing costs
- $3,900
- Reserves months
- —
- Total cash needed
- —
Loan-product check · same deal, 3 products live
Conventional
25% down · 7.5% · 30yr
- Down + closing
- —
- Monthly P&I
- —
- Monthly cashflow
- —
- DSCR
- —
- Eligible?
- —
Personal DTI + credit; lowest rate.
DSCR
20% down · 8.5% · 30yr
- Down + closing
- —
- Monthly P&I
- —
- Monthly cashflow
- —
- DSCR
- —
- Eligible?
- —
No personal income docs; deal must DSCR.
Hard money
10% down · 12.0% · 12mo
- Down + closing
- —
- Monthly P&I
- —
- Monthly cashflow
- —
- DSCR
- —
- Eligible?
- —
Short-term bridge; refi at stabilization.
Rent comps 40 comps
| Address | Beds | Baths | Sqft | Rent | $/sqft | DOM | Units | Dist |
|---|---|---|---|---|---|---|---|---|
| 1517 E Ellicott St Tampa, FL | 3.0 | 2.0 | 1292 | $2,225 | $1.72 | 18d | 1 | 0.18mi |
| 1501 E Palifox St Tampa, FL | 3.0 | 2.0 | 1248 | $1,750 | $1.40 | 15d | 1 | 0.21mi |
| 1202 E Caracas St Tampa, FL | 3.0 | 3.0 | 1224 | $2,595 | $2.12 | 25d | 1 | 0.23mi |
| 1711 E New Orleans Ave Tampa, FL | 3.0 | 2.0 | 1136 | $2,250 | $1.98 | 21d | 1 | 0.25mi |
| 1301 E Cayuga St Tampa, FL | 3.0 | 1.5 | 1216 | $2,200 | $1.81 | 25d | 1 | 0.25mi |
| 1517 E Giddens Ave Tampa, FL | 2.0 | 2.0 | 792 | $1,850 | $2.34 | 25d | 1 | 0.36mi |
| 4207 N 13th St Unit A Tampa, FL | 2.0 | 2.0 | 832 | $2,150 | $2.58 | 25d | 1 | 0.42mi |
| 902 E Curtis St Unit 1 Tampa, FL | 2.0 | 2.0 | 1325 | $3,200 | $2.42 | 19d | 1 | 0.44mi |
| 1709 E Chelsea St Unit F Tampa, FL | 2.0 | 1.0 | 1041 | $1,625 | $1.56 | 25d | 1 | 0.46mi |
| 1602 E North Bay St Tampa, FL | 3.0 | 2.0 | 1200 | $2,100 | $1.75 | 25d | 1 | 0.47mi |
| 1215 E Mohawk Ave Tampa, FL | 2.0 | 1.0 | 840 | $1,800 | $2.14 | 12d | 1 | 0.50mi |
| 1212 E Mohawk Ave Tampa, FL | 3.0 | 1.0 | 1266 | $1,995 | $1.58 | 21d | 1 | 0.53mi |
| 816 E Frierson Ave Tampa, FL | 3.0 | 1.0 | 864 | $2,250 | $2.60 | 25d | 1 | 0.57mi |
| 806 E Chelsea St Unit 4 Tampa, FL | 2.0 | 1.0 | 850 | $1,790 | $2.11 | 25d | 1 | 0.62mi |
| 806 E Chelsea St Unit 3 Tampa, FL | 1.0 | 1.0 | 850 | $1,690 | $1.99 | 25d | 1 | 0.62mi |
| 1610 E Powhatan Ave Tampa, FL | 3.0 | 2.0 | 1188 | $3,250 | $2.74 | 25d | 1 | 0.65mi |
| 1504 E 33rd Ave Tampa, FL | 3.0 | 2.0 | 1108 | $2,900 | $2.62 | 25d | 1 | 0.65mi |
| 807 E Genesee St Unit 1/2 Tampa, FL | 3.0 | 2.0 | 1414 | $2,400 | $1.70 | 23d | 1 | 0.65mi |
| 807 E Genesee St Tampa, FL | 3.0 | 2.0 | 1414 | $2,400 | $1.70 | 21d | 1 | 0.65mi |
| 4905 N Central Ave Unit 1 Tampa, FL | 1.0 | 1.0 | 705 | $1,245 | $1.77 | 0d | 1 | 0.68mi |
| 4905 N Central Ave Unit 1 Tampa, FL | 1.0 | 1.0 | 705 | $1,295 | $1.84 | 23d | 1 | 0.68mi |
| 1305 E Louise Ave Tampa, FL | 3.0 | 2.0 | 1384 | $2,700 | $1.95 | 25d | 1 | 0.75mi |
| 5541 N 22nd St Tampa, FL | 1.0–2.0 | 1.0–2.0 | 798 | $1,950 | $2.44 | 0d | 27 | 0.77mi |
| 1515 E 31st Ave Tampa, FL | 2.0 | 1.0 | 914 | $1,500 | $1.64 | 6d | 1 | 0.81mi |
| 2007 E Henry Ave Tampa, FL | 2.0 | 2.0 | 1278 | $2,250 | $1.76 | 25d | 1 | 0.81mi |
| 2402 E Doctor Martin Luther King Junior Blvd Tampa, FL | 2.0 | 1.0 | 710 | $1,699 | $2.39 | 25d | 1 | 0.91mi |
| 2016 E Clifton St Unit A Tampa, FL | 3.0 | 2.0 | 1250 | $2,249 | $1.80 | 25d | 1 | 0.91mi |
| 3519 N 10th St Tampa, FL | 3.0 | 2.0 | 1200 | $1,850 | $1.54 | 19d | 1 | 0.92mi |
| 4713 1/2 N Florida Ave Apt A Tampa, FL | 1.0 | 1.0 | 720 | $1,800 | $2.50 | 18d | 1 | 0.94mi |
| 3511 Cone Ct Tampa, FL | 3.0 | 2.0 | 1256 | $2,200 | $1.75 | 6d | 1 | 0.95mi |
| 1605 E 29th Ave Tampa, FL | 3.0 | 1.0 | 870 | $1,800 | $2.07 | 21d | 1 | 0.95mi |
| 4513 N Florida Ave Tampa, FL | 2.0 | 1.0 | 887 | $2,299 | $2.59 | 3d | 6 | 0.95mi |
| 1419 E Jean St Tampa, FL | 2.0 | 2.0 | 1366 | $2,199 | $1.61 | 25d | 1 | 0.97mi |
| 1105 E 28th Ave Tampa, FL | 3.0 | 1.0 | 744 | $1,525 | $2.05 | 6d | 1 | 1.00mi |
| 102 W Emma St Unit 1271942P Tampa, FL | 2.0 | 2.0 | 775 | $3,311 | $4.27 | 0d | 1 | 1.02mi |
| 3411 N 13th St Tampa, FL | 3.0 | 2.0 | 978 | $1,895 | $1.94 | 25d | 1 | 1.02mi |
| 809 E Baker St Unit A Tampa, FL | 3.0 | 1.0 | 1083 | $2,200 | $2.03 | 25d | 1 | 1.03mi |
| 309 E Selma Ave Tampa, FL | 3.0 | 2.0 | 1170 | $3,095 | $2.65 | 6d | 1 | 1.03mi |
| 103 E Mohawk Ave Unit B Tampa, FL | 1.0 | 1.0 | 980 | $1,300 | $1.33 | 4d | 1 | 1.03mi |
| 5236 N Florida Ave Tampa, FL | 1.0 | 1.0 | 645 | $2,125 | $3.29 | 6d | 4 | 1.04mi |
Listing history 21 events
-
2026-06-13statusdays on market $129,999 Pending 14 DOM
-
2026-06-09days on market $129,999 Active 12 DOM
-
2026-06-08days on market $129,999 Active 11 DOM
-
2026-06-07days on market $129,999 Active 10 DOM
-
2026-06-04days on market $129,999 Active 7 DOM
-
2026-06-03days on market $129,999 Active 6 DOM
-
2026-06-02days on market $129,999 Active 5 DOM
-
2026-06-01days on market $129,999 Active 4 DOM
-
2026-05-31days on market $129,999 Active 3 DOM
-
2026-05-29$129,999 Active
-
2022-11-15soldstatus $5,322,135
-
2007-10-22$125,000
-
2007-04-20historical
-
2007-04-19soldstatus $145,500
-
2007-04-04$229,000
-
2007-01-03soldstatus $105,000
-
2006-11-01$110,250
-
2005-04-12soldstatus $130,000
-
2004-02-16soldstatus $100,000
-
2001-09-07soldstatus $59,500
-
1983-07-01soldstatus $25,000
ⓘ Source: listings_history table (triggers on properties + properties_extension) + one-shot
backfill from property_details.listing_events for pre-trigger history.
Tax reassessment forecast FL · Resets to sale price
- Current annual tax
- $2,888 · $241/mo
- Projected year-2 tax
- $2,888 · $241/mo
- Expected delta
- $0/yr ($0/mo · 0.0%)
ⓘ Screening estimate from a state-policy table — verify with the county assessor before closing.
Climate risk First Street
- Flood 1/10 Low FEMA zone X (unshaded) · 0% chance over 30 yrs
- Wildfire 1/10 Low
- Heat 10/10 Extreme 7 d/yr ≥108°F today · 23 d/yr by 30 yrs out
- Wind 9/10 Extreme 99% chance of damaging wind over 30 yrs
- Air quality 3/10 Moderate 3 unhealthy d/yr today · 4 by 30 yrs out
Nearby sold comps map
Loading sold comps map…
Walkable amenities ~0.75 mi
Loading nearby amenities…
Taxation est. · year 1
- Rental income
- $25,052
- − Mortgage interest
- −$7,282
- − Property taxes
- −$2,888
- − Insurance
- −$650
- − Repairs & maintenance
- −$2,004
- − Management
- −$2,004
- − Depreciation
- −$3,782
- Taxable income
- $6,442
- Est. tax owed @ 24.0%
- −$1,546
- After-tax cash flow
- $6,526/yr
For passive investors: Depreciation is non-cash, so a rental often shows a tax loss while cash-flowing — sheltering income. Rental losses are passive: they offset passive income freely, and up to $25,000/yr can offset ordinary (W-2) income if you actively participate and your MAGI is under $100k (phasing out to $0 by $150k); unused losses carry forward. On sale, claimed depreciation is recaptured at up to 25%, and gains may owe capital-gains tax (a 1031 exchange can defer both). Figures are a year-1 estimate at your 24.0% rate — not tax advice; consult a CPA.
Schools (NCES district)
- District
- Hillsborough
- NCES district ID
- 1200870
- Math proficiency
- 47% ▼ -8.00%
- Reading proficiency
- 50% ▼ -4.00%
- Median HH income
- $50,622
- Composite
- 41.6/100
- National rank
- #3435
- State rank
- #41 of 73 in FL
Livability — Tampa
- Score
- 79/100
- State rank
- #142
- US rank
- #2135
Category grades
Schools grade is shown separately in the Schools card above.
Census & demographics
- Census place
- Tampa, FL
- County
- Hillsborough County · 1,540,968 people
- City population
- 523,346
- Metro
- Tampa-St. Petersburg-Clearwater, FL
- Population (ZIP)
- 19,869
- Household income
- $74,081
- Rent vs Own
- Severe rent burden
- 800.0
Population outlook (Hillsborough County) Hauer SSP2
- Today (2025)
- 1,607,022 people
- By 2030
- 1,733,968 · +7.9%
- By 2040
- 1,979,565 · +23.2%
- By 2050
- 2,203,427 · +37.1%
- By 2075
- 2,667,893 · +66.0%
- By 2100
- 2,891,558 · +79.9%
Race, ethnicity, and origin ACS 2023
- Neighborhood character
- Diverse neighborhood (Simpson 0.67)
- Race & ethnicity
- White 44% Hispanic / Latino 33% Two or more races 22% Black 17%
- Hispanic origin (detail)
- Mexican 1% Puerto Rican 7% Cuban 15% Dominican 1%
- Common ancestry
- Italian 3% Romanian 2% Slovak 2%
- Foreign-born
- 18% · Canada, Jamaica
- Languages at home
- 74% English-only · Spanish 25%
Political lean MEDSL · Hillsborough
- 2024 margin
- Toss-up / Even · D 47.8% · R 50.9% · Other 1.3%
- 2008→2024 swing
- -10.2pp toward R · 2008: 7.1pp · 2024: -3.1pp
- All cycles
- 2024: R+3.1 2020: D+6.9 2016: D+6.8 2012: D+6.7 2008: D+7.1
Not yet ingested
- Civics
- —
Market trends
- HPI YoY
- ▼ -256.57%
- Current HPI
- 467.4179
- Rent YoY
- ▼ -1.33%
- Metro
- Tampa-St. Petersburg-Clearwater, FL
- State GDP YoY
- ▲ 3.28%
- F500 in state
- 36
Industry mix (Fortune 500 HQ in FL)
| Industry | F500 HQs | Revenue |
|---|---|---|
| Industrial Technology | 2 | $29B |
|
||
| Insurance | 2 | $17B |
|
||
| Retail | 1 | $60B |
|
||
| Technology Distribution | 1 | $58B |
|
||
| Homebuilding | 1 | $35B |
|
||
| Technology Manufacturing | 1 | $35B |
|
||
Price history
+420.0% since first listed12 events — show timeline
- 2026-05-29 Listed $129,999 Stellar MLS as Distributed by MLS Grid
- 2022-11-15 Sold (Public Records) $5,322,135 Public Records
- 2007-10-22 Listed $125,000 Stellar MLS as Distributed by MLS Grid
- 2007-04-20 Listing Removed — Stellar MLS as Distributed by MLS Grid
- 2007-04-19 Sold (Public Records) $145,500 Public Records
- 2007-04-04 Listed $229,000 Stellar MLS as Distributed by MLS Grid
- 2007-01-03 Sold (MLS) $105,000 Stellar MLS as Distributed by MLS Grid
- 2006-11-01 Listed $110,250 Stellar MLS as Distributed by MLS Grid
- 2005-04-12 Sold (Public Records) $130,000 Public Records
- 2004-02-16 Sold (Public Records) $100,000 Public Records
- 2001-09-07 Sold (Public Records) $59,500 Public Records
- 1983-07-01 Sold (Public Records) $25,000 Public Records
Property tax history
+15.8%/yrLatest (2025): $2,888 · +7.7% YoY. Source: county tax records.
Cash-flow waterfall
monthlySold comps — $/sqft
last 12 mo · ≤1 miLoading sold comps…