 Triplex
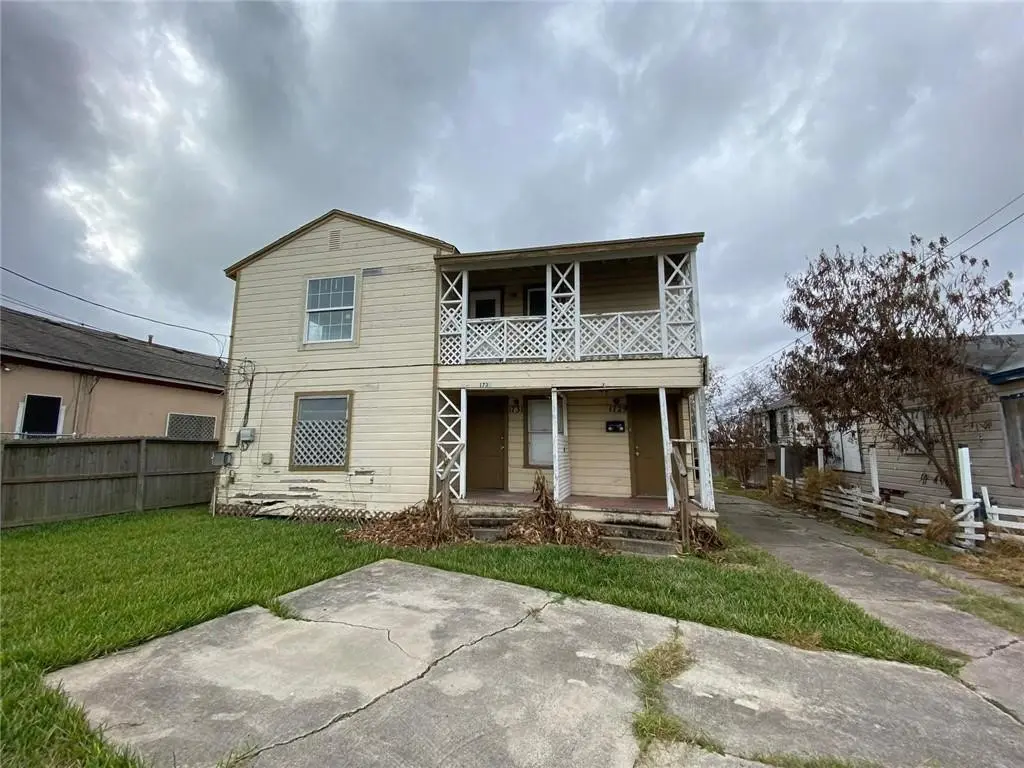
1731 15th St · Corpus Christi, TX
Flood risk 1/10 · Minimal
- FEMA flood zone
- X (unshaded)
- Chance of flooding over 30 yrs
- 0.0%
- Est. flood insurance / yr
- $507 – $1,088
Fire risk 1/10 · Minimal
- Est. fire insurance / yr
- $1,222 – $2,270
Heat risk 10/10 · Severe
- Hot days now (above 107°F)
- 7 days/yr
- Hot days in 30 yrs
- 27 days/yr
Wind risk 9/10 · Severe
- Chance of severe wind over 30 yrs
- 99.0%
Air-quality risk 1/10 · Minimal
- Unhealthy air days now
- 0 days/yr
- Unhealthy air days in 30 yrs
- 0 days/yr
Risk factors via First Street. Map © Google.
Why this score? — see what drove the B+ grade
The composite is a weighted blend of 9 inputs, each scored 0–100. Each bar is that input's sub-score; the figure is the points it added to the 100-point composite (weight × sub-score).
- Cash flow +30.0/30.0
- ARV discount +15.0/15.0
- 1% rule +10.0/10.0
- DSCR +10.0/10.0
- Livability +3.9/5.0
- Rent growth +3.0/5.0
- Schools +2.8/10.0
- Condition / age +2.5/5.0
- Appreciation +0.0/10.0
$165,000
🖨 Deal sheet 📄 Offer letter ✓ Due diligence
Multi-family units
County records classify this as Multi-Family (2-4 Unit). Listing-text estimate: 3 units. confirmed
Listing remarks MLS
Prime Investor Opportunity: 3-Unit Fixer-Upper with Value-Add Potential! Unlock massive upside in this multi-family gem—perfect for savvy investors ready to renovate and maximize rental income. Featuring three spacious 2-bedroom, 1-bath units across two buildings: 1731 (Front House, 1st Floor): 874 sq ft, ideal ground-level layout for easy access. 1729 (Front House, 2nd Floor): 905 sq ft, bright and airy with upper-level views and deck. 1729 1/2 (Back Building): 912 sq ft spanning the 2nd floor and half of the 1st—versatile space with room to shine. Bonus Revenue Stream: A rentable 300 sq ft storage unit on the back building's 1st floor, ready to boost your cash flow! This property needs repairs but offers endless potential for flips, long-term holds, or Airbnb conversions. Seller's lender open to financing for a year until renovation and refinance complete—let's discuss terms! All offers considered—act fast and submit yours today!
Key facts
- 6,251 sq ft lot
- Built 1970
- Listed 220 days
Neighborhood map
What this means for you Summary
Snapshot
- This is a 3 × 2-bed/1.0-bath units multifamily listed at $165k.
Deal economics
- At list price, monthly cash flow is $2k ($20k/yr) — positive. Per door: $560/mo.
- The deal already cash-flows at list — no discount required.
- Meets the 1% rule at list price ($4k rent vs $165k).
- Recommended offer: $145k (12.0% below list) — sets the bar for market timing.
- Cap rate 18.5% vs local median 3.6% in Corpus Christi — top-decile yield for the area; either an underpriced asset or a hidden risk that comps aren't pricing in. Stress-test before assuming the spread holds.
Location & tenants
- Location reads 78/100 on livability (#66 in TX, #2,404 nationally) — a middle-class / working-renter tenant base. Strengths: commute A+, cost of living A+, housing A+; Watch: crime F.
- Corpus Christi ISD (urban): math 31% / reading 35% proficiency, ranked #562 of 826 in TX (top 68%) — families likely to look elsewhere, expect single-tenant / working-renter base with shorter leases; 63% free/reduced lunch — lower-income household profile, screen leases tightly.
- Market conditions: Rents rising (+1.9%/yr); 141 active listings in the ZIP; 1,397 units permitted in Nueces County in 2024 (47 in 5+ unit buildings).
- At $3,705/mo this rent would consume 73% of the median local household income ($61k/yr) (locally 596% of renters already pay >50% of income on rent) — very limited rent-growth headroom before tenants either downsize or default.
Forward outlook
- Local home prices are declining (-3.0%/yr); year-one equity from $1k of loan paydown is wiped out by about $5k of value loss. Plan a longer hold.
- Nueces County population projected at +36% by 2050 — long-run rental-demand tailwind backs the buy-and-hold thesis.
- At projected returns (-3.0% appreciation + 1.9% rent growth), your $46k cash investment doubles in ~3 years — after that, you're playing with house money.
Negotiation context
- It's been on market 220 days — a 12% lower offer ($145k) is reasonable based on typical stale-listing flexibility.
- 4 sale attempts since 11y ago with the ask held roughly flat each time — persistent listings suggest the price (not the market) is what's stuck; bring a comps-based counter.
- Current owner paid $99k; list at $165k implies a 67% gain — meaningful room to come down on a strong offer.
Risks & watch-outs
- Climate carrying-cost: severe wind risk, 99% chance of damaging wind over 30y; extreme-heat days projected 7→27/yr by 2055 (HVAC capex compounding) — expect insurance premiums to compound above CPI over the hold.
Questions for the listing agent
- It's been on market 220 days. Have you received any prior offers? Is the seller open to a 12% concession, seller financing, or rate buy-down credit?
- Can we see the unit-by-unit rent roll, current vacancy, and any below-market leases? What's the average tenancy length?
- What capital expenditures (roof, boiler, parking lot, exteriors) have been made in the last 5 years, and what's planned in the next 2?
- Built in 1970 — when were the roof, HVAC, electrical panel, plumbing, and water heater last replaced?
- Why hasn't it sold? Are there any deal-killer items the seller is aware of (foundation, flood, title, zoning, code violations)?
- Is there a deadline driving the sale (1031 exchange, divorce, estate, relocation)? That informs how much negotiation room exists.
- Crime grade is F in this area — have there been break-ins, vandalism, or insurance claims at this property in the last 3 years? What carrier currently insures it and at what premium?
- What's the average days-on-market for RENTAL listings here right now (not sales)? A rising rental-DOM trend means longer vacancies and softer asking-rent achievability than the comps imply.
- What's the recent tenant-quality profile in this submarket — average credit score on applications, eviction rate, late-payment / NSF rate, and stable-employment percentage? A property-management company in the area should have these aggregated.
- How much new apartment / multifamily construction is in the pipeline within 1–3 miles? Heavy new supply (>2% of stock underway) typically softens rents 12–24 months out; light construction supports rent growth.
Investment metrics
- 1% rule
- 2.25% ✓
- Cap rate
- 18.52%
- Cash-on-cash
- 43.66%
- DSCR
- 2.94
- GRM
- 3.7
CMA / ARV
- ARV (median comp)
- $225,363
- List price
- $165,000
- Delta
- -26.78%
- Verdict
- UNDERPRICED
- Comps
- 20 within 1.0 mi
Projected returns pro-forma
-3.0% appreciation · 1.87% rent growth · sell at horizon
- IRR
- 39.3%
- Equity multiple
- 2.65×
- Total profit
- $76,284
- Equity at exit
- $24,602
- IRR
- 45.1%
- Equity multiple
- 5.07×
- Total profit
- $188,073
- Equity at exit
- $14,266
Cash invested: $46,200 (down + closing). Projections, not guarantees.
Landlord ↔ Tenant lean methodology
- Overall (STATE)
- 87 Strongly Landlord-Friendly
- State Texas
- 87 Strongly Landlord-Friendly · R+5
- County
- — inherits STATE
- City
- — inherits STATE
ZIP-level market 78404
- Rents YoY
- 1.9%
- Active inventory
- 141
- Price-to-rent
- 11.1×
Monthly cashflow live
- Estimated rent
- $3,705 high interval (Pro) →
- Mortgage (P&I)
- −$865
- Tax from tax record
- −$312 /mo · $3,743/yr
- Insurance
- −$69
- HOA
- −$0
- Vacancy / Maint / Mgmt
- −$778
- Net cashflow
- $1,681
Break-even live
3-unit breakdown (identical units grouped — click to expand)
| Units | Beds | Baths | Est. rent |
|---|---|---|---|
| 3× units | 2 | 1 | $3,705 |
| #1 | 2 | 1 | $1,235 |
| #2 | 2 | 1 | $1,235 |
| #3 | 2 | 1 | $1,235 |
| Total (3 units) | $3,705 | ||
UW: 25.0% down · 7.5% · 30yr · 1.5% tax · 5.0% vac · 8.0% maint · 8.0% mgmt
Financing live
Cash to close
- Down payment
- $41,250
- Closing costs
- $4,950
- Reserves months
- —
- Total cash needed
- —
Loan-product check · same deal, 3 products live
Conventional
25% down · 7.5% · 30yr
- Down + closing
- —
- Monthly P&I
- —
- Monthly cashflow
- —
- DSCR
- —
- Eligible?
- —
Personal DTI + credit; lowest rate.
DSCR
20% down · 8.5% · 30yr
- Down + closing
- —
- Monthly P&I
- —
- Monthly cashflow
- —
- DSCR
- —
- Eligible?
- —
No personal income docs; deal must DSCR.
Hard money
10% down · 12.0% · 12mo
- Down + closing
- —
- Monthly P&I
- —
- Monthly cashflow
- —
- DSCR
- —
- Eligible?
- —
Short-term bridge; refi at stabilization.
Listing history 26 events
-
2026-06-18days on market $165,000 Active 220 DOM
-
2026-06-17days on market $165,000 Active 219 DOM
-
2026-06-16days on market $165,000 Active 218 DOM
-
2026-06-15days on market $165,000 Active 217 DOM
-
2026-06-14days on market $165,000 Active 215 DOM
-
2026-06-10days on market $165,000 Active 212 DOM
-
2026-06-09days on market $165,000 Active 211 DOM
-
2026-06-08days on market $165,000 Active 210 DOM
-
2026-06-07days on market $165,000 Active 209 DOM
-
2026-06-05days on market $165,000 Active 206 DOM
-
2026-06-03days on market $165,000 Active 205 DOM
-
2026-06-02days on market $165,000 Active 204 DOM
-
2026-06-01days on market $165,000 Active 203 DOM
-
2026-05-31days on market $165,000 Active 202 DOM
-
2026-05-30days on market $165,000 Active 201 DOM
-
2025-11-10$165,000 Active 974-char remark
Show marketing remark (974 chars)
Prime Investor Opportunity: 3-Unit Fixer-Upper with Value-Add Potential! Unlock massive upside in this multi-family gem—perfect for savvy investors ready to renovate and maximize rental income. Featuring three spacious 2-bedroom, 1-bath units across two buildings: 1731 (Front House, 1st Floor): 874 sq ft, ideal ground-level layout for easy access. 1729 (Front House, 2nd Floor): 905 sq ft, bright and airy with upper-level views and deck. 1729 1/2 (Back Building): 912 sq ft spanning the 2nd floor and half of the 1st—versatile space with room to shine. Bonus Revenue Stream: A rentable 300 sq ft storage unit on the back building's 1st floor, ready to boost your cash flow! This property needs repairs but offers endless potential for flips, long-term holds, or Airbnb conversions. Seller's lender open to financing for a year until renovation and refinance complete—let's discuss terms! All offers considered—act fast and submit yours today!
-
2024-08-11$139,000 Active
-
2016-02-19soldstatus
-
2015-12-01historical
-
2015-10-14price $100,000
-
2015-10-05$119,900 Active
-
2015-08-02historical
-
2015-07-24soldstatus
-
2015-02-16$100,000
-
2009-10-14soldstatus
-
2001-08-14soldstatus $99,000
ⓘ Source: listings_history table (triggers on properties + properties_extension) + one-shot
backfill from property_details.listing_events for pre-trigger history.
Tax reassessment forecast TX · Resets to sale price
- Current annual tax
- $3,743 · $312/mo
- Projected year-2 tax
- $3,743 · $312/mo
- Expected delta
- $0/yr ($0/mo · 0.0%)
ⓘ Screening estimate from a state-policy table — verify with the county assessor before closing.
Climate risk First Street
- Flood 1/10 Low FEMA zone X (unshaded) · 0% chance over 30 yrs
- Wildfire 1/10 Low
- Heat 10/10 Extreme 7 d/yr ≥107°F today · 27 d/yr by 30 yrs out
- Wind 9/10 Extreme 99% chance of damaging wind over 30 yrs
- Air quality 1/10 Low 0 unhealthy d/yr today · 0 by 30 yrs out
Nearby sold comps map
Loading sold comps map…
Walkable amenities ~0.75 mi
Loading nearby amenities…
Taxation est. · year 1
- Rental income
- $44,460
- − Mortgage interest
- −$9,243
- − Property taxes
- −$3,743
- − Insurance
- −$825
- − Repairs & maintenance
- −$3,557
- − Management
- −$3,557
- − Depreciation
- −$4,800
- Taxable income
- $18,736
- Est. tax owed @ 24.0%
- −$4,497
- After-tax cash flow
- $15,676/yr
For passive investors: Depreciation is non-cash, so a rental often shows a tax loss while cash-flowing — sheltering income. Rental losses are passive: they offset passive income freely, and up to $25,000/yr can offset ordinary (W-2) income if you actively participate and your MAGI is under $100k (phasing out to $0 by $150k); unused losses carry forward. On sale, claimed depreciation is recaptured at up to 25%, and gains may owe capital-gains tax (a 1031 exchange can defer both). Figures are a year-1 estimate at your 24.0% rate — not tax advice; consult a CPA.
Schools (NCES district)
- District
- Corpus Christi ISD
- NCES district ID
- 4815270
- Math proficiency
- 31% ▼ -18.00%
- Reading proficiency
- 35% ▼ -7.00%
- Median HH income
- $45,672
- Composite
- 28.27/100
- National rank
- #6793
- State rank
- #562 of 826 in TX
Livability — Corpus Christi
- Score
- 78/100
- State rank
- #66
- US rank
- #2404
Category grades
Schools grade is shown separately in the Schools card above.
Census & demographics
- Census place
- Corpus Christi, TX
- County
- Nueces County · 296,836 people
- City population
- 296,836
- Metro
- Corpus Christi, TX
- Population (ZIP)
- 12,635
- Household income
- $61,280
- Rent vs Own
- Severe rent burden
- 596.0
Population outlook (Nueces County) Hauer SSP2
- Today (2025)
- 418,037 people
- By 2030
- 447,123 · +7.0%
- By 2040
- 505,911 · +21.0%
- By 2050
- 567,522 · +35.8%
- By 2075
- 729,686 · +74.6%
- By 2100
- 847,087 · +102.6%
Race, ethnicity, and origin ACS 2023
- Neighborhood character
- Majority Hispanic (62%)
- Race & ethnicity
- Hispanic / Latino 62% White 32% Two or more races 29% Black 4%
- Hispanic origin (detail)
- Mexican 56%
- Common ancestry
- Slovak 3% Italian 2% Lithuanian 1%
- Foreign-born
- 9% · Canada
- Languages at home
- 61% English-only · Spanish 39%
Political lean MEDSL · Nueces
- 2024 margin
- R (+11.5) · D 43.8% · R 55.3%
- 2008→2024 swing
- -7.1pp toward R · 2008: -4.4pp · 2024: -11.5pp
- All cycles
- 2024: R+11.5 2020: R+2.9 2016: R+1.5 2012: R+3.2 2008: R+4.4
Not yet ingested
- Civics
- —
Market trends
- HPI YoY
- ▼ -211.10%
- Current HPI
- 177.4759
- Rent YoY
- ▲ 1.87%
- Metro
- Corpus Christi, TX
- State GDP YoY
- ▲ 3.95%
- F500 in state
- 110
Industry mix (Fortune 500 HQ in TX)
| Industry | F500 HQs | Revenue |
|---|---|---|
| Energy | 16 | $1,198B |
|
||
| Technology | 5 | $198B |
|
||
| Engineering / Construction | 4 | $72B |
|
||
| Energy Services | 3 | $60B |
|
||
| Utilities | 3 | $41B |
|
||
| Healthcare | 2 | $330B |
|
||
Price history
+66.7% since first listed11 events — show timeline
- 2025-11-10 Listed $165,000 CBMLS
- 2024-08-11 Listed $139,000 CBMLS
- 2016-02-19 Sold (Public Records) — Public Records
- 2015-12-01 Delisted — CBMLS
- 2015-10-14 Price Changed $100,000 CBMLS
- 2015-10-05 Listed $119,900 CBMLS
- 2015-08-02 Delisted — CBMLS
- 2015-07-24 Sold (Public Records) — Public Records
- 2015-02-16 Listed $100,000 CBMLS
- 2009-10-14 Sold (Public Records) — Public Records
- 2001-08-14 Sold (Public Records) $99,000 Public Records
Property tax history
+10.5%/yrLatest (2025): $3,743 · -7.1% YoY. Source: county tax records.
Cash-flow waterfall
monthlySold comps — $/sqft
last 12 mo · ≤1 miLoading sold comps…