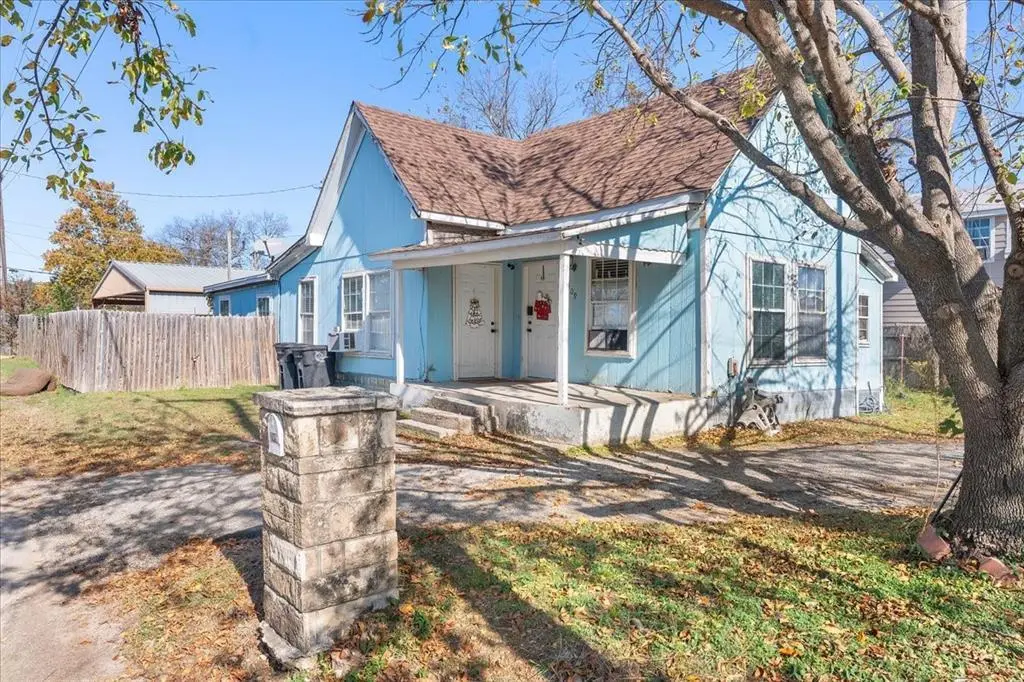
109 N Kouns St · Cleburne, TX
Flood risk 7/10 · Major
- FEMA flood zone
- AE
- Chance of flooding over 30 yrs
- 0.76%
- Est. flood insurance / yr
- $1,737 – $8,500
Fire risk 5/10 · Moderate
- Est. fire insurance / yr
- $1,222 – $2,270
Heat risk 7/10 · Major
- Hot days now (above 109°F)
- 7 days/yr
- Hot days in 30 yrs
- 23 days/yr
Wind risk 6/10 · Moderate
- Chance of severe wind over 30 yrs
- 27.0%
Air-quality risk 2/10 · Minimal
- Unhealthy air days now
- 1 days/yr
- Unhealthy air days in 30 yrs
- 2 days/yr
Risk factors via First Street. Map © Google.
Why this score? — see what drove the B- grade
The composite is a weighted blend of 9 inputs, each scored 0–100. Each bar is that input's sub-score; the figure is the points it added to the 100-point composite (weight × sub-score).
- Cash flow +30.0/30.0
- 1% rule +10.0/10.0
- DSCR +10.0/10.0
- ARV discount +7.5/15.0
- Livability +3.4/5.0
- Schools +2.9/10.0
- Rent growth +2.5/5.0
- Condition / age +2.5/5.0
- Appreciation +0.0/10.0
$100,000
🖨 Deal sheet 📄 Offer letter ✓ Due diligence
Listing remarks
Attention investors! Corner lot opportunity in Cleburne with equity potential. This 3 bed, 1 bath home offers a functional layout featuring a galley kitchen, separate laundry area, and flexible living spaces ready for your vision. Flip it, rent it, or hold it. The bones are there and the location delivers. Minutes from parks, schools, and downtown amenities. Priced to move. Bring your contractor and your imagination!
Key facts
- Galley kitchen
- Minutes from parks
- Minutes from schools
Tags
Property features AI
Finance
- Other: Property type: Residential (Single family residence); Security: Audio and video consent for visitors to record permitted; Possession at closing/funding
- Financial info: Accepts Cash and Conventional financing; No second mortgage reported; Loan type: Treat as clear
- HOA & community: No association
Exterior
- Parking: Driveway; Paved parking
- Security: Owned security system
- Utilities: City water; City sewer; Cable available; Municipal utility district: No
- Home design: Single family residence; One story; Not attached; Built in 1955; Original Cleburne subdivision
- Construction: Construction materials: Unknown; Preowned
- Exterior features: Lot under 0.5 acre (about 0.137 acre); Located on or near Pat Cleburne (waterbody)
Interior
- Kitchen: Gas oven
- Bedrooms: Primary bedroom on level 1, approximately 10 x 10
- Bathrooms: 1 full bathroom
- Heating & cooling: Central heating; Central air conditioning
- Interior features: Cable TV available; One living area; Two total rooms
Neighborhood map
What this means for you Summary
Snapshot
- This is a 3-bed/1.0-bath single-family listed at $100k.
Deal economics
- At list price, monthly cash flow is $187 ($2k/yr) — positive.
- The deal already cash-flows at list — no discount required.
- Meets the 1% rule at list price ($2k rent vs $100k).
- Recommended offer: $97k (3.0% below list) — sets the bar for market timing.
- Cap rate 13.7% vs local median 3.6% in Cleburne — top-decile yield for the area; either an underpriced asset or a hidden risk that comps aren't pricing in. Stress-test before assuming the spread holds.
Location & tenants
- Location reads 68/100 on livability (#460 in TX) — a middle-class / working-renter tenant base. Strengths: cost of living A+, housing A+, health & safety A+; Watch: employment C-, amenities F, commute F.
- Cleburne ISD (town): math 34% / reading 33% proficiency, ranked #537 of 826 in TX (top 65%) — families likely to look elsewhere, expect single-tenant / working-renter base with shorter leases.
- Zoned schools: Santa Fe El (math 37% / reading 32%, grade F, #1,995 of 4,322 statewide, top 50%, 409 students, 91% FRL) — zoned schools average 91% FRL vs 56% district-wide (36 pts higher); higher-poverty schools than district average — tighter screening recommended.
- Market conditions: 335 active listings in the ZIP; 28 comparable units currently listed for rent nearby; rentals at typical pace (median 25d on market — plan ~3-4 weeks tenant-placement turnaround); 46% of comp listings sitting > 30 days — soft ceiling on asking rent; 2,152 units permitted in Johnson County in 2024 (76 in 5+ unit buildings).
Forward outlook
- Local home prices are declining (-3.0%/yr); year-one equity from $691 of loan paydown is wiped out by about $3k of value loss. Plan a longer hold.
- Johnson County population projected at +24% by 2050 — long-run rental-demand tailwind backs the buy-and-hold thesis.
Negotiation context
- It's been on market 44 days — a 3% lower offer ($97k) is reasonable based on typical stale-listing flexibility.
- 2 sale attempts with the ask held roughly flat each time — persistent listings suggest the price (not the market) is what's stuck; bring a comps-based counter.
Risks & watch-outs
- Watch-outs: flood insurance adds $427/mo; built in 1955 — expect roof / HVAC / electrical / plumbing capex.
- Climate carrying-cost: in FEMA flood zone AE (mandatory federal flood insurance); major wind risk, 27% chance of damaging wind over 30y; moderate wildfire risk; extreme-heat days projected 7→23/yr by 2055 (HVAC capex compounding) — expect insurance premiums to compound above CPI over the hold.
Questions for the listing agent
- It's been on market 44 days. Have you received any prior offers? Is the seller open to a 3% concession, seller financing, or rate buy-down credit?
- Built in 1955 — when were the roof, HVAC, electrical panel, plumbing, and water heater last replaced?
- What's the actual annual flood-insurance premium (NFIP or private), and is the property in a SFHA with mandatory coverage?
- Is there a deadline driving the sale (1031 exchange, divorce, estate, relocation)? That informs how much negotiation room exists.
- Schools are F-rated, which usually means shorter tenancies and higher turnover. Who's the typical renter profile here, and what's been the actual vacancy rate?
- What's the average days-on-market for RENTAL listings here right now (not sales)? A rising rental-DOM trend means longer vacancies and softer asking-rent achievability than the comps imply.
- What's the recent tenant-quality profile in this submarket — average credit score on applications, eviction rate, late-payment / NSF rate, and stable-employment percentage? A property-management company in the area should have these aggregated.
- How much new for-sale + rental construction is in the pipeline within 1–3 miles? Heavy new supply typically softens prices + rents 12–24 months out; constrained supply supports both.
Investment metrics
- 1% rule
- 1.75% ✓
- Cap rate
- 13.66%
- Cash-on-cash
- 26.30%
- DSCR
- 2.17
- GRM
- 4.8
CMA / ARV
- ARV (median comp)
- $222,728
- List price
- $100,000
- Delta
- -55.10%
- Verdict
- UNDERPRICED
- Comps
- 20 within 1.0 mi
Show comp detail 12 sales within ~0.75 mi
| Address | Dist | Beds/Ba | Sqft | Sold | Price | $/sf | Match |
|---|---|---|---|---|---|---|---|
| 205 S Washington St | 0.26mi | 3/2.0 | 1,409 (+2%) | 7mo | $295,000 | $209 | 74 |
| 204 Robbins St | 0.40mi | 3/2.5 | 1,372 (-0%) | 5mo | $244,900 | $178 | 71 |
| 805 N Brazos Ave | 0.43mi | 3/2.0 | 1,390 (+1%) | 10mo | $273,750 | $197 | 66 |
| 116 Peacock St | 0.44mi | 3/2.0 | 1,400 (+2%) | 10mo | $259,975 | $186 | 64 |
| 494 Park St | 0.51mi | 3/2.0 | 1,288 (-6%) | 1mo | $199,000 | $155 | 61 |
| 1146 Alvarado St | 0.57mi | 3/1.0 | 1,316 (-4%) | 7mo | $89,500 | $68 | 60 |
| 1300 N Brazos Ave | 0.63mi | 3/2.5 | 1,398 (+2%) | 3mo | $203,900 | $146 | 59 |
| 317 Chase Ave | 0.69mi | 3/2.0 | 1,389 (+1%) | 10mo | $245,000 | $176 | 53 |
| 1004 Traction Trl | 0.67mi | 3/2.0 | 1,450 (+6%) | 10mo | $279,990 | $193 | 47 |
| 427 Sabine Ave | 0.62mi | 3/2.0 | 1,250 (-9%) | 8mo | $214,900 | $172 | 46 |
| 217 Pearl St | 0.71mi | 3/2.0 | 1,498 (+9%) | 4mo | $239,900 | $160 | 45 |
| 438 Sabine Ave | 0.67mi | 3/2.0 | 1,230 (-10%) | 8mo | $174,000 | $141 | 41 |
Match score weights: distance 35% · size 25% · config 20% · recency 20%. Top-matched comps best support the ARV.
Projected returns pro-forma
-3.0% appreciation · 3.0% rent growth · sell at horizon
- IRR
- -3.8%
- Equity multiple
- 0.86×
- Total profit
- $-3,953
- Equity at exit
- $14,910
- IRR
- 6.3%
- Equity multiple
- 1.47×
- Total profit
- $13,263
- Equity at exit
- $8,646
Cash invested: $28,000 (down + closing). Projections, not guarantees.
Landlord ↔ Tenant lean methodology
- Overall (STATE)
- 87 Strongly Landlord-Friendly
- State Texas
- 87 Strongly Landlord-Friendly · R+5
- County
- — inherits STATE
- City
- — inherits STATE
ZIP-level market 76031
- Home prices YoY
- -17.6%
- Active inventory
- 335
- Price-to-rent
- 4.8×
Monthly cashflow live
- Estimated rent
- $1,747 high interval (Pro) →
- Mortgage (P&I)
- −$524
- Tax from tax record
- −$200 /mo · $2,401/yr
- Insurance
- −$42
- Flood insurance flood zone
- −$427 /mo · $5,118/yr
- HOA
- −$0
- Vacancy / Maint / Mgmt
- −$367
- Net cashflow
- $187
Break-even live
UW: 25.0% down · 7.5% · 30yr · 1.5% tax · 5.0% vac · 8.0% maint · 8.0% mgmt
Financing live
Cash to close
- Down payment
- $25,000
- Closing costs
- $3,000
- Reserves months
- —
- Total cash needed
- —
Loan-product check · same deal, 3 products live
Conventional
25% down · 7.5% · 30yr
- Down + closing
- —
- Monthly P&I
- —
- Monthly cashflow
- —
- DSCR
- —
- Eligible?
- —
Personal DTI + credit; lowest rate.
DSCR
20% down · 8.5% · 30yr
- Down + closing
- —
- Monthly P&I
- —
- Monthly cashflow
- —
- DSCR
- —
- Eligible?
- —
No personal income docs; deal must DSCR.
Hard money
10% down · 12.0% · 12mo
- Down + closing
- —
- Monthly P&I
- —
- Monthly cashflow
- —
- DSCR
- —
- Eligible?
- —
Short-term bridge; refi at stabilization.
Rent comps 28 comps
| Address | Beds | Baths | Sqft | Rent | $/sqft | DOM | Units | Dist |
|---|---|---|---|---|---|---|---|---|
| 706 S Brazos Ave Unit B Cleburne, TX | 4.0 | 2.0 | 1400 | $1,800 | $1.29 | 24d | 1 | 0.44mi |
| 1218 E James St Cleburne, TX | 3.0 | 2.0 | 1335 | $1,695 | $1.27 | 43d | 1 | 0.51mi |
| 1308 N Brazos Ave Cleburne, TX | 3.0 | 2.0 | 1028 | $1,595 | $1.55 | 24d | 1 | 0.63mi |
| 438 Sabine Ave Cleburne, TX | 3.0 | 2.0 | 1230 | $1,650 | $1.34 | 12d | 1 | 0.65mi |
| 612 N Robinson St Cleburne, TX | 3.0 | 2.5 | 1311 | $2,200 | $1.68 | 43d | 1 | 0.66mi |
| 110 E Wilson St Unit B Cleburne, TX | 3.0 | 2.5 | 1400 | $1,900 | $1.36 | 24d | 1 | 0.71mi |
| 960 Traction Trl Cleburne, TX | 4.0 | 2.0 | 1836 | $2,200 | $1.20 | 43d | 1 | 0.72mi |
| 301 Pearl St Cleburne, TX | 3.0 | 2.0 | 1405 | $1,900 | $1.35 | 24d | 1 | 0.72mi |
| 104 May Ave Cleburne, TX | 3.0 | 2.0 | 1164 | $1,550 | $1.33 | 43d | 1 | 0.82mi |
| 112 W Wilson St Cleburne, TX | 2.0 | 1.0 | 1002 | $1,400 | $1.40 | 43d | 1 | 0.83mi |
| 103 May Ave Cleburne, TX | 3.0 | 2.0 | 1262 | $1,795 | $1.42 | 6d | 1 | 0.84mi |
| 901 N Border St Unit A Cleburne, TX | 2.0 | 1.0 | 900 | $950 | $1.06 | 43d | 1 | 0.85mi |
| 204 W Westhill Dr Cleburne, TX | 3.0 | 2.0 | 1040 | $1,950 | $1.88 | 43d | 1 | 0.89mi |
| 303 Eastland St Cleburne, TX | 3.0 | 3.0 | 1254 | $1,950 | $1.56 | 43d | 1 | 1.03mi |
| 910 Fuller Ave Unit C Cleburne, TX | 3.0 | 2.0 | 1300 | $1,650 | $1.27 | 15d | 1 | 1.06mi |
| 318 College St Unit B Cleburne, TX | 2.0 | 1.0 | 1256 | $1,150 | $0.92 | 24d | 1 | 1.08mi |
| 910 Fuller Ave Unit A Cleburne, TX | 3.0 | 2.0 | 1300 | $1,650 | $1.27 | 43d | 1 | 1.10mi |
| 405 College St Cleburne, TX | 3.0 | 2.0 | 1396 | $1,650 | $1.18 | 6d | 1 | 1.13mi |
| 114 Scurlock Ave Cleburne, TX | 4.0 | 2.0 | 1457 | $1,770 | $1.21 | 43d | 1 | 1.20mi |
| 413 Shaw St Cleburne, TX | 4.0 | 2.0 | 1713 | $2,100 | $1.23 | 43d | 1 | 1.22mi |
| 1005 N Buffalo Ave Cleburne, TX | 3.0 | 1.0 | 1146 | $1,500 | $1.31 | 43d | 1 | 1.24mi |
| 1005 N Buffalo Ave Cleburne, TX | 3.0 | 1.0 | 1146 | $1,500 | $1.31 | 2d | 1 | 1.24mi |
| 1005 N Buffalo Ave Cleburne, TX | 3.0 | 1.0 | 1146 | $1,500 | $1.31 | 24d | 1 | 1.24mi |
| 544 Quail Meadows Dr Cleburne, TX | 4.0 | 2.0 | 1804 | $2,100 | $1.16 | 24d | 1 | 1.38mi |
| 405 Madison St Unit Na Cleburne, TX | 3.0 | 2.0 | 1645 | $1,975 | $1.20 | 43d | 1 | 1.41mi |
| 907 Hodge St Cleburne, TX | 2.0 | 1.0 | 912 | $1,450 | $1.59 | 2d | 1 | 1.42mi |
| 1005 Granbury St Unit A Cleburne, TX | 3.0 | 2.0 | 1362 | $2,050 | $1.51 | 24d | 1 | 1.44mi |
| 807 W Smith St Cleburne, TX | 3.0 | 2.0 | 1223 | $1,845 | $1.51 | 12d | 1 | 1.47mi |
Listing history 20 events
-
2026-06-18days on market $100,000 Active 44 DOM
-
2026-06-17days on market $100,000 Active 43 DOM
-
2026-06-16days on market $100,000 Active 42 DOM
-
2026-06-15days on market $100,000 Active 41 DOM
-
2026-06-13days on market $100,000 Active 39 DOM
-
2026-06-09days on market $100,000 Active 35 DOM
-
2026-06-08days on market $100,000 Active 34 DOM
-
2026-06-07days on market $100,000 Active 33 DOM
-
2026-06-04days on market $100,000 Active 30 DOM
-
2026-06-03days on market $100,000 Active 29 DOM
-
2026-06-02days on market $100,000 Active 28 DOM
-
2026-06-01days on market $100,000 Active 27 DOM
-
2026-05-31days on market $100,000 Active 26 DOM
-
2026-05-05$100,000 Active 420-char remark
-
2026-05-04historical
-
2026-04-07price $110,000
-
2026-03-25price $98,000
-
2026-01-19price $110,000
-
2025-11-30$130,000 Active
-
1997-02-17soldstatus
ⓘ Source: listings_history table (triggers on properties + properties_extension) + one-shot
backfill from property_details.listing_events for pre-trigger history.
Tax reassessment forecast TX · Resets to sale price
- Current annual tax
- $2,401 · $200/mo
- Projected year-2 tax
- $2,401 · $200/mo
- Expected delta
- $0/yr ($0/mo · 0.0%)
ⓘ Screening estimate from a state-policy table — verify with the county assessor before closing.
Climate risk First Street
- Flood 7/10 Severe FEMA zone AE · 76% chance over 30 yrs
- Wildfire 5/10 Major
- Heat 7/10 Severe 7 d/yr ≥109°F today · 23 d/yr by 30 yrs out
- Wind 6/10 Major 27% chance of damaging wind over 30 yrs
- Air quality 2/10 Low 1 unhealthy d/yr today · 2 by 30 yrs out
Nearby sold comps map
Loading sold comps map…
Walkable amenities ~0.75 mi
Loading nearby amenities…
Taxation est. · year 1
- Rental income
- $20,959
- − Mortgage interest
- −$5,602
- − Property taxes
- −$2,401
- − Insurance
- −$5,618
- − Repairs & maintenance
- −$1,677
- − Management
- −$1,677
- − Depreciation
- −$2,909
- Taxable income
- $1,076
- Est. tax owed @ 24.0%
- −$258
- After-tax cash flow
- $1,987/yr
For passive investors: Depreciation is non-cash, so a rental often shows a tax loss while cash-flowing — sheltering income. Rental losses are passive: they offset passive income freely, and up to $25,000/yr can offset ordinary (W-2) income if you actively participate and your MAGI is under $100k (phasing out to $0 by $150k); unused losses carry forward. On sale, claimed depreciation is recaptured at up to 25%, and gains may owe capital-gains tax (a 1031 exchange can defer both). Figures are a year-1 estimate at your 24.0% rate — not tax advice; consult a CPA.
Schools (NCES district)
- District
- Cleburne ISD
- NCES district ID
- 4814310
- Math proficiency
- 34% ▼ -2.00%
- Reading proficiency
- 33% ▼ -2.00%
- Median HH income
- $48,788
- Composite
- 29.0/100
- National rank
- #6618
- State rank
- #537 of 826 in TX
Livability — Cleburne
- Score
- 68/100
- State rank
- #460
- US rank
- #9292
Category grades
Schools grade is shown separately in the Schools card above.
Census & demographics
- Census place
- Cleburne, TX
- City population
- 29,538
- Population (ZIP)
- 18,697
Population outlook (Johnson County) Hauer SSP2
- Today (2025)
- 179,678 people
- By 2030
- 189,208 · +5.3%
- By 2040
- 207,261 · +15.4%
- By 2050
- 223,064 · +24.1%
- By 2075
- 259,979 · +44.7%
- By 2100
- 275,395 · +53.3%
Race, ethnicity, and origin ACS 2023
- Neighborhood character
- Predominantly White (66%)
- Race & ethnicity
- White 66% Hispanic / Latino 28% Two or more races 12% Black 3%
- Hispanic origin (detail)
- Mexican 23% Puerto Rican 3%
- Common ancestry
- Italian 1% Lithuanian 1% Slovak 1%
- Foreign-born
- 5% · Canada, Vietnam
- Languages at home
- 77% English-only · Spanish 22% Vietnamese 0%
Political lean MEDSL · Johnson
- 2024 margin
- Solid R (+51.4) · D 23.9% · R 75.3%
- 2008→2024 swing
- -3.9pp toward R · 2008: -47.5pp · 2024: -51.4pp
- All cycles
- 2024: R+51.4 2020: R+53.0 2016: R+58.3 2012: R+55.6 2008: R+47.5
Not yet ingested
- Civics
- —
Market trends
- HPI YoY
- ▼ -59.43%
- Current HPI
- 277.598
- Rent YoY
- —
- Metro
- —
- State GDP YoY
- ▲ 3.95%
- F500 in state
- 110
Industry mix (Fortune 500 HQ in TX)
| Industry | F500 HQs | Revenue |
|---|---|---|
| Energy | 16 | $1,198B |
|
||
| Technology | 5 | $198B |
|
||
| Engineering / Construction | 4 | $72B |
|
||
| Energy Services | 3 | $60B |
|
||
| Utilities | 3 | $41B |
|
||
| Healthcare | 2 | $330B |
|
||
Price history
-23.1% since first listed7 events — show timeline
- 2026-05-05 Listed $100,000 NTREIS
- 2026-05-04 Listing Removed — NTREIS
- 2026-04-07 Price Changed $110,000 NTREIS
- 2026-03-25 Price Changed $98,000 NTREIS
- 2026-01-19 Price Changed $110,000 NTREIS
- 2025-11-30 Listed $130,000 NTREIS
- 1997-02-17 Sold (Public Records) — Public Records
Property tax history
+4.2%/yrLatest (2025): $2,401 · +11.7% YoY. Source: county tax records.
Cash-flow waterfall
monthlySold comps — $/sqft
last 12 mo · ≤1 miLoading sold comps…