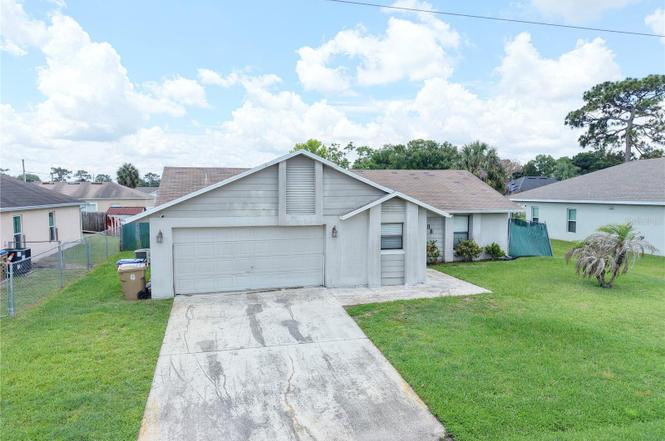
111 Nicholas Ct · Poinciana, FL
Flood risk 1/10 · Minimal
- FEMA flood zone
- X (unshaded)
- Chance of flooding over 30 yrs
- 0.0%
- Est. flood insurance / yr
- $507 – $1,088
Fire risk 4/10 · Minor
- Est. fire insurance / yr
- $947 – $1,759
Heat risk 9/10 · Severe
- Hot days now (above 108°F)
- 7 days/yr
- Hot days in 30 yrs
- 25 days/yr
Wind risk 9/10 · Severe
- Chance of severe wind over 30 yrs
- 99.0%
Air-quality risk 2/10 · Minimal
- Unhealthy air days now
- 0 days/yr
- Unhealthy air days in 30 yrs
- 1 days/yr
Risk factors via First Street. Map © Google.
Why this score? — see what drove the B grade
The composite is a weighted blend of 9 inputs, each scored 0–100. Each bar is that input's sub-score; the figure is the points it added to the 100-point composite (weight × sub-score).
- Cash flow +26.6/30.0
- ARV discount +15.0/15.0
- DSCR +9.1/10.0
- 1% rule +8.9/10.0
- Schools +3.6/10.0
- Livability +2.9/5.0
- Rent growth +2.7/5.0
- Condition / age +2.5/5.0
- Appreciation +0.0/10.0
$145,000
🖨 Deal sheet (PDF) 📄 Offer letter ✓ Due diligence
Listing remarks MLS
Freshly painted 1 year ago, new roof and tile floors.
Key facts
- 7,710 sq ft lot
- 2 garage spots
- Community pool
Tags
Property features AI
Finance
- Other: Property type: Residential (Single Family Residence); Zoning: OPUD
- Financial info: Monthly HOA amount: $100; Total monthly fees reported as $100 and total annual fees reported as $1,200; Lease restrictions apply
- HOA & community: Monthly HOA fee of $100 (association: Poinciana Villages/Dulce Maestry); Community pool; Pets allowed
Exterior
- Parking: Attached garage; 2-car garage
- Utilities: No water source specified; Public sewer; Other utilities
- Home design: Single family residence; One story; North-facing
- Construction: Block and wood siding construction; Shingle roof; Slab foundation; Built on 0.18-acre lot
- Exterior features: Other exterior features; Concrete road surface
Interior
- Kitchen: No appliances included
- Bedrooms: 3 bedrooms
- Flooring: Ceramic tile; Vinyl
- Bathrooms: 2 full bathrooms
- Heating & cooling: Central heating; Central air conditioning
- Interior features: Other interior features
- Laundry & utility: Laundry in garage
Neighborhood map
What this means for you Summary
Snapshot
- This is a 3-bed/2.0-bath single-family listed at $145k.
Deal economics
- At list price, monthly cash flow is $387 ($5k/yr) — positive.
- The deal already cash-flows at list — no discount required.
- Meets the 1% rule at list price ($2k rent vs $145k).
- Cap rate 9.5% vs local median 4.2% in Poinciana — top-decile yield for the area; either an underpriced asset or a hidden risk that comps aren't pricing in. Stress-test before assuming the spread holds.
Location & tenants
- Location reads 57/100 on livability (#859 in FL) — a working-class tenant base; expect higher turnover. Strengths: cost of living A+, housing A+; Watch: employment D+, amenities F, commute F.
- Osceola (suburban): math 39% / reading 45% proficiency, ranked #60 of 73 in FL (top 82%) — families likely to look elsewhere, expect single-tenant / working-renter base with shorter leases; 60% free/reduced lunch — lower-income household profile, screen leases tightly.
- Zoned schools: Poinciana Academy of Fine Arts (math 18% / reading 34%, grade F, #2,015 of 2,144 statewide, top 94%, 632 students, 66% FRL); Discovery Intermediate School (math 25% / reading 30%, grade F, #495 of 571 statewide, top 87%, 898 students, 62% FRL); Liberty High School (math 15% / reading 25%, grade F, #554 of 667 statewide, top 84%, 1,613 students, 52% FRL) — zoned schools at 60% FRL track the district average.
- Zoned-school proficiency averages 24% at this address vs 42% district-wide (-18 pts) — the specific schools serving this property underperform the Osceola average; the district grade overstates school quality for this exact location.
- Market conditions: Rents flat; 611 active listings in the ZIP; 40 comparable units currently listed for rent nearby; rentals leasing fast (median 12d on market — plan ~1-2 weeks tenant-placement turnaround); 8,813 units permitted in Osceola County in 2024 (3,072 in 5+ unit buildings).
- This rent runs 36% of the median local income ($66k/yr) — at the standard rent-burdened threshold; future hikes will face affordability resistance.
Forward outlook
- Local home prices are declining (-3.0%/yr); year-one equity from $1k of loan paydown is wiped out by about $4k of value loss. Plan a longer hold.
- Osceola County population projected at +73% by 2050 — long-run rental-demand tailwind backs the buy-and-hold thesis.
Negotiation context
- Only 3 days on market — expect competitive offers; lowballing is unlikely to land.
- 3 sale attempts since 21y ago with the ask held roughly flat each time — persistent listings suggest the price (not the market) is what's stuck; bring a comps-based counter.
- Current owner paid $84k; list at $145k implies a 73% gain — meaningful room to come down on a strong offer.
Risks & watch-outs
- Climate carrying-cost: severe wind risk, 99% chance of damaging wind over 30y; extreme-heat days projected 7→25/yr by 2055 (HVAC capex compounding) — expect insurance premiums to compound above CPI over the hold.
Questions for the listing agent
- What does the HOA fee cover, when was the last increase, and are there any pending special assessments or reserve-fund shortfalls?
- Is there a deadline driving the sale (1031 exchange, divorce, estate, relocation)? That informs how much negotiation room exists.
- Schools are F-rated, which usually means shorter tenancies and higher turnover. Who's the typical renter profile here, and what's been the actual vacancy rate?
- What's the average days-on-market for RENTAL listings here right now (not sales)? A rising rental-DOM trend means longer vacancies and softer asking-rent achievability than the comps imply.
- What's the recent tenant-quality profile in this submarket — average credit score on applications, eviction rate, late-payment / NSF rate, and stable-employment percentage? A property-management company in the area should have these aggregated.
- How much new for-sale + rental construction is in the pipeline within 1–3 miles? Heavy new supply typically softens prices + rents 12–24 months out; constrained supply supports both.
Investment metrics
- 1% rule
- 1.39% ✓
- Cap rate
- 9.49%
- Cash-on-cash
- 11.43%
- DSCR
- 1.51
- GRM
- 6.0
CMA / ARV
- ARV (on-the-fly)
- $244,536
- Comps found
- 12
Show comp detail 12 sales within ~0.75 mi
| Address | Dist | Beds/Ba | Sqft | Sold | Price | $/sf | Match |
|---|---|---|---|---|---|---|---|
| 237 Dalton Dr | 0.17mi | 3/2.0 | 1,348 (+1%) | 7mo | $125,000 | $93 | 84 |
| 49 Dorset Dr | 0.24mi | 3/2.0 | 1,332 (+0%) | 15mo | $285,000 | $214 | 76 |
| 52 York Ct | 0.48mi | 3/2.0 | 1,329 (0%) | 3mo | $225,000 | $169 | 75 |
| 909 Hendon Pl | 0.42mi | 3/2.0 | 1,372 (+3%) | 2mo | $300,000 | $219 | 73 |
| 52 Dorset Dr | 0.22mi | 3/2.0 | 1,449 (+9%) | 2mo | $316,600 | $218 | 73 |
| 107 Whitehall Way | 0.39mi | 3/2.0 | 1,256 (-6%) | 5mo | $227,000 | $181 | 68 |
| 904 San Carlos Way | 0.38mi | 3/2.0 | 1,435 (+8%) | 5mo | $250,000 | $174 | 64 |
| 313 Greenwich Ct | 0.34mi | 3/2.0 | 1,465 (+10%) | 11mo | $270,000 | $184 | 58 |
| 920 San Carlos Way | 0.38mi | 3/2.0 | 1,499 (+13%) | 8mo | $245,000 | $163 | 54 |
| 149 Birmingham Dr | 0.52mi | 3/2.0 | 1,448 (+9%) | 12mo | $250,000 | $173 | 51 |
| 916 Derbyshire Dr | 0.40mi | 3/2.0 | 1,166 (-12%) | 13mo | $250,000 | $214 | 50 |
| 2 Peterlee Ct | 0.59mi | 3/2.0 | 1,428 (+7%) | 16mo | $269,000 | $188 | 47 |
Match score weights: distance 35% · size 25% · config 20% · recency 20%. Top-matched comps best support the ARV.
Projected returns pro-forma
-3.0% appreciation · 0.82% rent growth · sell at horizon
- IRR
- -2.0%
- Equity multiple
- 0.93×
- Total profit
- $-3,023
- Equity at exit
- $21,620
- IRR
- 4.8%
- Equity multiple
- 1.31×
- Total profit
- $12,750
- Equity at exit
- $12,537
Cash invested: $40,600 (down + closing). Projections, not guarantees.
Landlord ↔ Tenant lean methodology
- Overall (STATE)
- 87 Strongly Landlord-Friendly
- State Florida
- 87 Strongly Landlord-Friendly · R+3
- County
- — inherits STATE
- City
- — inherits STATE
ZIP-level market 34758
- Home prices YoY
- -14.3%
- Rents YoY
- 0.8%
- Active inventory
- 611
- Price-to-rent
- 6.0×
Monthly cashflow live
- Estimated rent
- $2,013 high interval (Pro) →
- Mortgage (P&I)
- −$760
- Tax from tax record
- −$282 /mo · $3,388/yr
- Insurance
- −$60
- HOA
- −$100
- Vacancy / Maint / Mgmt
- −$423
- Net cashflow
- $387
Break-even live
Sensitivity live
| Price | -10% $469 | -5% $428 | +0% $387 | +5% $346 | +10% $305 |
|---|---|---|---|---|---|
| Rent | -10% $228 | -5% $307 | +0% $387 | +5% $466 | +10% $546 |
| Rate | -1.0pp $460 | -0.5pp $424 | base $387 | +0.5pp $349 | +1.0pp $311 |
UW: 25.0% down · 7.5% · 30yr · 1.5% tax · 5.0% vac · 8.0% maint · 8.0% mgmt
Financing live
Cash to close
- Down payment
- $36,250
- Closing costs
- $4,350
- Reserves months
- —
- Total cash needed
- —
Loan-product check · same deal, 3 products live
Conventional
25% down · 7.5% · 30yr
- Down + closing
- —
- Monthly P&I
- —
- Monthly cashflow
- —
- DSCR
- —
- Eligible?
- —
Personal DTI + credit; lowest rate.
DSCR
20% down · 8.5% · 30yr
- Down + closing
- —
- Monthly P&I
- —
- Monthly cashflow
- —
- DSCR
- —
- Eligible?
- —
No personal income docs; deal must DSCR.
Hard money
10% down · 12.0% · 12mo
- Down + closing
- —
- Monthly P&I
- —
- Monthly cashflow
- —
- DSCR
- —
- Eligible?
- —
Short-term bridge; refi at stabilization.
Rent comps 40 comps
| Address | Beds | Baths | Sqft | Rent | $/sqft | DOM | Units | Dist |
|---|---|---|---|---|---|---|---|---|
| 143 Dorchester Ct Kissimmee, FL | 3.0 | 2.0 | 1329 | $1,644 | $1.24 | 0d | 1 | 0.04mi |
| 117 Dorchester Ct Kissimmee, FL | 3.0 | 2.0 | 1705 | $2,010 | $1.18 | 6d | 1 | 0.09mi |
| 7 Dorset Dr Kissimmee, FL | 3.0 | 2.0 | 1329 | $1,650 | $1.24 | 19d | 1 | 0.14mi |
| 240 Grifford Dr Kissimmee, FL | 3.0 | 2.0 | 1194 | $1,720 | $1.44 | 9d | 1 | 0.19mi |
| 126 Briarcliff Dr Kissimmee, FL | 4.0 | 2.0 | 1661 | $1,965 | $1.18 | 0d | 1 | 0.19mi |
| 131 Barrington Dr Kissimmee, FL | 4.0 | 2.0 | 1670 | $2,250 | $1.35 | 25d | 1 | 0.28mi |
| 122 Barrington Dr Kissimmee, FL | 3.0 | 2.0 | 1472 | $1,819 | $1.24 | 0d | 1 | 0.30mi |
| 201 Great Yarmouth Ct Kissimmee, FL | 4.0 | 2.0 | 1866 | $2,500 | $1.34 | 12d | 1 | 0.31mi |
| 812 Glastonbury Dr Kissimmee, FL | 3.0 | 2.0 | 1143 | $1,700 | $1.49 | 5d | 1 | 0.37mi |
| 906 Dartmouth Ct Kissimmee, FL | 4.0 | 2.0 | 1660 | $1,909 | $1.15 | 4d | 1 | 0.40mi |
| 929 Gateshead Ct Kissimmee, FL | 3.0 | 2.0 | 1532 | $1,795 | $1.17 | 0d | 1 | 0.43mi |
| 820 Grantham Dr Kissimmee, FL | 3.0 | 2.0 | 1383 | $2,300 | $1.66 | 25d | 1 | 0.46mi |
| 939 Stockport Dr Kissimmee, FL | 4.0 | 2.0 | 1872 | $1,999 | $1.07 | 6d | 1 | 0.47mi |
| 939 Halifax Dr Kissimmee, FL | 3.0 | 2.0 | 1474 | $1,650 | $1.12 | 25d | 1 | 0.48mi |
| 907 Salerno Ct Kissimmee, FL | 3.0 | 1.0 | 1100 | $1,799 | $1.64 | 25d | 1 | 0.49mi |
| 919 Cumbran Ln Kissimmee, FL | 4.0 | 2.0 | 1691 | $1,890 | $1.12 | 12d | 1 | 0.52mi |
| 919 Cumbran Ln Kissimmee, FL | 4.0 | 2.0 | 1691 | $1,890 | $1.12 | 25d | 1 | 0.52mi |
| 818 San Jose Ct Kissimmee, FL | 3.0 | 2.0 | 1208 | $1,690 | $1.40 | 19d | 1 | 0.53mi |
| 826 San Jose Ct Kissimmee, FL | 4.0 | 2.0 | 1820 | $2,110 | $1.16 | 16d | 1 | 0.58mi |
| 611 Baldwin Dr Kissimmee, FL | 3.0 | 2.0 | 1334 | $1,950 | $1.46 | 4d | 1 | 0.61mi |
| 501 Bristol Cir Kissimmee, FL | 4.0 | 2.0 | 1670 | $2,260 | $1.35 | 21d | 1 | 0.64mi |
| 913 San Rafael Way Kissimmee, FL | 3.0 | 2.0 | 1329 | $1,800 | $1.35 | 9d | 1 | 0.66mi |
| 37 Peterlee Ct Kissimmee, FL | 3.0 | 2.0 | 1440 | $1,700 | $1.18 | 19d | 1 | 0.66mi |
| 220 Canterbury Ct Kissimmee, FL | 3.0 | 2.0 | 1424 | $1,650 | $1.16 | 25d | 1 | 0.69mi |
| 220 Canterbury Ct Kissimmee, FL | 3.0 | 2.0 | 1424 | $1,700 | $1.19 | 9d | 1 | 0.69mi |
| 250 Canterbury Ct Kissimmee, FL | 4.0 | 2.0 | 1704 | $1,919 | $1.13 | 25d | 1 | 0.78mi |
| 604 Basingstoke Ct Kissimmee, FL | 3.0 | 2.0 | 1739 | $1,945 | $1.12 | 25d | 1 | 0.80mi |
| 651 Mercado Ct Kissimmee, FL | 4.0 | 2.0 | 1661 | $1,975 | $1.19 | 5d | 1 | 0.82mi |
| 232 Cobalt Dr Kissimmee, FL | 3.0 | 2.0 | 1609 | $1,890 | $1.17 | 3d | 1 | 0.84mi |
| 1126 Chichester Ct Kissimmee, FL | 4.0 | 2.0 | 1872 | $2,500 | $1.34 | 25d | 1 | 0.85mi |
| 662 Brockton Dr Kissimmee, FL | 4.0 | 2.0 | 1632 | $1,920 | $1.18 | 3d | 1 | 0.86mi |
| 662 Brockton Dr Kissimmee, FL | 3.0 | 2.0 | 1632 | $1,920 | $1.18 | 25d | 1 | 0.86mi |
| 624 Mercado Ct Kissimmee, FL | 4.0 | 2.0 | 1665 | $2,400 | $1.44 | 25d | 1 | 0.88mi |
| 205 Churchill Ct Kissimmee, FL | 3.0 | 2.0 | 1444 | $1,700 | $1.18 | 0d | 1 | 0.90mi |
| 295 Cobalt Dr Kissimmee, FL | 2.0 | 2.0 | 1323 | $1,600 | $1.21 | 25d | 1 | 0.91mi |
| 211 Cobalt Dr Kissimmee, FL | 3.0 | 2.0 | 1406 | $1,830 | $1.30 | 25d | 1 | 0.95mi |
| 433 Bloomfield Dr Kissimmee, FL | 4.0 | 2.0 | 1814 | $2,120 | $1.17 | 0d | 1 | 0.95mi |
| 1141 Doncaster Ct Kissimmee, FL | 3.0 | 2.0 | 1161 | $1,719 | $1.48 | 4d | 1 | 0.98mi |
| 1109 Cambourne Dr Kissimmee, FL | 3.0 | 2.0 | 1068 | $1,495 | $1.40 | 15d | 1 | 0.98mi |
| 402 Bridgewater Ct Kissimmee, FL | 4.0 | 3.0 | 1510 | $1,700 | $1.13 | 0d | 1 | 1.01mi |
HOA detail
- Monthly dues
- $100 · $1,200/yr
Listing history 4 events
-
2026-06-18days on market $145,000 Active 3 DOM
-
2026-06-17days on market $145,000 Active 2 DOM
-
2026-06-15remarks 699-char remark
-
2026-06-15$145,000 Active 1 DOM
ⓘ Source: listings_history table (triggers on properties + properties_extension) + one-shot
backfill from property_details.listing_events for pre-trigger history.
Tax reassessment forecast FL · Resets to sale price
- Current annual tax
- $3,388 · $282/mo
- Projected year-2 tax
- $3,388 · $282/mo
- Expected delta
- $0/yr ($0/mo · 0.0%)
ⓘ Screening estimate from a state-policy table — verify with the county assessor before closing.
Climate risk First Street
- Flood 1/10 Low FEMA zone X (unshaded) · 0% chance over 30 yrs
- Wildfire 4/10 Moderate
- Heat 9/10 Extreme 7 d/yr ≥108°F today · 25 d/yr by 30 yrs out
- Wind 9/10 Extreme 99% chance of damaging wind over 30 yrs
- Air quality 2/10 Low 0 unhealthy d/yr today · 1 by 30 yrs out
Nearby sold comps map
Loading sold comps map…
Walkable amenities ~0.75 mi
Loading nearby amenities…
Taxation est. · year 1
- Rental income
- $24,152
- − Mortgage interest
- −$8,122
- − Property taxes
- −$3,388
- − Insurance
- −$725
- − Repairs & maintenance
- −$1,932
- − Management
- −$1,932
- − HOA
- −$1,200
- − Depreciation
- −$4,218
- Taxable income
- $2,634
- Est. tax owed @ 24.0%
- −$632
- After-tax cash flow
- $4,010/yr
For passive investors: Depreciation is non-cash, so a rental often shows a tax loss while cash-flowing — sheltering income. Rental losses are passive: they offset passive income freely, and up to $25,000/yr can offset ordinary (W-2) income if you actively participate and your MAGI is under $100k (phasing out to $0 by $150k); unused losses carry forward. On sale, claimed depreciation is recaptured at up to 25%, and gains may owe capital-gains tax (a 1031 exchange can defer both). Figures are a year-1 estimate at your 24.0% rate — not tax advice; consult a CPA.
Schools (NCES district)
- District
- Osceola
- NCES district ID
- 1201470
- Math proficiency
- 39% ▼ -9.00%
- Reading proficiency
- 45% ▼ -4.00%
- Median HH income
- $45,528
- Composite
- 35.7/100
- National rank
- #4865
- State rank
- #60 of 73 in FL
Livability — Poinciana
- Score
- 57/100
- State rank
- #859
- US rank
- #21760
Category grades
Schools grade is shown separately in the Schools card above.
Census & demographics
- Census place
- Poinciana, FL
- County
- Osceola County · 410,217 people
- City population
- 91,336
- Metro
- Orlando-Kissimmee-Sanford, FL
- Population (ZIP)
- 46,768
- Household income
- $66,339
- Rent vs Own
- Severe rent burden
- 1302.0
Population outlook (Osceola County) Hauer SSP2
- Today (2025)
- 447,624 people
- By 2030
- 511,823 · +14.3%
- By 2040
- 642,986 · +43.6%
- By 2050
- 774,552 · +73.0%
- By 2075
- 1,078,144 · +140.9%
- By 2100
- 1,269,660 · +183.6%
Race, ethnicity, and origin ACS 2023
- Neighborhood character
- Diverse neighborhood (Simpson 0.58)
- Race & ethnicity
- Hispanic / Latino 60% Black 22% Two or more races 16% White 13% Asian 1%
- Hispanic origin (detail)
- Mexican 1% Puerto Rican 36% Cuban 3% Dominican 7%
- Common ancestry
- Hispanic 8% Romanian 1%
- Foreign-born
- 24% · Canada, Jamaica
- Languages at home
- 42% English-only · Spanish 48% French/Haitian/Cajun 7% Arabic 1%
Political lean MEDSL · Osceola
- 2024 margin
- Toss-up / Even · D 48.7% · R 50.2% · Other 1.1%
- 2008→2024 swing
- -21.2pp toward R · 2008: 19.7pp · 2024: -1.4pp
- All cycles
- 2024: R+1.4 2020: D+13.8 2016: D+25.0 2012: D+24.5 2008: D+19.7
Not yet ingested
- Civics
- —
Market trends
- HPI YoY
- ▼ -49.53%
- Current HPI
- 295.8928
- Rent YoY
- ▲ 0.82%
- Metro
- Orlando-Kissimmee-Sanford, FL
- State GDP YoY
- ▲ 3.28%
- F500 in state
- 36
Industry mix (Fortune 500 HQ in FL)
| Industry | F500 HQs | Revenue |
|---|---|---|
| Industrial Technology | 2 | $29B |
|
||
| Insurance | 2 | $17B |
|
||
| Retail | 1 | $60B |
|
||
| Technology Distribution | 1 | $58B |
|
||
| Homebuilding | 1 | $35B |
|
||
| Technology Manufacturing | 1 | $35B |
|
||
Price history
+126.6% since first listed13 events — show timeline
- 2026-06-15 Listed $145,000 Stellar MLS as Distributed by MLS Grid
- 2015-11-20 Sold (Public Records) $84,000 Public Records
- 2015-01-19 Pending — Stellar MLS as Distributed by MLS Grid
- 2015-01-17 Listing Removed — Stellar MLS as Distributed by MLS Grid
- 2014-10-27 Price Changed $88,900 Stellar MLS as Distributed by MLS Grid
- 2014-10-08 Price Changed $94,900 Stellar MLS as Distributed by MLS Grid
- 2014-09-18 Price Changed $99,900 Stellar MLS as Distributed by MLS Grid
- 2014-09-08 Price Changed $109,900 Stellar MLS as Distributed by MLS Grid
- 2014-08-06 Listed $117,500 Stellar MLS as Distributed by MLS Grid
- 2006-04-10 Sold (Public Records) $189,900 Public Records
- 2006-04-07 Sold (MLS) $189,900 Stellar MLS as Distributed by MLS Grid
- 2005-09-02 Listed $191,000 Stellar MLS as Distributed by MLS Grid
- 1995-08-07 Sold (Public Records) $64,000 Public Records
Property tax history
+12.7%/yrLatest (2025): $3,388 · +7.4% YoY. Source: county tax records.
Cash-flow waterfall
monthlySold comps — $/sqft
last 12 mo · ≤1 miLoading sold comps…