 Multi-family
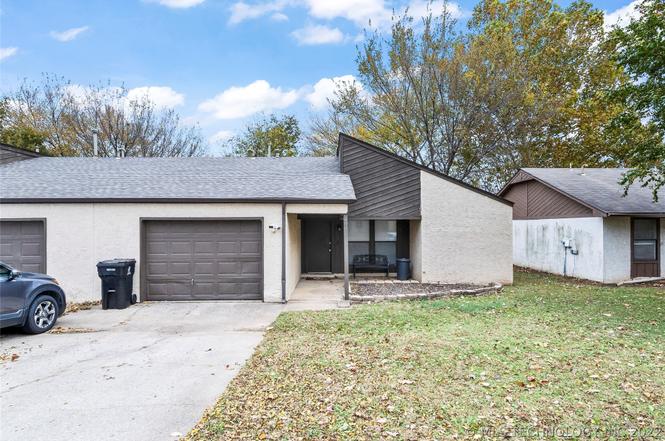
4901 S Hickory Ave · Broken Arrow, OK
Flood risk 1/10 · Minimal
- FEMA flood zone
- X (unshaded)
- Chance of flooding over 30 yrs
- 0.0%
- Est. flood insurance / yr
- $473 – $860
Fire risk 4/10 · Minor
- Est. fire insurance / yr
- $2,463 – $4,575
Heat risk 7/10 · Major
- Hot days now (above 111°F)
- 7 days/yr
- Hot days in 30 yrs
- 18 days/yr
Wind risk 3/10 · Minor
- Chance of severe wind over 30 yrs
- 4.0%
Air-quality risk 2/10 · Minimal
- Unhealthy air days now
- 1 days/yr
- Unhealthy air days in 30 yrs
- 1 days/yr
Risk factors via First Street. Map © Google.
Why this score? — see what drove the C- grade
The composite is a weighted blend of 9 inputs, each scored 0–100. Each bar is that input's sub-score; the figure is the points it added to the 100-point composite (weight × sub-score).
- Cash flow +24.2/30.0
- DSCR +7.8/10.0
- 1% rule +5.8/10.0
- Livability +3.9/5.0
- Rent growth +3.5/5.0
- Condition / age +2.5/5.0
- Schools +2.4/10.0
- ARV discount +0.0/15.0
- Appreciation +0.0/10.0
$320,000
🖨 Deal sheet (PDF) 📄 Offer letter ✓ Due diligence
Multi-family units
County records classify this as Multi-Family (2-4 Unit). Listing-text estimate: 1 unit. estimate disagrees with records
Listing remarks MLS
Great investors property! Fully occupied and stabilized investment duplex in South Broken Arrow. 3 bedroom/2 bath for each unit (4901/4903), attached garage, nice backyard and just a half mile away from the Creek Turnpike with for quick access to Tulsa. Coming Soon, no showings or offers til 11/21/2021.
Key facts
- Investment property
- Good size backyard
- Fully occupied
Tags
Property features AI
Exterior
- Parking: Attached garage (1 car)
- Security: Smoke detector(s); No safety shelter
- Utilities: Public water; Public sewer; Utilities listed as unknown for other services
- Home design: Single-story home; Faces west; Slab foundation
- Construction: Built using brick, stone, and wood frame; Asphalt/fiberglass roof
- Exterior features: Satellite dish; Chain link and privacy fencing
Interior
- Kitchen: Oven/Range/Stove; Dishwasher; Garbage disposal
- Bedrooms: Master bedroom with private bath and separate closets (First floor); Additional bedrooms (First floor)
- Flooring: Carpet
- Bathrooms: Two full bathrooms (including a master bath and a hall bath)
- Heating & cooling: Central heating (gas); Central air conditioning
- Interior features: Laminate countertops; Smoke detector(s)
- Laundry & utility: Gas water heater
Neighborhood map
What this means for you Summary
Snapshot
- This is a 3-bed/4.0-bath multifamily listed at $320k.
Deal economics
- At list price, monthly cash flow is $636 ($8k/yr) — positive.
- The deal already cash-flows at list — no discount required.
- Meets the 1% rule at list price ($3k rent vs $320k).
- Recommended offer: $301k (6.0% below list) — sets the bar for market timing.
- Cap rate 8.7% vs local median 4.0% in Broken Arrow — top-decile yield for the area; either an underpriced asset or a hidden risk that comps aren't pricing in. Stress-test before assuming the spread holds.
Location & tenants
- Location reads 78/100 on livability (#7 in OK, #2,691 nationally) — a middle-class / working-renter tenant base. Strengths: commute A+, cost of living A+, housing A+; Watch: amenities F.
- Broken Arrow (suburban): math 23% / reading 28% proficiency, ranked #79 of 270 in OK (top 29%) — low school quality limits family demand, transient renter base, plan for 1-2y turnover.
- Zoned schools: Aspen Creek Es (math 23% / reading 22%, grade F, #409 of 845 statewide, top 49%, 628 students, 0% FRL); Childers Ms (math 16% / reading 28%, grade F, #129 of 345 statewide, top 42%, 796 students, 0% FRL); Broken Arrow Hs (math 22% / reading 36%, grade F, #120 of 447 statewide, top 27%, 4,589 students, 0% FRL) — zoned schools average 0% FRL vs 33% district-wide (33 pts lower); this property's tenant base skews higher-income than the district average.
- Market conditions: Rents rising fast (+4.1%/yr); 385 active listings in the ZIP; 4 comparable units currently listed for rent nearby; rentals at typical pace (median 23d on market — plan ~3-4 weeks tenant-placement turnaround); solid renter incomes; 2,818 units permitted in Tulsa County in 2024 (518 in 5+ unit buildings).
- This rent runs 42% of the median local income ($99k/yr) — at the standard rent-burdened threshold; future hikes will face affordability resistance.
Forward outlook
- Local home prices are declining (-3.0%/yr); year-one equity from $2k of loan paydown is wiped out by about $10k of value loss. Plan a longer hold.
- Tulsa County population projected at +30% by 2050 — long-run rental-demand tailwind backs the buy-and-hold thesis.
Negotiation context
- It's been on market 73 days — a 6% lower offer ($301k) is reasonable based on typical stale-listing flexibility.
- 3 sale attempts since 5y ago; this cycle's ask has dropped $40k (11%) from the opening price — seller is motivated, your offer sets the floor, not the list.
- Current owner paid $240k; 33% above their basis — modest negotiation headroom, anchor on the comps not their cost.
Risks & watch-outs
- Climate carrying-cost: extreme-heat days projected 7→18/yr by 2055 (HVAC capex compounding) — expect insurance premiums to compound above CPI over the hold.
Questions for the listing agent
- It's been on market 73 days. Have you received any prior offers? Is the seller open to a 6% concession, seller financing, or rate buy-down credit?
- Why hasn't it sold? Are there any deal-killer items the seller is aware of (foundation, flood, title, zoning, code violations)?
- Is there a deadline driving the sale (1031 exchange, divorce, estate, relocation)? That informs how much negotiation room exists.
- Schools are D-rated, which usually means shorter tenancies and higher turnover. Who's the typical renter profile here, and what's been the actual vacancy rate?
- What's the average days-on-market for RENTAL listings here right now (not sales)? A rising rental-DOM trend means longer vacancies and softer asking-rent achievability than the comps imply.
- What's the recent tenant-quality profile in this submarket — average credit score on applications, eviction rate, late-payment / NSF rate, and stable-employment percentage? A property-management company in the area should have these aggregated.
- How much new apartment / multifamily construction is in the pipeline within 1–3 miles? Heavy new supply (>2% of stock underway) typically softens rents 12–24 months out; light construction supports rent growth.
Investment metrics
- 1% rule
- 1.08% ✓
- Cap rate
- 8.68%
- Cash-on-cash
- 8.51%
- DSCR
- 1.38
- GRM
- 7.7
CMA / ARV
- ARV (on-the-fly)
- $243,288
- Comps found
- 1
Show comp detail 1 sale within ~0.75 mi
| Address | Dist | Beds/Ba | Sqft | Sold | Price | $/sf | Match |
|---|---|---|---|---|---|---|---|
| 4421 S Gum Ave | 0.42mi | 3/2.0 | 2,430 (+9%) | 22mo | $263,900 | $109 | 40 |
Match score weights: distance 35% · size 25% · config 20% · recency 20%. Top-matched comps best support the ARV.
Projected returns pro-forma
-3.0% appreciation · 4.09% rent growth · sell at horizon
- IRR
- -2.2%
- Equity multiple
- 0.92×
- Total profit
- $-7,554
- Equity at exit
- $47,713
- IRR
- 8.6%
- Equity multiple
- 1.69×
- Total profit
- $61,552
- Equity at exit
- $27,668
Cash invested: $89,600 (down + closing). Projections, not guarantees.
Landlord ↔ Tenant lean methodology
- Overall (STATE)
- 83 Strongly Landlord-Friendly
- State Oklahoma
- 83 Strongly Landlord-Friendly · R+20
- County
- — inherits STATE
- City
- — inherits STATE
ZIP-level market 74011
- Rents YoY
- 4.1%
- Active inventory
- 385
- Price-to-rent
- 15.4×
Monthly cashflow live
- Estimated rent
- $3,456 high interval (Pro) →
- Mortgage (P&I)
- −$1,678
- Tax from tax record
- −$283 /mo · $3,397/yr
- Insurance
- −$133
- HOA
- −$0
- Vacancy / Maint / Mgmt
- −$726
- Net cashflow
- $636
Break-even live
Sensitivity live
| Price | -10% $817 | -5% $726 | +0% $636 | +5% $545 | +10% $455 |
|---|---|---|---|---|---|
| Rent | -10% $363 | -5% $499 | +0% $636 | +5% $772 | +10% $909 |
| Rate | -1.0pp $797 | -0.5pp $717 | base $636 | +0.5pp $553 | +1.0pp $468 |
2-unit breakdown (identical units grouped — click to expand)
| Units | Beds | Baths | Est. rent |
|---|---|---|---|
| 2× units | 3 | 2 | $3,456 |
| #1 | 3 | 2 | $1,728 |
| #2 | 3 | 2 | $1,728 |
| Total (2 units) | $3,456 | ||
UW: 25.0% down · 7.5% · 30yr · 1.5% tax · 5.0% vac · 8.0% maint · 8.0% mgmt
Financing live
Cash to close
- Down payment
- $80,000
- Closing costs
- $9,600
- Reserves months
- —
- Total cash needed
- —
Loan-product check · same deal, 3 products live
Conventional
25% down · 7.5% · 30yr
- Down + closing
- —
- Monthly P&I
- —
- Monthly cashflow
- —
- DSCR
- —
- Eligible?
- —
Personal DTI + credit; lowest rate.
DSCR
20% down · 8.5% · 30yr
- Down + closing
- —
- Monthly P&I
- —
- Monthly cashflow
- —
- DSCR
- —
- Eligible?
- —
No personal income docs; deal must DSCR.
Hard money
10% down · 12.0% · 12mo
- Down + closing
- —
- Monthly P&I
- —
- Monthly cashflow
- —
- DSCR
- —
- Eligible?
- —
Short-term bridge; refi at stabilization.
Rent comps 4 comps
| Address | Beds | Baths | Sqft | Rent | $/sqft | DOM | Units | Dist |
|---|---|---|---|---|---|---|---|---|
| 4325 S Ash Ave Broken Arrow, OK | 4.0 | 2.0 | 1400 | $1,578 | $1.13 | 23d | 1 | 0.82mi |
| 4308 S Walnut Ave Broken Arrow, OK | 3.0 | 2.5 | 2659 | $2,400 | $0.90 | 25d | 1 | 0.89mi |
| 4623 S Chestnut Ave Broken Arrow, OK | 4.0 | 3.0 | 2023 | $3,800 | $1.88 | 21d | 1 | 0.94mi |
| 6308 S 1st Pl Broken Arrow, OK | 3.0 | 2.0 | 1600 | $3,400 | $2.12 | 18d | 1 | 1.06mi |
Listing history 16 events
-
2026-05-08status Pending
-
2026-04-22price $320,000
-
2026-04-03price $330,000
-
2026-03-09price $340,000
-
2026-02-23$360,000 Active
-
2025-09-14historical $1,200
-
2025-09-03price $1,200
-
2025-08-18$1,300
-
2021-12-20soldstatus $240,000
-
2021-12-14soldstatus $240,000 Closed 304-char remark
Show marketing remark (304 chars)
Great investors property! Fully occupied and stabilized investment duplex in South Broken Arrow. 3 bedroom/2 bath for each unit (4901/4903), attached garage, nice backyard and just a half mile away from the Creek Turnpike with for quick access to Tulsa. Coming Soon, no showings or offers til 11/21/2021.
-
2021-11-24status Pending 304-char remark
Show marketing remark (304 chars)
Great investors property! Fully occupied and stabilized investment duplex in South Broken Arrow. 3 bedroom/2 bath for each unit (4901/4903), attached garage, nice backyard and just a half mile away from the Creek Turnpike with for quick access to Tulsa. Coming Soon, no showings or offers til 11/21/2021.
-
2021-11-19$235,000 Active 304-char remark
Show marketing remark (304 chars)
Great investors property! Fully occupied and stabilized investment duplex in South Broken Arrow. 3 bedroom/2 bath for each unit (4901/4903), attached garage, nice backyard and just a half mile away from the Creek Turnpike with for quick access to Tulsa. Coming Soon, no showings or offers til 11/21/2021.
-
2020-09-09soldstatus $165,000
-
2020-09-09soldstatus $165,000
-
2018-01-02soldstatus $150,000
-
2003-05-02soldstatus $138,500
ⓘ Source: listings_history table (triggers on properties + properties_extension) + one-shot
backfill from property_details.listing_events for pre-trigger history.
Tax reassessment forecast OK · Resets to sale price
- Current annual tax
- $3,397 · $283/mo
- Projected year-2 tax
- $3,397 · $283/mo
- Expected delta
- $0/yr ($0/mo · 0.0%)
ⓘ Screening estimate from a state-policy table — verify with the county assessor before closing.
Climate risk First Street
- Flood 1/10 Low FEMA zone X (unshaded) · 0% chance over 30 yrs
- Wildfire 4/10 Moderate
- Heat 7/10 Severe 7 d/yr ≥111°F today · 18 d/yr by 30 yrs out
- Wind 3/10 Moderate 4% chance of damaging wind over 30 yrs
- Air quality 2/10 Low 1 unhealthy d/yr today · 1 by 30 yrs out
Nearby sold comps map
Loading sold comps map…
Walkable amenities ~0.75 mi
Loading nearby amenities…
Taxation est. · year 1
- Rental income
- $41,472
- − Mortgage interest
- −$17,925
- − Property taxes
- −$3,397
- − Insurance
- −$1,600
- − Repairs & maintenance
- −$3,318
- − Management
- −$3,318
- − Depreciation
- −$9,309
- Taxable income
- $2,605
- Est. tax owed @ 24.0%
- −$625
- After-tax cash flow
- $7,003/yr
For passive investors: Depreciation is non-cash, so a rental often shows a tax loss while cash-flowing — sheltering income. Rental losses are passive: they offset passive income freely, and up to $25,000/yr can offset ordinary (W-2) income if you actively participate and your MAGI is under $100k (phasing out to $0 by $150k); unused losses carry forward. On sale, claimed depreciation is recaptured at up to 25%, and gains may owe capital-gains tax (a 1031 exchange can defer both). Figures are a year-1 estimate at your 24.0% rate — not tax advice; consult a CPA.
Schools (NCES district)
- District
- Broken Arrow
- NCES district ID
- 4005490
- Math proficiency
- 23% ▼ -9.00%
- Reading proficiency
- 28% ▼ -9.00%
- Median HH income
- $64,646
- Composite
- 23.86/100
- National rank
- #7801
- State rank
- #79 of 270 in OK
Livability — Broken Arrow
- Score
- 78/100
- State rank
- #7
- US rank
- #2691
Category grades
Schools grade is shown separately in the Schools card above.
Census & demographics
- Census place
- Broken Arrow, OK
- County
- Tulsa County · 640,811 people
- City population
- 144,172
- Metro
- Tulsa, OK
- Population (ZIP)
- 33,900
- Household income
- $99,157
- Rent vs Own
- Severe rent burden
- 389.0
Population outlook (Tulsa County) Hauer SSP2
- Today (2025)
- 723,846 people
- By 2030
- 766,033 · +5.8%
- By 2040
- 851,386 · +17.6%
- By 2050
- 938,389 · +29.6%
- By 2075
- 1,166,011 · +61.1%
- By 2100
- 1,350,277 · +86.5%
Race, ethnicity, and origin ACS 2023
- Neighborhood character
- Predominantly White (68%)
- Race & ethnicity
- White 68% Two or more races 15% Hispanic / Latino 10% Native American 4% Black 4% Asian 3%
- Hispanic origin (detail)
- Mexican 7%
- Common ancestry
- Lithuanian 3% Serbian 2% Slovak 2%
- Foreign-born
- 5% · Canada
- Languages at home
- 93% English-only · Spanish 5% Other Asian/Pacific 1%
Political lean MEDSL · Tulsa
- 2024 margin
- R (+15.2) · D 41.3% · R 56.5% · Other 2.2%
- 2008→2024 swing
- +9.2pp toward D · 2008: -24.5pp · 2024: -15.2pp
- All cycles
- 2024: R+15.2 2020: R+15.6 2016: R+22.9 2012: R+27.4 2008: R+24.5
Not yet ingested
- Civics
- —
Market trends
- HPI YoY
- ▼ -180.15%
- Current HPI
- 210.8302
- Rent YoY
- ▲ 4.09%
- Metro
- Tulsa, OK
- State GDP YoY
- ▲ 1.55%
- F500 in state
- 6
Industry mix (Fortune 500 HQ in OK)
| Industry | F500 HQs | Revenue |
|---|---|---|
| Energy | 3 | $48B |
|
||
Price history
+131.0% since first listed16 events — show timeline
- 2026-05-08 Pending — MLS Technology, Inc.
- 2026-04-22 Price Changed $320,000 MLS Technology, Inc.
- 2026-04-03 Price Changed $330,000 MLS Technology, Inc.
- 2026-03-09 Price Changed $340,000 MLS Technology, Inc.
- 2026-02-23 Listed $360,000 MLS Technology, Inc.
- 2025-09-14 Rental Removed $1,200 APPFOLIO
- 2025-09-03 Price Changed $1,200 APPFOLIO
- 2025-08-18 Listed for Rent $1,300 APPFOLIO
- 2021-12-20 Sold (Public Records) $240,000 Public Records
- 2021-12-14 Sold (MLS) $240,000 MLS Technology, Inc.
- 2021-11-24 Pending — MLS Technology, Inc.
- 2021-11-19 Listed $235,000 MLS Technology, Inc.
- 2020-09-09 Sold (Public Records) $165,000 Public Records
- 2020-09-09 Sold (Public Records) $165,000 Public Records
- 2018-01-02 Sold (Public Records) $150,000 Public Records
- 2003-05-02 Sold (Public Records) $138,500 Public Records
Property tax history
+5.0%/yrLatest (2025): $3,397 · -0.1% YoY. Source: county tax records.
Cash-flow waterfall
monthlySold comps — $/sqft
last 12 mo · ≤1 miLoading sold comps…