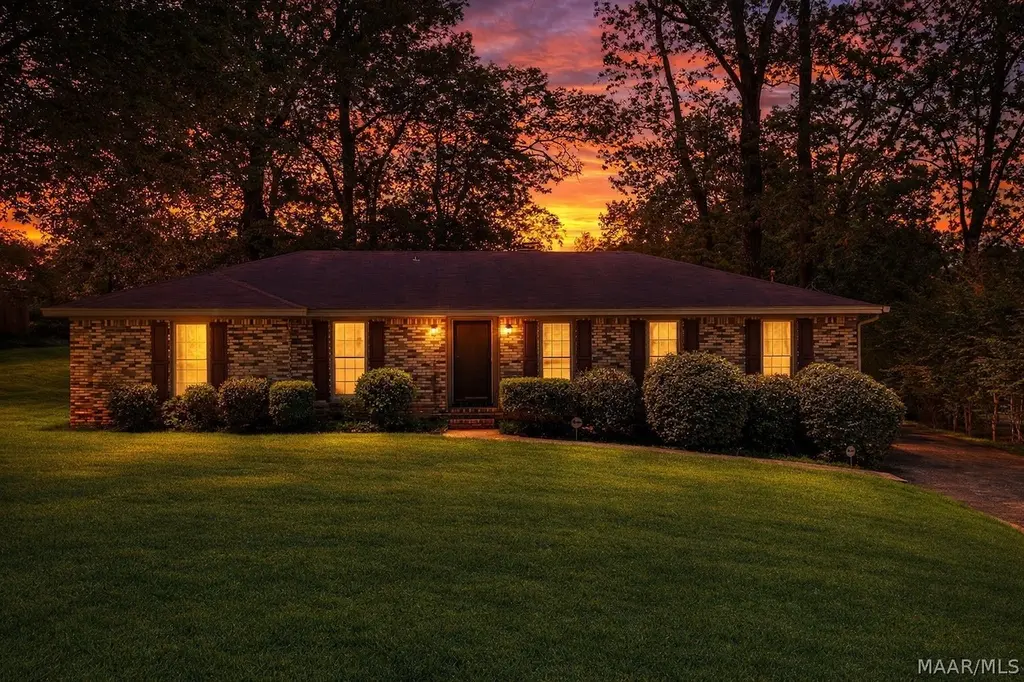
1237 Woodhill Ct · Montgomery, AL
Flood risk 1/10 · Minimal
- FEMA flood zone
- X (unshaded)
- Chance of flooding over 30 yrs
- 0.0%
- Est. flood insurance / yr
- $507 – $1,088
Fire risk 3/10 · Minor
- Est. fire insurance / yr
- $916 – $1,700
Heat risk 7/10 · Major
- Hot days now (above 108°F)
- 7 days/yr
- Hot days in 30 yrs
- 19 days/yr
Wind risk 8/10 · Major
- Chance of severe wind over 30 yrs
- 80.0%
Air-quality risk 3/10 · Minor
- Unhealthy air days now
- 4 days/yr
- Unhealthy air days in 30 yrs
- 4 days/yr
Risk factors via First Street. Map © Google.
Why this score? — see what drove the D grade
The composite is a weighted blend of 9 inputs, each scored 0–100. Each bar is that input's sub-score; the figure is the points it added to the 100-point composite (weight × sub-score).
- Cash flow +14.0/30.0
- ARV discount +12.3/15.0
- DSCR +4.3/10.0
- 1% rule +3.3/10.0
- Rent growth +3.2/5.0
- Livability +3.2/5.0
- Condition / age +2.5/5.0
- Schools +1.7/10.0
- Appreciation +0.0/10.0
$184,900
🖨 Deal sheet (PDF) 📄 Offer letter ✓ Due diligence
Listing remarks
Welcome to 1237 Woodhill Ct, situated in a cul-de-sac in the established Dalraida community! This 4 bedroom, 2 bathroom home is full of potential and charm! It offers a functional layout with multiple living spaces and great natural light throughout. The spacious living and dining areas provide plenty of room to gather, while the kitchen offers ample cabinet space and opportunity to make it your own. Step outside to enjoy the private backyard and enclosed porch, perfect for relaxing or entertaining. Conveniently located near shopping, dining, and the interstate. With good bones and grate location, this home is the perfect opportunity to create something truly special.
Key facts
- Dalraida community
- Great natural light
- Private backyard
Tags
Property features AI
Exterior
- Parking: Driveway
- Utilities: Public water; Public sewer; Electricity available; Cable available; High-speed internet available
- Home design: Single-story; Brick construction; Year built per public records
- Construction: Brick exterior
- Exterior features: Covered patio; Enclosed patio; Fence (partial); Storage; City lot; Cul-de-sac lot; Mature trees; Public road frontage
Interior
- Kitchen: Eat-in kitchen; Dishwasher; Electric cooktop; Electric oven; Microwave; Microwave hood fan
- Bedrooms: Three bedrooms on the first floor
- Flooring: Carpet; Tile; Vinyl
- Bathrooms: Two full bathrooms
- Heating & cooling: Central heating (Gas); Central air; Ceiling fans; Electric cooling components
- Interior features: Attic; Storage; One fireplace
- Laundry & utility: Gas water heater
Neighborhood map
What this means for you Summary
Snapshot
- This is a 4-bed/2.0-bath single-family listed at $185k.
Deal economics
- At list price, monthly cash flow is $24 ($292/yr) — positive.
- The deal already cash-flows at list — no discount required.
- To meet the 1% rule (rent ≥ 1% of price), the offer needs to be $154k (16.7% below list).
- Recommended offer: $154k (16.7% below list) — sets the bar for 1% rule.
Location & tenants
- Location reads 65/100 on livability (#138 in AL) — a middle-class / working-renter tenant base. Strengths: cost of living A+, housing A+; Watch: employment D, crime F, amenities D-.
- Montgomery County (urban): math 9% / reading 31% proficiency, ranked #106 of 129 in AL (top 82%) — low school quality limits family demand, transient renter base, plan for 1-2y turnover; 70% free/reduced lunch — lower-income household profile, screen leases tightly.
- Zoned schools: Dalraida Elementary School (math 5% / reading 34%, grade F, #467 of 627 statewide, top 76%, 627 students, 63% FRL); Goodwyn Middle School (math 0% / reading 16%, grade F, #239 of 257 statewide, top 93%, 808 students, 84% FRL); Lee High School (math 2% / reading 8%, grade F, #276 of 305 statewide, top 95%, 1,374 students, 86% FRL).
- Market conditions: Rents rising (+2.6%/yr); 209 active listings in the ZIP; 29 comparable units currently listed for rent nearby; rentals at typical pace (median 23d on market — plan ~3-4 weeks tenant-placement turnaround); 48% of comp listings sitting > 30 days — soft ceiling on asking rent; 460 units permitted in Montgomery County in 2024 (37 in 5+ unit buildings).
- This rent runs 31% of the median local income ($59k/yr) — at the standard rent-burdened threshold; future hikes will face affordability resistance.
Forward outlook
- Local home prices are declining (-3.0%/yr); year-one equity from $1k of loan paydown is wiped out by about $6k of value loss. Plan a longer hold.
- Montgomery County population projected to shrink 8% by 2050 — rents likely to lag national; underwrite the cash flow, not the appreciation.
Negotiation context
- It's been on market 57 days — a 3% lower offer ($179k) is reasonable based on typical stale-listing flexibility.
Risks & watch-outs
- Climate carrying-cost: severe wind risk, 80% chance of damaging wind over 30y; extreme-heat days projected 7→19/yr by 2055 (HVAC capex compounding) — expect insurance premiums to compound above CPI over the hold.
Questions for the listing agent
- It's been on market 57 days. Have you received any prior offers? Is the seller open to a 17% concession, seller financing, or rate buy-down credit?
- Built in 1975 — when were the roof, HVAC, electrical panel, plumbing, and water heater last replaced?
- Is there a deadline driving the sale (1031 exchange, divorce, estate, relocation)? That informs how much negotiation room exists.
- Crime grade is F in this area — have there been break-ins, vandalism, or insurance claims at this property in the last 3 years? What carrier currently insures it and at what premium?
- The area grade is low — what's the realistic commute time and amenity access for the typical tenant pool here? Any planned neighborhood developments (good or bad) we should know about?
- What's the average days-on-market for RENTAL listings here right now (not sales)? A rising rental-DOM trend means longer vacancies and softer asking-rent achievability than the comps imply.
- What's the recent tenant-quality profile in this submarket — average credit score on applications, eviction rate, late-payment / NSF rate, and stable-employment percentage? A property-management company in the area should have these aggregated.
- How much new for-sale + rental construction is in the pipeline within 1–3 miles? Heavy new supply typically softens prices + rents 12–24 months out; constrained supply supports both.
Investment metrics
- 1% rule
- 0.83% ✗
- Cap rate
- 6.45%
- Cash-on-cash
- 0.56%
- DSCR
- 1.03
- GRM
- 10.0
CMA / ARV
- ARV (median comp)
- $207,127
- List price
- $184,900
- Delta
- -10.73%
- Verdict
- UNDERPRICED
- Comps
- 20 within 1.0 mi
Show comp detail 12 sales within ~0.75 mi
| Address | Dist | Beds/Ba | Sqft | Sold | Price | $/sf | Match |
|---|---|---|---|---|---|---|---|
| 1218 Hillman St | 0.22mi | 4/2.0 | 1,954 (+1%) | 2mo | $240,000 | $123 | 87 |
| 3556 Prince George Dr | 0.28mi | 4/2.0 | 1,789 (-7%) | 2mo | $182,000 | $102 | 73 |
| 3890 Beardsley Dr | 0.51mi | 4/2.0 | 1,992 (+3%) | 3mo | $225,000 | $113 | 69 |
| 3706 Princess Ann St | 0.48mi | 3/2.0 (-1) | 1,858 (-4%) | 1mo | $185,000 | $100 | 66 |
| 1013 Highpoint Rd | 0.21mi | 3/3.0 (-1) | 2,129 (+10%) | 1mo | $212,000 | $100 | 64 |
| 3716 Dalraida Ter | 0.53mi | 5/3.0 (+1) | 1,954 (+1%) | 2mo | $249,000 | $127 | 63 |
| 713 Sweeten Creek Rd | 0.50mi | 3/2.0 (-1) | 1,836 (-5%) | 1mo | $150,000 | $82 | 63 |
| 3612 Royal Crest Dr | 0.30mi | 3/2.0 (-1) | 1,727 (-11%) | 4mo | $194,900 | $113 | 60 |
| 3820 Cedar Ave | 0.68mi | 3/2.0 (-1) | 1,755 (-9%) | 0mo | $199,000 | $113 | 48 |
| 3807 Marie Cook Dr | 0.68mi | 3/2.5 (-1) | 1,782 (-8%) | 2mo | $88,000 | $49 | 46 |
| 3855 Berkshire Dr | 0.69mi | 3/2.5 (-1) | 1,706 (-12%) | 1mo | $225,000 | $132 | 41 |
| 3553 S Georgetown Dr | 0.70mi | 3/2.0 (-1) | 1,674 (-13%) | 0mo | $140,000 | $84 | 40 |
Match score weights: distance 35% · size 25% · config 20% · recency 20%. Top-matched comps best support the ARV.
Projected returns pro-forma
-3.0% appreciation · 2.65% rent growth · sell at horizon
- IRR
- -15.8%
- Equity multiple
- 0.44×
- Total profit
- $-28,982
- Equity at exit
- $27,569
- IRR
- -8.0%
- Equity multiple
- 0.51×
- Total profit
- $-25,562
- Equity at exit
- $15,987
Cash invested: $51,772 (down + closing). Projections, not guarantees.
Landlord ↔ Tenant lean methodology
- Overall (STATE)
- 90 Strongly Landlord-Friendly
- State Alabama
- 90 Strongly Landlord-Friendly · R+15
- County
- — inherits STATE
- City
- — inherits STATE
ZIP-level market 36109
- Home prices YoY
- -20.1%
- Rents YoY
- 2.6%
- Active inventory
- 209
- Price-to-rent
- 10.0×
Monthly cashflow live
- Estimated rent
- $1,541 high interval (Pro) →
- Mortgage (P&I)
- −$970
- Tax from tax record
- −$146 /mo · $1,757/yr
- Insurance
- −$77
- HOA
- −$0
- Vacancy / Maint / Mgmt
- −$324
- Net cashflow
- $24
Break-even live
Sensitivity live
| Price | -10% $129 | -5% $77 | +0% $24 | +5% $-28 | +10% $-80 |
|---|---|---|---|---|---|
| Rent | -10% $-97 | -5% $-37 | +0% $24 | +5% $85 | +10% $146 |
| Rate | -1.0pp $117 | -0.5pp $71 | base $24 | +0.5pp $-24 | +1.0pp $-72 |
UW: 25.0% down · 7.5% · 30yr · 1.5% tax · 5.0% vac · 8.0% maint · 8.0% mgmt
Financing live
Cash to close
- Down payment
- $46,225
- Closing costs
- $5,547
- Reserves months
- —
- Total cash needed
- —
Loan-product check · same deal, 3 products live
Conventional
25% down · 7.5% · 30yr
- Down + closing
- —
- Monthly P&I
- —
- Monthly cashflow
- —
- DSCR
- —
- Eligible?
- —
Personal DTI + credit; lowest rate.
DSCR
20% down · 8.5% · 30yr
- Down + closing
- —
- Monthly P&I
- —
- Monthly cashflow
- —
- DSCR
- —
- Eligible?
- —
No personal income docs; deal must DSCR.
Hard money
10% down · 12.0% · 12mo
- Down + closing
- —
- Monthly P&I
- —
- Monthly cashflow
- —
- DSCR
- —
- Eligible?
- —
Short-term bridge; refi at stabilization.
Rent comps 29 comps
| Address | Beds | Baths | Sqft | Rent | $/sqft | DOM | Units | Dist |
|---|---|---|---|---|---|---|---|---|
| 1007 Highpoint Rd Montgomery, AL | 4.0 | 2.0 | 2089 | $1,581 | $0.76 | 15d | 1 | 0.26mi |
| 931 Whitehall Pkwy Montgomery, AL | 4.0 | 3.0 | 2403 | $1,800 | $0.75 | 46d | 1 | 0.34mi |
| 3614 Princess Ann St Montgomery, AL | 4.0 | 2.0 | 1928 | $1,581 | $0.82 | 15d | 1 | 0.44mi |
| 804 Hillman St Montgomery, AL | 3.0 | 2.0 | 1370 | $1,295 | $0.95 | 15d | 1 | 0.46mi |
| 804 Hillman St Montgomery, AL | 3.0 | 2.0 | 1356 | $1,295 | $0.96 | 23d | 1 | 0.46mi |
| 1201 Dalraida Rd Montgomery, AL | 3.0 | 2.0 | 1673 | $1,625 | $0.97 | 45d | 1 | 0.53mi |
| 942 Parkwood Ct Montgomery, AL | 4.0 | 2.0 | 1752 | $1,299 | $0.74 | 15d | 1 | 0.61mi |
| 3801 Cedar Ave Montgomery, AL | 3.0 | 2.0 | 1818 | $1,681 | $0.92 | 23d | 1 | 0.62mi |
| 3462 Biltmore Ave Montgomery, AL | 3.0 | 2.0 | 1685 | $1,225 | $0.73 | 23d | 1 | 0.63mi |
| 3737 Dalraida Pkwy Montgomery, AL | 3.0 | 1.0 | 1618 | $1,150 | $0.71 | 45d | 1 | 0.71mi |
| 3806 Marie Cook Dr Montgomery, AL | 3.0 | 2.0 | 1791 | $1,675 | $0.94 | 15d | 1 | 0.72mi |
| 610 S Georgetown Dr Unit 1386555P Montgomery, AL | 3.0 | 1.0 | 1474 | $3,635 | $2.47 | 15d | 1 | 0.73mi |
| 3760 Dalraida Pkwy Montgomery, AL | 4.0 | 2.5 | 1900 | $1,850 | $0.97 | 45d | 1 | 0.79mi |
| 2941 Ashley Ave Unit 6616 Montgomery, AL | 3.0 | 2.0 | 2340 | $1,250 | $0.53 | 45d | 1 | 0.92mi |
| 3105 Pelzer Ave Montgomery, AL | 4.0 | 2.0 | 1605 | $1,425 | $0.89 | 45d | 1 | 0.95mi |
| 200 Eton Rd Montgomery, AL | 3.0 | 1.5 | 1500 | $895 | $0.60 | 15d | 1 | 1.01mi |
| 2822 Sumter Ave Montgomery, AL | 3.0 | 2.5 | 1617 | $1,300 | $0.80 | 23d | 1 | 1.02mi |
| 167 E Salem Dr Montgomery, AL | 3.0 | 2.0 | 1700 | $1,050 | $0.62 | 45d | 1 | 1.04mi |
| 2814 Ashley Ave Montgomery, AL | 3.0 | 2.0 | 1683 | $1,350 | $0.80 | 15d | 1 | 1.13mi |
| 3944 Johnstown Dr Montgomery, AL | 3.0 | 2.0 | 1912 | $1,275 | $0.67 | 45d | 1 | 1.13mi |
| 107 Dalraida Rd Unit A Montgomery, AL | 3.0 | 2.0 | 1237 | $1,200 | $0.97 | 45d | 1 | 1.25mi |
| 2769 Pelzer Ave Montgomery, AL | 3.0 | 2.0 | 1608 | $1,325 | $0.82 | 45d | 1 | 1.27mi |
| 4056 Wares Ferry Rd Montgomery, AL | 3.0 | 2.0 | 1800 | $1,500 | $0.83 | 15d | 1 | 1.28mi |
| 3008 Cabot St Montgomery, AL | 4.0 | 2.0 | 1300 | $1,150 | $0.88 | 45d | 1 | 1.29mi |
| 3050 Willena Ave Montgomery, AL | 3.0 | 1.0 | 1466 | $985 | $0.67 | 23d | 1 | 1.41mi |
| 4046 Camellia Dr Unit 1 Montgomery, AL | 3.0 | 2.0 | 1500 | $1,200 | $0.80 | 45d | 1 | 1.42mi |
| 239 Forest Hills Dr Montgomery, AL | 4.0 | 1.5 | 1500 | $1,450 | $0.97 | 23d | 1 | 1.45mi |
| 2001 Speigle St Montgomery, AL | 3.0 | 1.0 | 1260 | $1,035 | $0.82 | 45d | 1 | 1.45mi |
| 3515 Cottonwood Dr Montgomery, AL | 3.0 | 1.5 | 1246 | $1,350 | $1.08 | 45d | 1 | 1.45mi |
Listing history 17 events
-
2026-06-21days on market $184,900 Active 57 DOM
-
2026-06-18days on market $184,900 Active 54 DOM
-
2026-06-17days on market $184,900 Active 53 DOM
-
2026-06-16days on market $184,900 Active 52 DOM
-
2026-06-15days on market $184,900 Active 51 DOM
-
2026-06-14days on market $184,900 Active 49 DOM
-
2026-06-13days on market $184,900 Active 48 DOM
-
2026-06-10days on market $184,900 Active 46 DOM
-
2026-06-09days on market $184,900 Active 45 DOM
-
2026-06-08days on market $184,900 Active 44 DOM
-
2026-06-07days on market $184,900 Active 43 DOM
-
2026-06-03days on market $184,900 Active 39 DOM
-
2026-06-02days on market $184,900 Active 38 DOM
-
2026-06-01days on market $184,900 Active 37 DOM
-
2026-05-31days on market $184,900 Active 36 DOM
-
2026-05-30days on market $184,900 Active 35 DOM
-
2026-04-25$184,900 Active 676-char remark
ⓘ Source: listings_history table (triggers on properties + properties_extension) + one-shot
backfill from property_details.listing_events for pre-trigger history.
Tax reassessment forecast AL · Resets to sale price
- Current annual tax
- $1,757 · $146/mo
- Projected year-2 tax
- $1,757 · $146/mo
- Expected delta
- $0/yr ($0/mo · 0.0%)
ⓘ Screening estimate from a state-policy table — verify with the county assessor before closing.
Climate risk First Street
- Flood 1/10 Low FEMA zone X (unshaded) · 0% chance over 30 yrs
- Wildfire 3/10 Moderate
- Heat 7/10 Severe 7 d/yr ≥108°F today · 19 d/yr by 30 yrs out
- Wind 8/10 Severe 80% chance of damaging wind over 30 yrs
- Air quality 3/10 Moderate 4 unhealthy d/yr today · 4 by 30 yrs out
Nearby sold comps map
Loading sold comps map…
Walkable amenities ~0.75 mi
Loading nearby amenities…
Taxation est. · year 1
- Rental income
- $18,492
- − Mortgage interest
- −$10,357
- − Property taxes
- −$1,757
- − Insurance
- −$924
- − Repairs & maintenance
- −$1,479
- − Management
- −$1,479
- − Depreciation
- −$5,379
- Taxable loss
- −$2,884
- Est. tax savings @ 24.0%
- +$692
- After-tax cash flow
- $984/yr
For passive investors: Depreciation is non-cash, so a rental often shows a tax loss while cash-flowing — sheltering income. Rental losses are passive: they offset passive income freely, and up to $25,000/yr can offset ordinary (W-2) income if you actively participate and your MAGI is under $100k (phasing out to $0 by $150k); unused losses carry forward. On sale, claimed depreciation is recaptured at up to 25%, and gains may owe capital-gains tax (a 1031 exchange can defer both). Figures are a year-1 estimate at your 24.0% rate — not tax advice; consult a CPA.
Schools (NCES district)
- District
- Montgomery County
- NCES district ID
- 0102430
- Math proficiency
- 9% ▼ -21.00%
- Reading proficiency
- 31% ▼ -1.00%
- Median HH income
- $43,902
- Composite
- 17.24/100
- National rank
- #9093
- State rank
- #106 of 129 in AL
Livability — Montgomery
- Score
- 65/100
- State rank
- #138
- US rank
- #13416
Category grades
Schools grade is shown separately in the Schools card above.
Census & demographics
- Census place
- Montgomery, AL
- County
- Montgomery County · 190,016 people
- City population
- 175,913
- Metro
- Montgomery, AL
- Population (ZIP)
- 23,581
- Household income
- $59,193
- Rent vs Own
- Severe rent burden
- 1039.0
Population outlook (Montgomery County) Hauer SSP2
- Today (2025)
- 224,008 people
- By 2030
- 221,460 · -1.1%
- By 2040
- 214,179 · -4.4%
- By 2050
- 204,912 · -8.5%
- By 2075
- 177,821 · -20.6%
- By 2100
- 145,134 · -35.2%
Race, ethnicity, and origin ACS 2023
- Neighborhood character
- Diverse neighborhood (Simpson 0.60)
- Race & ethnicity
- White 49% Black 39% Hispanic / Latino 8% Two or more races 4%
- Hispanic origin (detail)
- Mexican 4%
- Common ancestry
- Slovak 2% Lithuanian 1% Serbian 1%
- Foreign-born
- 4% · Canada, South Korea
- Languages at home
- 94% English-only · Spanish 5%
Political lean MEDSL · Montgomery
- 2024 margin
- Solid D (+30.7) · D 64.8% · R 34.1% · Other 1.1%
- 2008→2024 swing
- +11.5pp toward D · 2008: 19.2pp · 2024: 30.7pp
- All cycles
- 2024: D+30.7 2020: D+31.5 2016: D+26.2 2012: D+24.3 2008: D+19.2
Not yet ingested
- Civics
- —
Market trends
- HPI YoY
- ▼ -37.64%
- Current HPI
- 149.3867
- Rent YoY
- ▲ 2.65%
- Metro
- Montgomery, AL
- State GDP YoY
- ▲ 2.94%
- F500 in state
- 4
Industry mix (Fortune 500 HQ in AL)
| Industry | F500 HQs | Revenue |
|---|---|---|
| Financial Services | 1 | $8B |
|
||
| Healthcare | 1 | $5B |
|
||
Price history
1 event — show timeline
- 2026-04-25 Listed $184,900 MAAR
Property tax history
+13.5%/yrLatest (2025): $1,757 · +120.3% YoY. Source: county tax records.
Cash-flow waterfall
monthlySold comps — $/sqft
last 12 mo · ≤1 miLoading sold comps…