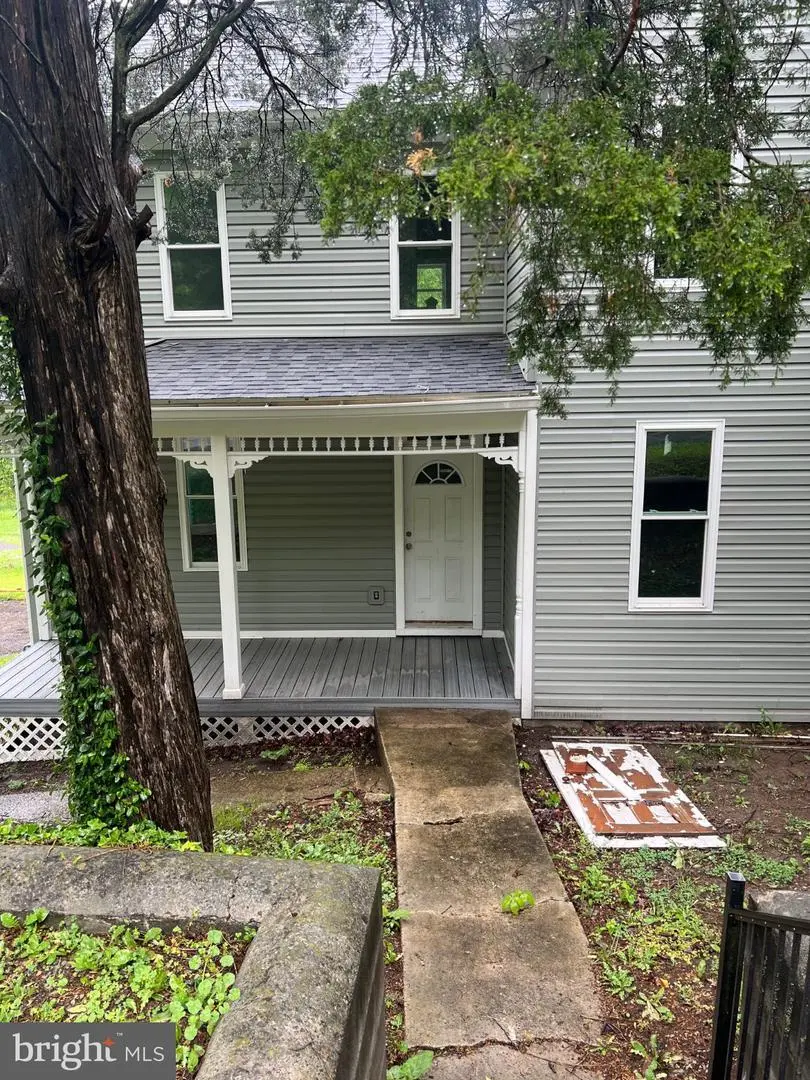
1034 Shades Ln · Cumberland, MD
Flood risk 7/10 · Major
- FEMA flood zone
- X (unshaded)
- Chance of flooding over 30 yrs
- 0.99%
- Est. flood insurance / yr
- $473 – $860
Fire risk 3/10 · Minor
- Est. fire insurance / yr
- $755 – $1,403
Heat risk 4/10 · Minor
- Hot days now (above 101°F)
- 7 days/yr
- Hot days in 30 yrs
- 17 days/yr
Wind risk 2/10 · Minimal
- Chance of severe wind over 30 yrs
- —
Air-quality risk 2/10 · Minimal
- Unhealthy air days now
- 0 days/yr
- Unhealthy air days in 30 yrs
- 1 days/yr
Risk factors via First Street. Map © Google.
Why this score? — see what drove the B- grade
The composite is a weighted blend of 9 inputs, each scored 0–100. Each bar is that input's sub-score; the figure is the points it added to the 100-point composite (weight × sub-score).
- Cash flow +30.0/30.0
- DSCR +10.0/10.0
- 1% rule +8.3/10.0
- ARV discount +7.5/15.0
- Rent growth +5.0/5.0
- Livability +3.9/5.0
- Condition / age +2.5/5.0
- Schools +1.9/10.0
- Appreciation +0.0/10.0
$94,000
🖨 Deal sheet 📄 Offer letter ✓ Due diligence
Listing remarks MLS
Fixer upper - bring your tools, ideas and renovate this home. Spacious house features off street parking, rear deck over looking the back yard. Located close to I-68 for traveling and convenient access to the new hospital. Priced to move!
Key facts
- 0.44 acre lot
- Built 1912
- Listed 15 days
Property features AI
Finance
- Other: Not in a federal flood zone; Pets allowed with no restrictions; Above-grade finished area reported (assessor): 1,764 sq.ft.; Total below-grade area reported as 0
Exterior
- Parking: Paved parking; Other parking type
- Utilities: Public water; Hot water: Other; Cooling fuel: Other; Heating fuel: Other
- Home design: Detached property; Two floors in unit; Entry level: 1; Ownership: Fee simple; Property condition: Major rehab needed; Year built (estimated)
- Construction: HardiPlank-type siding; Architectural shingle roof; Permanent foundation; Other structures above and below grade; Building not winterized
- Exterior features: Paved parking; Tidal water: None; Location is suburban; GPS-friendly directions
Interior
- Kitchen: Kitchen
- Bedrooms: Three bedrooms on the upper/main living level
- Bathrooms: One full bathroom
- Heating & cooling: Radiant heating; Cooling: Other (unspecified); Heating fuel: Other (unspecified)
- Interior features: Attic; Basement (other type)
- Laundry & utility: Hot water: Other
Neighborhood map
What this means for you Summary
Snapshot
- This is a 3-bed/1.0-bath single-family listed at $94k.
Deal economics
- At list price, monthly cash flow is $371 ($4k/yr) — positive.
- The deal already cash-flows at list — no discount required.
- Meets the 1% rule at list price ($1k rent vs $94k).
- Recommended offer: $93k (1.5% below list) — sets the bar for market timing.
- Cap rate 11.7% vs local median 6.7% in Cumberland — top-decile yield for the area; either an underpriced asset or a hidden risk that comps aren't pricing in. Stress-test before assuming the spread holds.
Location & tenants
- Location reads 78/100 on livability (#64 in MD, #2,385 nationally) — a middle-class / working-renter tenant base. Strengths: amenities A+, commute A+, cost of living A+; Watch: schools D+, crime F, employment F.
- Allegany County Public Schools (other): math 15% / reading 30% proficiency, ranked #18 of 24 in MD (top 75%) — low school quality limits family demand, transient renter base, plan for 1-2y turnover.
- Market conditions: Rents rising fast (+10.9%/yr); 235 active listings in the ZIP; 5 comparable units currently listed for rent nearby; rentals lingering (median 44d on market — plan ~5-8 weeks vacancy on turnover, expect pricing pressure); 100% of comp listings sitting > 30 days — soft ceiling on asking rent; 24 units permitted in Allegany County in 2024 (0 in 5+ unit buildings).
Forward outlook
- Local home prices are declining (-3.0%/yr); year-one equity from $650 of loan paydown is wiped out by about $3k of value loss. Plan a longer hold.
- Allegany County population projected at -14% by 2050 — secular population decline; favor cash flow + early exit over multi-decade hold.
- At projected returns (-3.0% appreciation + 8.0% rent growth), your $26k cash investment doubles in ~6 years — after that, you're playing with house money.
Negotiation context
- It's been on market 16 days — a 2% lower offer ($93k) is reasonable based on typical stale-listing flexibility.
- 2 sale attempts since 9y ago with the ask held roughly flat each time — persistent listings suggest the price (not the market) is what's stuck; bring a comps-based counter.
- Current owner paid $18k; list at $94k implies a 437% gain — meaningful room to come down on a strong offer.
Risks & watch-outs
- Watch-outs: flood insurance adds $56/mo; built in 1912 — expect roof / HVAC / electrical / plumbing capex.
- Climate carrying-cost: major flood risk — expect insurance premiums to compound above CPI over the hold.
Questions for the listing agent
- Built in 1912 — when were the roof, HVAC, electrical panel, plumbing, and water heater last replaced?
- What's the actual annual flood-insurance premium (NFIP or private), and is the property in a SFHA with mandatory coverage?
- Is there a deadline driving the sale (1031 exchange, divorce, estate, relocation)? That informs how much negotiation room exists.
- Schools are D-rated, which usually means shorter tenancies and higher turnover. Who's the typical renter profile here, and what's been the actual vacancy rate?
- Crime grade is F in this area — have there been break-ins, vandalism, or insurance claims at this property in the last 3 years? What carrier currently insures it and at what premium?
- What's the average days-on-market for RENTAL listings here right now (not sales)? A rising rental-DOM trend means longer vacancies and softer asking-rent achievability than the comps imply.
- What's the recent tenant-quality profile in this submarket — average credit score on applications, eviction rate, late-payment / NSF rate, and stable-employment percentage? A property-management company in the area should have these aggregated.
- How much new for-sale + rental construction is in the pipeline within 1–3 miles? Heavy new supply typically softens prices + rents 12–24 months out; constrained supply supports both.
Investment metrics
- 1% rule
- 1.33% ✓
- Cap rate
- 11.74%
- Cash-on-cash
- 19.46%
- DSCR
- 1.87
- GRM
- 6.2
CMA / ARV
- ARV (on-the-fly)
- $202,860
- Comps found
- 12
Show comp detail 12 sales within ~0.75 mi
| Address | Dist | Beds/Ba | Sqft | Sold | Price | $/sf | Match |
|---|---|---|---|---|---|---|---|
| 1026 Shades Ln | 0.02mi | 3/1.5 | 1,674 (-5%) | 16mo | $183,500 | $110 | 75 |
| 519 Forester Ave | 0.46mi | 4/2.5 (+1) | 1,732 (-2%) | 2mo | $170,000 | $98 | 63 |
| 720 Yale St | 0.30mi | 3/3.0 | 1,656 (-6%) | 8mo | $250,000 | $151 | 61 |
| 10001 Carrington Ct | 0.48mi | 3/2.0 | 1,776 (+1%) | 15mo | $431,050 | $243 | 60 |
| 1039 Myrtle St | 0.30mi | 3/2.0 | 1,502 (-15%) | 12mo | $175,000 | $117 | 47 |
| 517 Linden St | 0.74mi | 3/2.0 | 1,872 (+6%) | 5mo | $87,000 | $46 | 47 |
| 5 Weber St | 0.55mi | 3/1.5 | 1,656 (-6%) | 20mo | $65,000 | $39 | 45 |
| 712 Lincoln St | 0.53mi | 3/2.0 | 1,532 (-13%) | 10mo | $165,000 | $108 | 42 |
| 10013 Carrington Ct | 0.44mi | 3/2.5 | 1,979 (+12%) | 15mo | $420,435 | $212 | 41 |
| 10007 Carrington Ct | 0.46mi | 4/2.5 (+1) | 1,916 (+9%) | 17mo | $440,179 | $230 | 39 |
| 1508 Frederick St | 0.47mi | 3/1.5 | 1,519 (-14%) | 18mo | $175,000 | $115 | 38 |
| 718 Bedford St | 0.56mi | 3/1.0 | 1,520 (-14%) | 20mo | $130,000 | $86 | 34 |
Match score weights: distance 35% · size 25% · config 20% · recency 20%. Top-matched comps best support the ARV.
Projected returns pro-forma
-3.0% appreciation · 8.0% rent growth · sell at horizon
- IRR
- 13.5%
- Equity multiple
- 1.57×
- Total profit
- $15,042
- Equity at exit
- $14,016
- IRR
- 25.9%
- Equity multiple
- 3.80×
- Total profit
- $73,717
- Equity at exit
- $8,127
Cash invested: $26,320 (down + closing). Projections, not guarantees.
Landlord ↔ Tenant lean methodology
- Overall (STATE)
- 27 Tenant-Leaning
- State Maryland
- 27 Tenant-Leaning · D+14
- County
- — inherits STATE
- City
- — inherits STATE
ZIP-level market 21502
- Home prices YoY
- -17.4%
- Rents YoY
- 10.9%
- Active inventory
- 235
- Price-to-rent
- 6.2×
Monthly cashflow live
- Estimated rent
- $1,254 high interval (Pro) →
- Mortgage (P&I)
- −$493
- Tax from tax record
- −$32 /mo · $384/yr
- Insurance
- −$39
- Flood insurance flood zone
- −$56 /mo · $666/yr
- HOA
- −$0
- Vacancy / Maint / Mgmt
- −$263
- Net cashflow
- $371
Break-even live
UW: 25.0% down · 7.5% · 30yr · 1.5% tax · 5.0% vac · 8.0% maint · 8.0% mgmt
Financing live
Cash to close
- Down payment
- $23,500
- Closing costs
- $2,820
- Reserves months
- —
- Total cash needed
- —
Loan-product check · same deal, 3 products live
Conventional
25% down · 7.5% · 30yr
- Down + closing
- —
- Monthly P&I
- —
- Monthly cashflow
- —
- DSCR
- —
- Eligible?
- —
Personal DTI + credit; lowest rate.
DSCR
20% down · 8.5% · 30yr
- Down + closing
- —
- Monthly P&I
- —
- Monthly cashflow
- —
- DSCR
- —
- Eligible?
- —
No personal income docs; deal must DSCR.
Hard money
10% down · 12.0% · 12mo
- Down + closing
- —
- Monthly P&I
- —
- Monthly cashflow
- —
- DSCR
- —
- Eligible?
- —
Short-term bridge; refi at stabilization.
Rent comps 5 comps
| Address | Beds | Baths | Sqft | Rent | $/sqft | DOM | Units | Dist |
|---|---|---|---|---|---|---|---|---|
| 516 Bedford St Cumberland, MD | 3.0 | 1.5 | 1500 | $1,195 | $0.80 | 43d | 1 | 0.72mi |
| 118 Independence St Cumberland, MD | 3.0 | 1.5 | 1260 | $1,250 | $0.99 | 44d | 1 | 0.94mi |
| 423 Furnace St Cumberland, MD | 3.0 | 1.5 | 1440 | $1,250 | $0.87 | 43d | 1 | 1.09mi |
| 418 N Mechanic St Unit 1C Cumberland, MD | 3.0 | 1.0 | 1500 | $1,295 | $0.86 | 43d | 1 | 1.28mi |
| 201 Spring St Cumberland, MD | 3.0 | 1.0 | 1332 | $950 | $0.71 | 43d | 1 | 1.30mi |
Listing history 11 events
-
2026-06-19days on market $94,000 Active 16 DOM
-
2026-06-18days on market $94,000 Active 15 DOM
-
2026-06-17days on market $94,000 Active 14 DOM
-
2026-06-16days on market $94,000 Active 13 DOM
-
2026-06-15days on market $94,000 Active 12 DOM
-
2026-06-14days on market $94,000 Active 10 DOM
-
2026-06-12days on market $94,000 Active 9 DOM
-
2026-06-09days on market $94,000 Active 6 DOM
-
2026-06-08days on market $94,000 Active 5 DOM
-
2026-06-07remarks 443-char remark
-
2026-06-07$94,000 Active 4 DOM
ⓘ Source: listings_history table (triggers on properties + properties_extension) + one-shot
backfill from property_details.listing_events for pre-trigger history.
Tax reassessment forecast MD · Partial reset (capped growth)
- Current annual tax
- $384 · $32/mo
- Projected year-2 tax
- $704 · $59/mo
- Expected delta
- +$320/yr (+$27/mo · 83.4%)
ⓘ Screening estimate from a state-policy table — verify with the county assessor before closing.
Climate risk First Street
- Flood 7/10 Severe FEMA zone X (unshaded) · 99% chance over 30 yrs
- Wildfire 3/10 Moderate
- Heat 4/10 Moderate 7 d/yr ≥101°F today · 17 d/yr by 30 yrs out
- Wind 2/10 Low
- Air quality 2/10 Low 0 unhealthy d/yr today · 1 by 30 yrs out
Nearby sold comps map
Loading sold comps map…
Walkable amenities ~0.75 mi
Loading nearby amenities…
Taxation est. · year 1
- Rental income
- $15,052
- − Mortgage interest
- −$5,265
- − Property taxes
- −$384
- − Insurance
- −$1,136
- − Repairs & maintenance
- −$1,204
- − Management
- −$1,204
- − Depreciation
- −$2,735
- Taxable income
- $3,123
- Est. tax owed @ 24.0%
- −$750
- After-tax cash flow
- $3,705/yr
For passive investors: Depreciation is non-cash, so a rental often shows a tax loss while cash-flowing — sheltering income. Rental losses are passive: they offset passive income freely, and up to $25,000/yr can offset ordinary (W-2) income if you actively participate and your MAGI is under $100k (phasing out to $0 by $150k); unused losses carry forward. On sale, claimed depreciation is recaptured at up to 25%, and gains may owe capital-gains tax (a 1031 exchange can defer both). Figures are a year-1 estimate at your 24.0% rate — not tax advice; consult a CPA.
Schools (NCES district)
- District
- Allegany County Public Schools
- NCES district ID
- 2400030
- Math proficiency
- 15% ▼ -26.00%
- Reading proficiency
- 30% ▼ -20.00%
- Median HH income
- $39,760
- Composite
- 18.95/100
- National rank
- #8854
- State rank
- #18 of 24 in MD
Livability — Cumberland
- Score
- 78/100
- State rank
- #64
- US rank
- #2385
Category grades
Schools grade is shown separately in the Schools card above.
Census & demographics
- Census place
- Cumberland, MD
- County
- Allegany County · 41,015 people
- City population
- 41,015
- Metro
- Cumberland, MD-WV
- Population (ZIP)
- 41,015
- Household income
- $60,725
- Rent vs Own
- Severe rent burden
- 824.0
Population outlook (Allegany County) Hauer SSP2
- Today (2025)
- 68,778 people
- By 2030
- 66,766 · -2.9%
- By 2040
- 62,784 · -8.7%
- By 2050
- 59,179 · -14.0%
- By 2075
- 50,732 · -26.2%
- By 2100
- 40,837 · -40.6%
Race, ethnicity, and origin ACS 2023
- Neighborhood character
- Predominantly White (83%)
- Race & ethnicity
- White 83% Black 9% Two or more races 5% Hispanic / Latino 2%
- Common ancestry
- Slovak 3% Romanian 2% Italian 1%
- Foreign-born
- 2% · Canada
- Languages at home
- 96% English-only · Spanish 2%
Political lean MEDSL · Allegany
- 2024 margin
- Solid R (+40.3) · D 28.9% · R 69.2% · Other 2.0%
- 2008→2024 swing
- -14.4pp toward R · 2008: -25.9pp · 2024: -40.3pp
- All cycles
- 2024: R+40.3 2020: R+38.3 2016: R+48.0 2012: R+32.9 2008: R+25.9
Not yet ingested
- Civics
- —
Market trends
- HPI YoY
- ▼ -54.33%
- Current HPI
- 258.6676
- Rent YoY
- ▲ 10.88%
- Metro
- Cumberland, MD-WV
- State GDP YoY
- ▲ 2.97%
- F500 in state
- 12
Industry mix (Fortune 500 HQ in MD)
| Industry | F500 HQs | Revenue |
|---|---|---|
| Aerospace / Defense | 1 | $71B |
|
||
| Utilities | 1 | $25B |
|
||
| Hotels | 1 | $24B |
|
||
| Consumer Goods | 1 | $7B |
|
||
| Real Estate | 1 | $6B |
|
||
| Chemicals | 1 | $2B |
|
||
Price history
+370.0% since first listed5 events — show timeline
- 2026-06-03 Listed $94,000 BRIGHT MLS
- 2017-09-22 Sold (MLS) $17,500 MRIS
- 2017-09-22 Sold (MLS) $17,500 BRIGHT MLS
- 2017-08-10 Delisted — MRIS
- 2017-08-10 Listed $20,000 MRIS
Property tax history
-2.0%/yrLatest (2025): $384 · +7.3% YoY. Source: county tax records.
Cash-flow waterfall
monthlySold comps — $/sqft
last 12 mo · ≤1 miLoading sold comps…