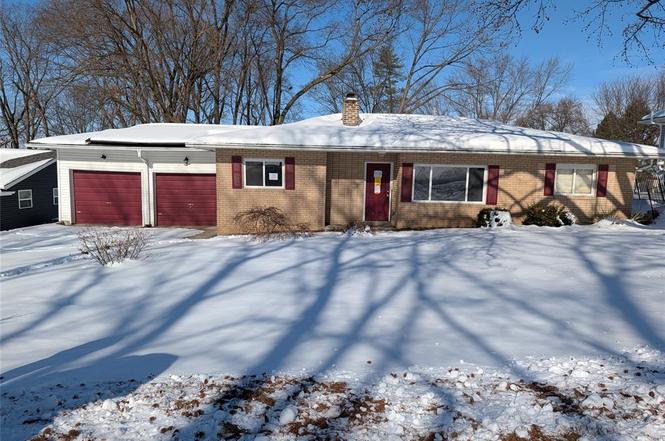
56 Judy Dr · St. Charles, MO
Flood risk 1/10 · Minimal
- FEMA flood zone
- X (unshaded)
- Chance of flooding over 30 yrs
- 0.0%
- Est. flood insurance / yr
- $507 – $1,088
Fire risk 1/10 · Minimal
- Est. fire insurance / yr
- $1,054 – $1,958
Heat risk 4/10 · Minor
- Hot days now (above 107°F)
- 7 days/yr
- Hot days in 30 yrs
- 18 days/yr
Wind risk 2/10 · Minimal
- Chance of severe wind over 30 yrs
- 1.0%
Air-quality risk 3/10 · Minor
- Unhealthy air days now
- 2 days/yr
- Unhealthy air days in 30 yrs
- 3 days/yr
Risk factors via First Street. Map © Google.
Why this score? — see what drove the C+ grade
The composite is a weighted blend of 9 inputs, each scored 0–100. Each bar is that input's sub-score; the figure is the points it added to the 100-point composite (weight × sub-score).
- Cash flow +20.9/30.0
- ARV discount +15.0/15.0
- DSCR +6.7/10.0
- 1% rule +5.9/10.0
- Schools +4.1/10.0
- Rent growth +3.3/5.0
- Livability +2.5/5.0
- Condition / age +2.5/5.0
- Appreciation +0.0/10.0
$157,000
🖨 Deal sheet 📄 Offer letter ✓ Due diligence
Listing remarks MLS
One level living never looked so good as it does with this move-in ready ranch on almost half an acre. With 3 bedrooms, and a sizeable full bath, this home offers great relaxing spaces, a woodburning fireplace and a lot to love in just over 1300 square feet. A covered deck gives you a great space to enjoy your large private yard with mature trees for quiet evenings or great morning coffee. A 2 year old roof, 2 car garage with oversized off-street parking and freshly painted interior only add to this home's appeal.
Key facts
- Covered deck
- Tile floors
- Deep back yard
Tags
Neighborhood map
What this means for you Summary
Snapshot
- This is a 3-bed/1.0-bath single-family listed at $157k.
Deal economics
- At list price, monthly cash flow is $219 ($3k/yr) — positive.
- The deal already cash-flows at list — no discount required.
- Meets the 1% rule at list price ($2k rent vs $157k).
- Recommended offer: $155k (1.5% below list) — sets the bar for market timing.
- Cap rate 8.0% vs local median 3.3% in St. Charles — top-decile yield for the area; either an underpriced asset or a hidden risk that comps aren't pricing in. Stress-test before assuming the spread holds.
Location & tenants
- Location reads: area grade C — affects rentability + tenant quality, not the cash-flow math above.
- St. Charles R-VI (urban): math 44% / reading 52% proficiency, ranked #51 of 324 in MO (top 16%) — families likely to look elsewhere, expect single-tenant / working-renter base with shorter leases.
- Zoned schools: Monroe Elem. (math 42% / reading 47%, grade F, #413 of 1,115 statewide, top 42%, 388 students, 53% FRL); St. Charles High (math 42% / reading 54%, grade D, #153 of 521 statewide, top 29%, 817 students, 43% FRL).
- Market conditions: Rents rising (+3.2%/yr); 294 active listings in the ZIP; 10 comparable units currently listed for rent nearby; rentals leasing fast (median 2d on market — plan ~1-2 weeks tenant-placement turnaround); solid renter incomes; 2,021 units permitted in St. Charles County in 2024 (568 in 5+ unit buildings).
Forward outlook
- Local home prices are declining (-3.0%/yr); year-one equity from $1k of loan paydown is wiped out by about $5k of value loss. Plan a longer hold.
- St. Charles County population projected at +22% by 2050 — long-run rental-demand tailwind backs the buy-and-hold thesis.
Negotiation context
- It's been on market 18 days — a 2% lower offer ($155k) is reasonable based on typical stale-listing flexibility.
- 3 sale attempts since 10y ago with the ask held roughly flat each time — persistent listings suggest the price (not the market) is what's stuck; bring a comps-based counter.
Risks & watch-outs
- Watch-outs: built in 1951 — expect roof / HVAC / electrical / plumbing capex.
Questions for the listing agent
- Built in 1951 — when were the roof, HVAC, electrical panel, plumbing, and water heater last replaced?
- Is there a deadline driving the sale (1031 exchange, divorce, estate, relocation)? That informs how much negotiation room exists.
- What's the average days-on-market for RENTAL listings here right now (not sales)? A rising rental-DOM trend means longer vacancies and softer asking-rent achievability than the comps imply.
- What's the recent tenant-quality profile in this submarket — average credit score on applications, eviction rate, late-payment / NSF rate, and stable-employment percentage? A property-management company in the area should have these aggregated.
- How much new for-sale + rental construction is in the pipeline within 1–3 miles? Heavy new supply typically softens prices + rents 12–24 months out; constrained supply supports both.
Investment metrics
- 1% rule
- 1.09% ✓
- Cap rate
- 7.97%
- Cash-on-cash
- 5.98%
- DSCR
- 1.27
- GRM
- 7.7
CMA / ARV
- ARV (on-the-fly)
- $269,468
- Comps found
- 12
Show comp detail 12 sales within ~0.75 mi
| Address | Dist | Beds/Ba | Sqft | Sold | Price | $/sf | Match |
|---|---|---|---|---|---|---|---|
| 56 Judy Dr | 0.00mi | 3/1.0 | 1,334 (0%) | 1mo | $157,000 | $118 | 99 |
| 708 Maran Dr | 0.20mi | 3/2.0 | 1,352 (+1%) | 5mo | $274,900 | $203 | 80 |
| 24 James Dr | 0.11mi | 3/2.0 | 1,368 (+2%) | 13mo | $214,900 | $157 | 76 |
| 34 James Dr | 0.09mi | 2/2.0 (-1) | 1,504 (+13%) | 3mo | $249,000 | $166 | 63 |
| 625 Nancy Dr | 0.30mi | 3/1.5 | 1,144 (-14%) | 2mo | $255,000 | $223 | 58 |
| 1101 Olde Coventry Dr | 0.43mi | 4/2.0 (+1) | 1,304 (-2%) | 13mo | $289,900 | $222 | 56 |
| 76 Ruth Dr | 0.72mi | 3/2.0 | 1,366 (+2%) | 3mo | $265,000 | $194 | 56 |
| 9 Mallard Ct | 0.59mi | 3/2.0 | 1,402 (+5%) | 7mo | $260,000 | $185 | 54 |
| 2532 Chartom Mar Dr | 0.59mi | 3/2.0 | 1,260 (-6%) | 7mo | $269,000 | $213 | 53 |
| 808 Ruth Dr | 0.59mi | 4/2.0 (+1) | 1,400 (+5%) | 10mo | $280,000 | $200 | 47 |
| 2602 Nettie Dr | 0.62mi | 3/1.5 | 1,190 (-11%) | 8mo | $250,000 | $210 | 45 |
| 417 Dove Dr | 0.69mi | 3/2.0 | 1,484 (+11%) | 8mo | $300,000 | $202 | 39 |
Match score weights: distance 35% · size 25% · config 20% · recency 20%. Top-matched comps best support the ARV.
Projected returns pro-forma
-3.0% appreciation · 3.2% rent growth · sell at horizon
- IRR
- -6.8%
- Equity multiple
- 0.75×
- Total profit
- $-11,089
- Equity at exit
- $23,409
- IRR
- 3.1%
- Equity multiple
- 1.23×
- Total profit
- $9,950
- Equity at exit
- $13,574
Cash invested: $43,960 (down + closing). Projections, not guarantees.
Landlord ↔ Tenant lean methodology
- Overall (STATE)
- 81 Strongly Landlord-Friendly
- State Missouri
- 81 Strongly Landlord-Friendly · R+10
- County
- — inherits STATE
- City
- — inherits STATE
ZIP-level market 63301
- Rents YoY
- 3.2%
- Active inventory
- 294
- Price-to-rent
- 7.7×
Monthly cashflow live
- Estimated rent
- $1,709 high interval (Pro) →
- Mortgage (P&I)
- −$823
- Tax from tax record
- −$242 /mo · $2,906/yr
- Insurance
- −$65
- HOA
- −$0
- Vacancy / Maint / Mgmt
- −$359
- Net cashflow
- $219
Break-even live
UW: 25.0% down · 7.5% · 30yr · 1.5% tax · 5.0% vac · 8.0% maint · 8.0% mgmt
Financing live
Cash to close
- Down payment
- $39,250
- Closing costs
- $4,710
- Reserves months
- —
- Total cash needed
- —
Loan-product check · same deal, 3 products live
Conventional
25% down · 7.5% · 30yr
- Down + closing
- —
- Monthly P&I
- —
- Monthly cashflow
- —
- DSCR
- —
- Eligible?
- —
Personal DTI + credit; lowest rate.
DSCR
20% down · 8.5% · 30yr
- Down + closing
- —
- Monthly P&I
- —
- Monthly cashflow
- —
- DSCR
- —
- Eligible?
- —
No personal income docs; deal must DSCR.
Hard money
10% down · 12.0% · 12mo
- Down + closing
- —
- Monthly P&I
- —
- Monthly cashflow
- —
- DSCR
- —
- Eligible?
- —
Short-term bridge; refi at stabilization.
Rent comps 10 comps
| Address | Beds | Baths | Sqft | Rent | $/sqft | DOM | Units | Dist |
|---|---|---|---|---|---|---|---|---|
| 2680 Droste Rd St Charles, MO | 2.0 | 1.5 | 1260 | $1,715 | $1.36 | 1d | 2 | 0.16mi |
| 1300 Sun Lake Dr St Charles, MO | 1.0–2.0 | 1.0–2.0 | 845 | $1,510 | $1.79 | 1d | 12 | 0.39mi |
| 920 Parkcrest Dr Unit 920 St Charles, MO | 2.0 | 1.5 | 1000 | $1,400 | $1.40 | 16d | 1 | 0.88mi |
| 820 Saint Charles Ave Saint Charles, MO | 4.0 | 2.0 | 1288 | $1,800 | $1.40 | 43d | 1 | 1.00mi |
| 2483 Falcons Way Saint Charles, MO | 2.0 | 1.5 | 1050 | $1,400 | $1.33 | 43d | 1 | 1.00mi |
| 2200 Lake Ct St Charles, MO | 2.0 | 1.0–2.0 | 784 | $1,749 | $2.23 | 1d | 15 | 1.06mi |
| 3405 Sherman Park Dr St Charles, MO | 2.0 | 2.5 | 1600 | $2,195 | $1.37 | 1d | 1 | 1.28mi |
| 2000 Sherman Square Dr St Charles, MO | 2.0 | 2.0 | 1092 | $1,612 | $1.48 | 1d | 3 | 1.32mi |
| 10 San Miguel Dr St Charles, MO | 1.0–2.0 | 1.0–1.5 | 897 | $1,794 | $2.00 | 1d | 13 | 1.47mi |
| 1400 Aberdeen Ct Saint Charles, MO | 1.0–2.0 | 1.0–2.0 | 950 | $1,994 | $2.10 | 1d | 25 | 1.48mi |
Listing history 20 events
-
2026-02-20status Pending
-
2026-02-03$157,000 Active
-
2021-10-08price $189,000
-
2019-04-03soldstatus $150,000
-
2019-03-29soldstatus Closed 519-char remark
Show marketing remark (519 chars)
One level living never looked so good as it does with this move-in ready ranch on almost half an acre. With 3 bedrooms, and a sizeable full bath, this home offers great relaxing spaces, a woodburning fireplace and a lot to love in just over 1300 square feet. A covered deck gives you a great space to enjoy your large private yard with mature trees for quiet evenings or great morning coffee. A 2 year old roof, 2 car garage with oversized off-street parking and freshly painted interior only add to this home's appeal.
-
2019-02-17status Pending 519-char remark
Show marketing remark (519 chars)
One level living never looked so good as it does with this move-in ready ranch on almost half an acre. With 3 bedrooms, and a sizeable full bath, this home offers great relaxing spaces, a woodburning fireplace and a lot to love in just over 1300 square feet. A covered deck gives you a great space to enjoy your large private yard with mature trees for quiet evenings or great morning coffee. A 2 year old roof, 2 car garage with oversized off-street parking and freshly painted interior only add to this home's appeal.
-
2019-02-07$150,000 Active 519-char remark
Show marketing remark (519 chars)
One level living never looked so good as it does with this move-in ready ranch on almost half an acre. With 3 bedrooms, and a sizeable full bath, this home offers great relaxing spaces, a woodburning fireplace and a lot to love in just over 1300 square feet. A covered deck gives you a great space to enjoy your large private yard with mature trees for quiet evenings or great morning coffee. A 2 year old roof, 2 car garage with oversized off-street parking and freshly painted interior only add to this home's appeal.
-
2017-04-25soldstatus $147,000
-
2017-04-21soldstatus Closed
-
2017-04-18status Pending
-
2017-03-23historical Contingent (No Kickout)
-
2017-02-08price $147,000
-
2016-12-19$149,000 Active
-
2009-10-29soldstatus $123,000
-
2009-07-10soldstatus
-
2006-05-23soldstatus $115,000
-
1997-04-01soldstatus
-
1993-04-01soldstatus $57,500
-
1990-08-01soldstatus $50,000
-
1987-07-01soldstatus $58,000
ⓘ Source: listings_history table (triggers on properties + properties_extension) + one-shot
backfill from property_details.listing_events for pre-trigger history.
Tax reassessment forecast MO · Resets to sale price
- Current annual tax
- $2,906 · $242/mo
- Projected year-2 tax
- $2,906 · $242/mo
- Expected delta
- $0/yr ($0/mo · 0.0%)
ⓘ Screening estimate from a state-policy table — verify with the county assessor before closing.
Climate risk First Street
- Flood 1/10 Low FEMA zone X (unshaded) · 0% chance over 30 yrs
- Wildfire 1/10 Low
- Heat 4/10 Moderate 7 d/yr ≥107°F today · 18 d/yr by 30 yrs out
- Wind 2/10 Low 100% chance of damaging wind over 30 yrs
- Air quality 3/10 Moderate 2 unhealthy d/yr today · 3 by 30 yrs out
Nearby sold comps map
Loading sold comps map…
Walkable amenities ~0.75 mi
Loading nearby amenities…
Taxation est. · year 1
- Rental income
- $20,506
- − Mortgage interest
- −$8,794
- − Property taxes
- −$2,906
- − Insurance
- −$785
- − Repairs & maintenance
- −$1,640
- − Management
- −$1,640
- − Depreciation
- −$4,567
- Taxable income
- $172
- Est. tax owed @ 24.0%
- −$41
- After-tax cash flow
- $2,588/yr
For passive investors: Depreciation is non-cash, so a rental often shows a tax loss while cash-flowing — sheltering income. Rental losses are passive: they offset passive income freely, and up to $25,000/yr can offset ordinary (W-2) income if you actively participate and your MAGI is under $100k (phasing out to $0 by $150k); unused losses carry forward. On sale, claimed depreciation is recaptured at up to 25%, and gains may owe capital-gains tax (a 1031 exchange can defer both). Figures are a year-1 estimate at your 24.0% rate — not tax advice; consult a CPA.
Schools (NCES district)
- District
- St. Charles R-VI
- NCES district ID
- 2928920
- Math proficiency
- 44% ▼ -4.00%
- Reading proficiency
- 52% ▼ -1.00%
- Median HH income
- $52,897
- Composite
- 41.38/100
- National rank
- #3486
- State rank
- #51 of 324 in MO
Livability — St. Charles
No livability data for this city. (Only ~50 U.S. cities are tracked.)
Census & demographics
- Census place
- St. Charles, MO
- County
- Saint Charles County · 399,703 people
- Metro
- St. Louis, MO-IL
- Population (ZIP)
- 52,667
- Household income
- $85,308
- Rent vs Own
- Severe rent burden
- 1118.0
Population outlook (St. Charles County) Hauer SSP2
- Today (2025)
- 437,857 people
- By 2030
- 461,707 · +5.4%
- By 2040
- 503,222 · +14.9%
- By 2050
- 534,684 · +22.1%
- By 2075
- 597,047 · +36.4%
- By 2100
- 609,682 · +39.2%
Race, ethnicity, and origin ACS 2023
- Neighborhood character
- Predominantly White (80%)
- Race & ethnicity
- White 80% Black 7% Two or more races 7% Hispanic / Latino 7% Asian 2%
- Hispanic origin (detail)
- Mexican 4%
- Common ancestry
- Lithuanian 3% Romanian 2% Italian 2%
- Foreign-born
- 5% · Canada, Guatemala
- Languages at home
- 93% English-only · Spanish 4%
Political lean MEDSL · St. Charles
- 2024 margin
- R (+17.0) · D 40.8% · R 57.8% · Other 1.4%
- 2008→2024 swing
- -7.2pp toward R · 2008: -9.7pp · 2024: -17.0pp
- All cycles
- 2024: R+17.0 2020: R+17.5 2016: R+26.4 2012: R+21.0 2008: R+9.7
Not yet ingested
- Civics
- —
Market trends
- HPI YoY
- ▼ -289.53%
- Current HPI
- 221.0637
- Rent YoY
- ▲ 3.20%
- Metro
- St. Louis, MO-IL
- State GDP YoY
- ▲ 1.84%
- F500 in state
- 20
Industry mix (Fortune 500 HQ in MO)
| Industry | F500 HQs | Revenue |
|---|---|---|
| Healthcare | 1 | $163B |
|
||
| Insurance | 1 | $21B |
|
||
| Industrial Technology | 1 | $17B |
|
||
| Retail | 1 | $16B |
|
||
| Industrial Distribution | 1 | $10B |
|
||
| Utilities | 1 | $9B |
|
||
Price history
+170.7% since first listed20 events — show timeline
- 2026-02-20 Pending — MARIS as Distributed by MLS Grid
- 2026-02-03 Listed $157,000 MARIS as Distributed by MLS Grid
- 2021-10-08 Price Changed $189,000 MARIS as Distributed by MLS Grid
- 2019-04-03 Sold (Public Records) $150,000 Public Records
- 2019-03-29 Sold (MLS) — MARIS as Distributed by MLS Grid
- 2019-02-17 Pending — MARIS as Distributed by MLS Grid
- 2019-02-07 Listed $150,000 MARIS as Distributed by MLS Grid
- 2017-04-25 Sold (Public Records) $147,000 Public Records
- 2017-04-21 Sold (MLS) — MARIS as Distributed by MLS Grid
- 2017-04-18 Pending — MARIS as Distributed by MLS Grid
- 2017-03-23 Contingent — MARIS as Distributed by MLS Grid
- 2017-02-08 Price Changed $147,000 MARIS as Distributed by MLS Grid
- 2016-12-19 Listed $149,000 MARIS as Distributed by MLS Grid
- 2009-10-29 Sold (Public Records) $123,000 Public Records
- 2009-07-10 Sold (Public Records) — Public Records
- 2006-05-23 Sold (Public Records) $115,000 Public Records
- 1997-04-01 Sold (Public Records) — Public Records
- 1993-04-01 Sold (Public Records) $57,500 Public Records
- 1990-08-01 Sold (Public Records) $50,000 Public Records
- 1987-07-01 Sold (Public Records) $58,000 Public Records
Property tax history
+4.3%/yrLatest (2025): $2,906 · +13.7% YoY. Source: county tax records.
Cash-flow waterfall
monthlySold comps — $/sqft
last 12 mo · ≤1 miLoading sold comps…