6057 Brandon St · Palm Beach Gardens, FL
Flood risk 1/10 · Minimal
- FEMA flood zone
- X (unshaded)
- Chance of flooding over 30 yrs
- 0.0%
- Est. flood insurance / yr
- $507 – $1,088
Fire risk 4/10 · Minor
- Est. fire insurance / yr
- $947 – $1,759
Heat risk 9/10 · Severe
- Hot days now (above 106°F)
- 7 days/yr
- Hot days in 30 yrs
- 24 days/yr
Wind risk 10/10 · Severe
- Chance of severe wind over 30 yrs
- 99.0%
Air-quality risk 2/10 · Minimal
- Unhealthy air days now
- 1 days/yr
- Unhealthy air days in 30 yrs
- 2 days/yr
Risk factors via First Street. Map © Google.
Why this score? — see what drove the D grade
The composite is a weighted blend of 9 inputs, each scored 0–100. Each bar is that input's sub-score; the figure is the points it added to the 100-point composite (weight × sub-score).
- Cash flow +13.5/30.0
- ARV discount +7.5/15.0
- Schools +4.3/10.0
- DSCR +4.1/10.0
- 1% rule +3.9/10.0
- Livability +3.5/5.0
- Rent growth +3.0/5.0
- Condition / age +2.5/5.0
- Appreciation +0.0/10.0
$429,000
🖨 Deal sheet (PDF) 📄 Offer letter ✓ Due diligence
Listing remarks MLS
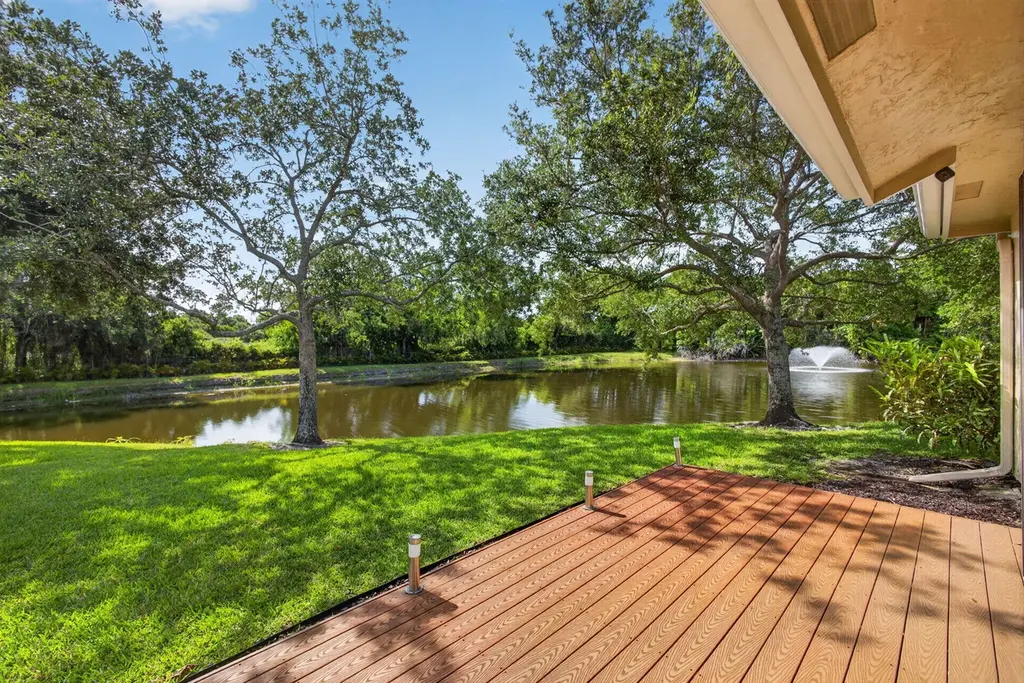
Open and bright with lake views. A den, an air conditioned Florida room, accordian hurricane shutters, and a screened porch. Wonderful feel and immaculate.
Key facts
- Cul d' sac location
- Eat in kitchen
- 4,160 sq ft lot
Tags
Property features AI
Finance
- Other: Pets allowed (with number limit); Community of approximately 950 units
- HOA & community: Community association with monthly HOA fee ($355/month); Association amenities include basketball court and recreation facilities; HOA covers cable TV, grounds maintenance, security, common areas, reserve funds, recreation facility
Exterior
- Parking: Attached garage (1.5 spaces; total 2 parking spaces, covered)
- Utilities: Public water; Public sewer; Cable connected
- Home design: Single-family residence; One story; Resale property; Faces west
- Construction: Frame, stucco, and wood siding construction; Shingle roof
- Exterior features: Screened patio; Patio; Property on a cul-de-sac; County road frontage (asphalt, publicly maintained); Waterfront
Interior
- Kitchen: Dishwasher; Disposal; Electric range / electric cooktop; Refrigerator; Electric water heater
- Bedrooms: 2 bedrooms on the main level
- Flooring: Tile
- Bathrooms: 2 full bathrooms; 1 half bathroom
- Heating & cooling: Central heating; Central air conditioning
- Interior features: Wet bar; Walk-in closets; Split bedroom layout; Roman tub; Shutters on windows
- Laundry & utility: Laundry closet
Neighborhood map
What this means for you Summary
Snapshot
- This is a 2-bed/2.0-bath single-family listed at $429k.
Deal economics
- At list price, monthly cash flow is $18 ($219/yr) — positive.
- The deal already cash-flows at list — no discount required.
- To meet the 1% rule (rent ≥ 1% of price), the offer needs to be $382k (11.0% below list).
- Recommended offer: $382k (11.0% below list) — sets the bar for 1% rule.
Location & tenants
- Location reads 69/100 on livability (#464 in FL) — a middle-class / working-renter tenant base. Strengths: crime A+, employment A+, housing A+; Watch: amenities F, commute F, cost of living F.
- Palm Beach (suburban): math 46% / reading 53% proficiency, ranked #34 of 73 in FL (top 47%) — families likely to look elsewhere, expect single-tenant / working-renter base with shorter leases.
- Zoned schools: Marsh Pointe Elementary (math 85% / reading 85%, grade A+, #35 of 2,144 statewide, top 2%, 835 students, 16% FRL); Watson B. Duncan Middle School (math 54% / reading 59%, grade B, #171 of 571 statewide, top 30%, 1,157 students, 41% FRL); William T. Dwyer High School (math 36% / reading 58%, grade D-, #207 of 667 statewide, top 32%, 2,206 students, 37% FRL) — zoned schools average 31% FRL vs 52% district-wide (21 pts lower); this property's tenant base skews higher-income than the district average.
- Zoned-school proficiency averages 63% at this address vs 50% district-wide (+13 pts) — the actual schools serving this property are materially stronger than the Palm Beach average implies; a family-tenant draw the district grade alone would hide.
- Market conditions: Rents rising (+2.0%/yr); 541 active listings in the ZIP; 40 comparable units currently listed for rent nearby; rentals at typical pace (median 20d on market — plan ~3-4 weeks tenant-placement turnaround); high-income renter base; 3,974 units permitted in Palm Beach County in 2024 (1,012 in 5+ unit buildings).
- This rent runs 37% of the median local income ($125k/yr) — at the standard rent-burdened threshold; future hikes will face affordability resistance.
Forward outlook
- Local home prices are declining (-3.0%/yr); year-one equity from $3k of loan paydown is wiped out by about $13k of value loss. Plan a longer hold.
- Palm Beach County population projected at +30% by 2050 — long-run rental-demand tailwind backs the buy-and-hold thesis.
Negotiation context
- Only 10 days on market — expect competitive offers; lowballing is unlikely to land.
- 8 sale attempts since 23y ago with the ask held roughly flat each time — persistent listings suggest the price (not the market) is what's stuck; bring a comps-based counter.
- Current owner paid $100k; list at $429k implies a 329% gain — meaningful room to come down on a strong offer.
Risks & watch-outs
- Climate carrying-cost: severe wind risk, 99% chance of damaging wind over 30y; extreme-heat days projected 7→24/yr by 2055 (HVAC capex compounding) — expect insurance premiums to compound above CPI over the hold.
Questions for the listing agent
- What does the HOA fee cover, when was the last increase, and are there any pending special assessments or reserve-fund shortfalls?
- Is there a deadline driving the sale (1031 exchange, divorce, estate, relocation)? That informs how much negotiation room exists.
- Schools are B-rated — typically a magnet for longer-tenancy family renters. What's the average tenant stay here, and is there a school-zone premium baked into asking?
- The area grade is low — what's the realistic commute time and amenity access for the typical tenant pool here? Any planned neighborhood developments (good or bad) we should know about?
- What's the average days-on-market for RENTAL listings here right now (not sales)? A rising rental-DOM trend means longer vacancies and softer asking-rent achievability than the comps imply.
- What's the recent tenant-quality profile in this submarket — average credit score on applications, eviction rate, late-payment / NSF rate, and stable-employment percentage? A property-management company in the area should have these aggregated.
- How much new for-sale + rental construction is in the pipeline within 1–3 miles? Heavy new supply typically softens prices + rents 12–24 months out; constrained supply supports both.
Investment metrics
- 1% rule
- 0.89% ✗
- Cap rate
- 6.34%
- Cash-on-cash
- 0.18%
- DSCR
- 1.01
- GRM
- 9.4
CMA / ARV
No comps found within radius.
Projected returns pro-forma
-3.0% appreciation · 2.0% rent growth · sell at horizon
- IRR
- -17.1%
- Equity multiple
- 0.40×
- Total profit
- $-72,081
- Equity at exit
- $63,965
- IRR
- -11.0%
- Equity multiple
- 0.37×
- Total profit
- $-76,255
- Equity at exit
- $37,092
Cash invested: $120,120 (down + closing). Projections, not guarantees.
Landlord ↔ Tenant lean methodology
- Overall (STATE)
- 87 Strongly Landlord-Friendly
- State Florida
- 87 Strongly Landlord-Friendly · R+3
- County
- — inherits STATE
- City
- — inherits STATE
ZIP-level market 33418
- Home prices YoY
- -32.4%
- Rents YoY
- 2.0%
- Active inventory
- 541
- Price-to-rent
- 9.4×
Monthly cashflow live
- Estimated rent
- $3,820 high interval (Pro) →
- Mortgage (P&I)
- −$2,250
- Tax from tax record
- −$216 /mo · $2,592/yr
- Insurance
- −$179
- HOA
- −$355
- Vacancy / Maint / Mgmt
- −$802
- Net cashflow
- $18
Break-even live
Sensitivity live
| Price | -10% $261 | -5% $140 | +0% $18 | +5% $-103 | +10% $-225 |
|---|---|---|---|---|---|
| Rent | -10% $-284 | -5% $-133 | +0% $18 | +5% $169 | +10% $320 |
| Rate | -1.0pp $234 | -0.5pp $127 | base $18 | +0.5pp $-93 | +1.0pp $-206 |
UW: 25.0% down · 7.5% · 30yr · 1.5% tax · 5.0% vac · 8.0% maint · 8.0% mgmt
Financing live
Cash to close
- Down payment
- $107,250
- Closing costs
- $12,870
- Reserves months
- —
- Total cash needed
- —
Loan-product check · same deal, 3 products live
Conventional
25% down · 7.5% · 30yr
- Down + closing
- —
- Monthly P&I
- —
- Monthly cashflow
- —
- DSCR
- —
- Eligible?
- —
Personal DTI + credit; lowest rate.
DSCR
20% down · 8.5% · 30yr
- Down + closing
- —
- Monthly P&I
- —
- Monthly cashflow
- —
- DSCR
- —
- Eligible?
- —
No personal income docs; deal must DSCR.
Hard money
10% down · 12.0% · 12mo
- Down + closing
- —
- Monthly P&I
- —
- Monthly cashflow
- —
- DSCR
- —
- Eligible?
- —
Short-term bridge; refi at stabilization.
Rent comps 40 comps
| Address | Beds | Baths | Sqft | Rent | $/sqft | DOM | Units | Dist |
|---|---|---|---|---|---|---|---|---|
| 12921 Trevi Isle Dr Palm Beach Gardens, FL | 3.0 | 2.5 | 1930 | $4,500 | $2.33 | 25d | 1 | 0.08mi |
| 12885 Trevi Isle Dr Palm Beach Gardens, FL | 3.0 | 2.5 | 1832 | $4,100 | $2.24 | 14d | 1 | 0.13mi |
| 6198 Brandon St Unit 6198 West Palm Beach, FL | 3.0 | 2.0 | 1905 | $3,800 | $1.99 | 13d | 1 | 0.19mi |
| 6198 Brandon St West Palm Beach, FL | 3.0 | 2.0 | 1905 | $5,000 | $2.62 | 25d | 1 | 0.19mi |
| 12751 Touchstone Pl Palm Beach Gardens, FL | 2.0 | 2.0 | 1741 | $3,550 | $2.04 | 25d | 1 | 0.34mi |
| 6403 Eastpointe Pines St Palm Beach Gardens, FL | 2.0 | 2.0 | 1656 | $4,500 | $2.72 | 25d | 1 | 0.43mi |
| 6403 Eastpointe Pines St Palm Beach Gardens, FL | 2.0 | 2.0 | 1656 | $4,500 | $2.72 | 3d | 1 | 0.43mi |
| 5653 Golden Eagle Cir Palm Beach Gardens, FL | 3.0 | 2.0 | 1276 | $3,200 | $2.51 | 13d | 1 | 0.58mi |
| 6672 S Pine Ct Palm Beach Gardens, FL | 2.0 | 2.0 | 1778 | $6,900 | $3.88 | 21d | 1 | 0.62mi |
| 12870 Briarlake Dr #205 Palm Beach Gardens, FL | 2.0 | 2.0 | 1400 | $3,000 | $2.14 | 25d | 1 | 0.64mi |
| 12926 Briarlake Dr #201 Palm Beach Gardens, FL | 2.0 | 2.0 | 1300 | $2,850 | $2.19 | 15d | 1 | 0.67mi |
| 13289 Touchstone Pl Palm Beach Gardens, FL | 2.0 | 2.0 | 1328 | $4,000 | $3.01 | 25d | 1 | 0.76mi |
| 5457 Eagle Lake Dr Palm Beach Gardens, FL | 2.0 | 2.0 | 1276 | $2,800 | $2.19 | 25d | 1 | 0.79mi |
| 13403 Touchstone Pl Unit A-102 West Palm Beach, FL | 2.0 | 2.0 | 1245 | $3,000 | $2.41 | 8d | 1 | 0.86mi |
| 100 Portofino Dr Palm Beach Gardens, FL | 1.0–3.0 | 1.0–2.0 | 1183 | $2,667 | $2.25 | 0d | 51 | 0.91mi |
| 246 Barbados Dr Jupiter, FL | 3.0 | 2.0 | 2020 | $6,500 | $3.22 | 18d | 1 | 1.15mi |
| 3333 Central Gardens Cir Palm Beach Gardens, FL | 2.0–3.0 | 2.0 | 1597 | $3,200 | $2.00 | 3d | 5 | 1.23mi |
| 3319 Central Gardens Cir Unit Elite Palm Beach Gardens, FL | 2.0 | 2.0 | 1415 | $3,201 | $2.26 | 11d | 1 | 1.29mi |
| 3319 Central Gardens Cir Unit Elite Palm Beach Gardens, FL | 2.0 | 2.0 | 1415 | $3,469 | $2.45 | 6d | 1 | 1.29mi |
| 4045 Central Gardens Way Palm Beach Gardens, FL | 1.0–3.0 | 1.0–2.0 | 1175 | $3,071 | $2.61 | 0d | 19 | 1.32mi |
| 6088 Heather St Jupiter, FL | 2.0 | 2.0 | 1080 | $2,500 | $2.31 | 23d | 1 | 1.36mi |
| 6088 Heather St Jupiter, FL | 2.0 | 2.0 | 1080 | $2,500 | $2.31 | 25d | 1 | 1.36mi |
| 4891 Bonsai Cir #101 Palm Beach Gardens, FL | 3.0 | 2.0 | 1222 | $3,000 | $2.45 | 4d | 1 | 1.36mi |
| 4930 Bonsai Cir #208 Palm Beach Gardens, FL | 2.0 | 2.0 | 1077 | $2,800 | $2.60 | 25d | 1 | 1.37mi |
| 4870 Bonsai Cir #200 Palm Beach Gardens, FL | 2.0 | 2.0 | 1421 | $3,000 | $2.11 | 25d | 1 | 1.40mi |
| 5009 Dulce Ct Palm Beach Gardens, FL | 3.0 | 2.5 | 1855 | $5,500 | $2.96 | 3d | 1 | 1.42mi |
| 4861 Bonsai Cir #101 Palm Beach Gardens, FL | 3.0 | 2.0 | 1222 | $3,000 | $2.45 | 17d | 1 | 1.43mi |
| 4861 Bonsai Cir #105 Palm Beach Gardens, FL | 3.0 | 2.5 | 1741 | $3,000 | $1.72 | 19d | 1 | 1.43mi |
| 4861 Bonsai Cir Palm Beach Gardens, FL | 3.0 | 2.0 | 1222 | $3,000 | $2.45 | 6d | 1 | 1.43mi |
| 6051 Kendrick St Jupiter, FL | 3.0 | 2.0 | 1572 | $4,450 | $2.83 | 17d | 1 | 1.44mi |
| 6051 Kendrick St Jupiter, FL | 3.0 | 2.0 | 1572 | $4,450 | $2.83 | 11d | 1 | 1.44mi |
| 4851 Bonsai Cir Palm Beach Gardens, FL | 2.0–3.0 | 2.0 | 1149 | $3,000 | $2.61 | 12d | 2 | 1.45mi |
| 4851 Bonsai Cir Palm Beach Gardens, FL | 2.0–3.0 | 2.0 | 1149 | $2,725 | $2.37 | 21d | 3 | 1.45mi |
| 4851 Bonsai Cir Palm Beach Gardens, FL | 2.0 | 2.0 | 1149 | $2,862 | $2.49 | 5d | 2 | 1.45mi |
| 4991 Bonsai Cir #111 Palm Beach Gardens, FL | 3.0 | 2.5 | 1851 | $4,000 | $2.16 | 25d | 1 | 1.47mi |
| 4991 Bonsai Cir #111 Palm Beach Gardens, FL | 3.0 | 2.5 | 1851 | $4,000 | $2.16 | 23d | 1 | 1.47mi |
| 1101 Myrtlewood Cir E Unit 101 Palm Beach Gardens, FL | 2.0 | 2.0 | 1213 | $2,150 | $1.77 | 25d | 1 | 1.48mi |
| 1201 Myrtlewood Cir E Palm Beach Gardens, FL | 2.0 | 2.0 | 1213 | $2,600 | $2.14 | 25d | 1 | 1.48mi |
| 5203 Myrtlewood Cir E Palm Beach Gardens, FL | 2.0 | 2.0 | 1202 | $2,600 | $2.16 | 25d | 1 | 1.48mi |
| 7302 Myrtlewood Cir W Palm Beach Gardens, FL | 3.0 | 2.0 | 1193 | $3,200 | $2.68 | 25d | 1 | 1.48mi |
HOA detail
- Monthly dues
- $355 · $4,260/yr
Listing history 7 events
-
2026-06-21days on market $429,000 Active 10 DOM
-
2026-06-18days on market $429,000 Active 7 DOM
-
2026-06-17days on market $429,000 Active 6 DOM
-
2026-06-16days on market $429,000 Active 5 DOM
-
2026-06-15days on market $429,000 Active 4 DOM
-
2026-06-13remarks 699-char remark
-
2026-06-13$429,000 Active 2 DOM
ⓘ Source: listings_history table (triggers on properties + properties_extension) + one-shot
backfill from property_details.listing_events for pre-trigger history.
Tax reassessment forecast FL · Resets to sale price
- Current annual tax
- $2,592 · $216/mo
- Projected year-2 tax
- $3,561 · $297/mo
- Expected delta
- +$969/yr (+$81/mo · 37.4%)
ⓘ Screening estimate from a state-policy table — verify with the county assessor before closing.
Climate risk First Street
- Flood 1/10 Low FEMA zone X (unshaded) · 0% chance over 30 yrs
- Wildfire 4/10 Moderate
- Heat 9/10 Extreme 7 d/yr ≥106°F today · 24 d/yr by 30 yrs out
- Wind 10/10 Extreme 99% chance of damaging wind over 30 yrs
- Air quality 2/10 Low 1 unhealthy d/yr today · 2 by 30 yrs out
Nearby sold comps map
Loading sold comps map…
Walkable amenities ~0.75 mi
Loading nearby amenities…
Taxation est. · year 1
- Rental income
- $45,838
- − Mortgage interest
- −$24,031
- − Property taxes
- −$2,592
- − Insurance
- −$2,145
- − Repairs & maintenance
- −$3,667
- − Management
- −$3,667
- − HOA
- −$4,260
- − Depreciation
- −$12,480
- Taxable loss
- −$7,003
- Est. tax savings @ 24.0%
- +$1,681
- After-tax cash flow
- $1,900/yr
For passive investors: Depreciation is non-cash, so a rental often shows a tax loss while cash-flowing — sheltering income. Rental losses are passive: they offset passive income freely, and up to $25,000/yr can offset ordinary (W-2) income if you actively participate and your MAGI is under $100k (phasing out to $0 by $150k); unused losses carry forward. On sale, claimed depreciation is recaptured at up to 25%, and gains may owe capital-gains tax (a 1031 exchange can defer both). Figures are a year-1 estimate at your 24.0% rate — not tax advice; consult a CPA.
Schools (NCES district)
- District
- Palm Beach
- NCES district ID
- 1201500
- Math proficiency
- 46% ▼ -16.00%
- Reading proficiency
- 53% ▼ -4.00%
- Median HH income
- $53,943
- Composite
- 42.72/100
- National rank
- #3160
- State rank
- #34 of 73 in FL
Livability — Palm Beach Gardens
- Score
- 69/100
- State rank
- #464
- US rank
- #8366
Category grades
Schools grade is shown separately in the Schools card above.
Census & demographics
- County
- Palm Beach County · 1,438,312 people
- City population
- 96,294
- Metro
- Miami-Fort Lauderdale-Pompano Beach, FL
- Population (ZIP)
- 43,676
- Household income
- $125,497
- Rent vs Own
- Severe rent burden
- 1339.0
Population outlook (Palm Beach County) Hauer SSP2
- Today (2025)
- 1,637,487 people
- By 2030
- 1,743,255 · +6.5%
- By 2040
- 1,948,712 · +19.0%
- By 2050
- 2,132,979 · +30.3%
- By 2075
- 2,530,027 · +54.5%
- By 2100
- 2,706,979 · +65.3%
Race, ethnicity, and origin ACS 2023
- Neighborhood character
- Predominantly White (75%)
- Race & ethnicity
- White 75% Hispanic / Latino 13% Two or more races 9% Black 5% Asian 4%
- Hispanic origin (detail)
- Mexican 2% Puerto Rican 2% Cuban 2%
- Common ancestry
- Romanian 5% Lithuanian 4% Scotch-Irish 4%
- Foreign-born
- 15% · Canada, China, Jamaica
- Languages at home
- 83% English-only · Spanish 8% German/W. Germanic 2% Other Indo-European 2%
Political lean MEDSL · Palm Beach
- 2024 margin
- Toss-up / Even · D 50.0% · R 49.2%
- 2008→2024 swing
- -22.1pp toward R · 2008: 22.9pp · 2024: 0.8pp
- All cycles
- 2024: D+0.8 2020: D+12.8 2016: D+15.3 2012: D+17.0 2008: D+22.9
Not yet ingested
- Civics
- —
Market trends
- HPI YoY
- ▼ -172.79%
- Current HPI
- 361.1997
- Rent YoY
- ▲ 2.00%
- Metro
- Miami-Fort Lauderdale-Pompano Beach, FL
- State GDP YoY
- ▲ 3.28%
- F500 in state
- 36
Industry mix (Fortune 500 HQ in FL)
| Industry | F500 HQs | Revenue |
|---|---|---|
| Industrial Technology | 2 | $29B |
|
||
| Insurance | 2 | $17B |
|
||
| Retail | 1 | $60B |
|
||
| Technology Distribution | 1 | $58B |
|
||
| Homebuilding | 1 | $35B |
|
||
| Technology Manufacturing | 1 | $35B |
|
||
Price history
+146.6% since first listed20 events — show timeline
- 2026-06-11 Listed $429,000 Beaches MLS
- 2012-07-16 Sold (MLS) $100,000 Beaches MLS
- 2012-05-23 Listing Removed — Beaches MLS
- 2012-05-04 Listed $100,000 Beaches MLS
- 2012-04-30 Listing Removed — Beaches MLS
- 2012-01-16 Listed $129,900 Beaches MLS
- 2012-01-13 Listing Removed — Beaches MLS
- 2011-04-25 Listed $144,900 Beaches MLS
- 2010-05-04 Listing Removed — Beaches MLS
- 2009-05-01 Listed $199,000 Beaches MLS
- 2008-12-31 Listing Removed — Beaches MLS
- 2008-01-28 Listed $189,900 Beaches MLS
- 2005-03-30 Sold (Public Records) $259,900 Public Records
- 2004-10-18 Sold (Public Records) $162,000 Public Records
- 2004-03-12 Sold (Public Records) $147,000 Public Records
- 2004-03-10 Sold (MLS) $147,000 Beaches MLS
- 2004-03-09 Listing Removed — Beaches MLS
- 2003-09-26 Listed $165,000 Beaches MLS
- 2003-09-25 Listing Removed — Beaches MLS
- 2003-06-24 Listed $174,000 Beaches MLS
Property tax history
-0.6%/yrLatest (2025): $2,592 · +3.5% YoY. Source: county tax records.
Cash-flow waterfall
monthlySold comps — $/sqft
last 12 mo · ≤1 miLoading sold comps…