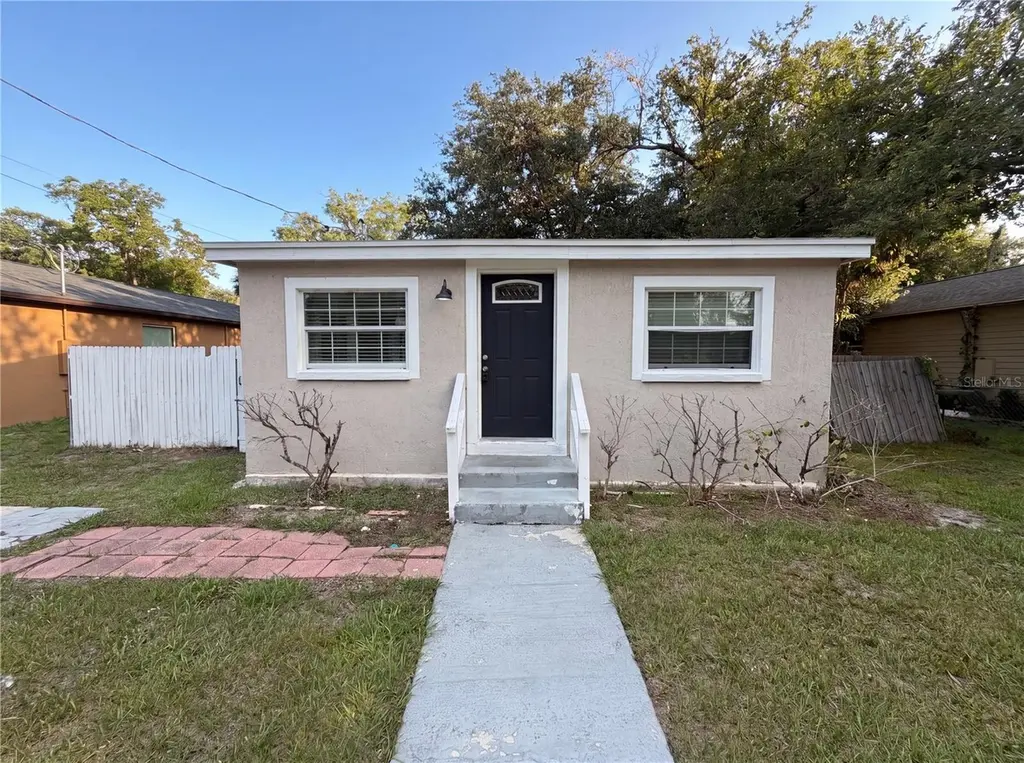
1506 W 16th St · Sanford, FL
Flood risk 1/10 · Minimal
- FEMA flood zone
- X (unshaded)
- Chance of flooding over 30 yrs
- 0.0%
- Est. flood insurance / yr
- $507 – $1,088
Fire risk 1/10 · Minimal
- Est. fire insurance / yr
- $947 – $1,759
Heat risk 8/10 · Major
- Hot days now (above 107°F)
- 7 days/yr
- Hot days in 30 yrs
- 21 days/yr
Wind risk 9/10 · Severe
- Chance of severe wind over 30 yrs
- 99.0%
Air-quality risk 2/10 · Minimal
- Unhealthy air days now
- 1 days/yr
- Unhealthy air days in 30 yrs
- 1 days/yr
Risk factors via First Street. Map © Google.
Why this score? — see what drove the C- grade
The composite is a weighted blend of 9 inputs, each scored 0–100. Each bar is that input's sub-score; the figure is the points it added to the 100-point composite (weight × sub-score).
- ARV discount +15.0/15.0
- Cash flow +13.8/30.0
- Schools +5.1/10.0
- DSCR +4.2/10.0
- Livability +3.7/5.0
- 1% rule +3.3/10.0
- Rent growth +2.6/5.0
- Condition / age +2.5/5.0
- Appreciation +0.0/10.0
$207,000
🖨 Deal sheet (PDF) 📄 Offer letter ✓ Due diligence
Listing remarks MLS
Remodeled home. New paint inside and outside. Ceramic titles and laminate floors. Brand new roof 2019. Bathrooms remodeled.
Key facts
- Practical floor plan
- 7,100 sq ft lot
- Built 1950
Tags
Property features AI
Finance
- Other: Lot about 0.16 acre (approximately 0 to less than 1/4 acre); Asphalt road access
- Financial info: Lease restrictions apply
- HOA & community: No association amenities; No community features
Exterior
- Parking: No designated parking
- Security: Owned security system
- Utilities: Public water; Public sewer; Electricity available; Natural gas available; Water service available
- Home design: Single-family residence; One level (single story); Faces south; Residential property
- Construction: Block and wood siding construction; Shingle roof; Slab foundation; Built with approximately 970 square feet of living area
- Exterior features: Other exterior features; Other fencing
Interior
- Kitchen: Appliances: Other
- Bedrooms: 3 bedrooms
- Flooring: Tile
- Bathrooms: 2 full bathrooms
- Heating & cooling: Heat pump heating; Central air conditioning
- Interior features: Living room and dining room combined; Tile flooring; Security system (owned)
- Laundry & utility: Laundry: Other
Neighborhood map
What this means for you Summary
Snapshot
- This is a 3-bed/2.0-bath single-family listed at $207k.
Deal economics
- At list price, monthly cash flow is $17 ($208/yr) — positive.
- The deal already cash-flows at list — no discount required.
- To meet the 1% rule (rent ≥ 1% of price), the offer needs to be $171k (17.3% below list).
- Recommended offer: $171k (17.3% below list) — sets the bar for 1% rule.
- Cap rate 6.4% vs local median 3.6% in Sanford — top-decile yield for the area; either an underpriced asset or a hidden risk that comps aren't pricing in. Stress-test before assuming the spread holds.
Location & tenants
- Location reads 73/100 on livability (#316 in FL) — a middle-class / working-renter tenant base. Strengths: cost of living A+, housing A+, health & safety A+; Watch: employment C-, crime F, amenities F.
- Seminole (suburban): math 57% / reading 61% proficiency, ranked #13 of 73 in FL (top 18%) — acceptable for families but not a draw, mixed tenant base, ~2y average lease.
- Zoned schools: Bentley Elementary School (math 53% / reading 60%, grade C+, #816 of 2,144 statewide, top 39%, 949 students, 68% FRL); Sanford Middle School (math 62% / reading 62%, grade B+, #122 of 571 statewide, top 21%, 1,372 students, 47% FRL); Seminole High School (math 35% / reading 51%, grade F, #255 of 667 statewide, top 39%, 4,036 students, 53% FRL) — zoned schools average 56% FRL vs 38% district-wide (18 pts higher); higher-poverty schools than district average — tighter screening recommended.
- Market conditions: Rents flat; 565 active listings in the ZIP; 40 comparable units currently listed for rent nearby; rentals at typical pace (median 20d on market — plan ~3-4 weeks tenant-placement turnaround); solid renter incomes; 1,979 units permitted in Seminole County in 2024 (1,191 in 5+ unit buildings).
Forward outlook
- Local home prices are declining (-3.0%/yr); year-one equity from $1k of loan paydown is wiped out by about $6k of value loss. Plan a longer hold.
- Seminole County population projected at +24% by 2050 — long-run rental-demand tailwind backs the buy-and-hold thesis.
Negotiation context
- Only 13 days on market — expect competitive offers; lowballing is unlikely to land.
- 7 sale attempts since 7y ago with the ask held roughly flat each time — persistent listings suggest the price (not the market) is what's stuck; bring a comps-based counter.
- Current owner paid $129k; list at $207k implies a 60% gain — meaningful room to come down on a strong offer.
Risks & watch-outs
- Watch-outs: built in 1950 — expect roof / HVAC / electrical / plumbing capex.
- Climate carrying-cost: severe wind risk, 99% chance of damaging wind over 30y; extreme-heat days projected 7→21/yr by 2055 (HVAC capex compounding) — expect insurance premiums to compound above CPI over the hold.
Questions for the listing agent
- Built in 1950 — when were the roof, HVAC, electrical panel, plumbing, and water heater last replaced?
- Is there a deadline driving the sale (1031 exchange, divorce, estate, relocation)? That informs how much negotiation room exists.
- Schools are B-rated — typically a magnet for longer-tenancy family renters. What's the average tenant stay here, and is there a school-zone premium baked into asking?
- Crime grade is F in this area — have there been break-ins, vandalism, or insurance claims at this property in the last 3 years? What carrier currently insures it and at what premium?
- What's the average days-on-market for RENTAL listings here right now (not sales)? A rising rental-DOM trend means longer vacancies and softer asking-rent achievability than the comps imply.
- What's the recent tenant-quality profile in this submarket — average credit score on applications, eviction rate, late-payment / NSF rate, and stable-employment percentage? A property-management company in the area should have these aggregated.
- How much new for-sale + rental construction is in the pipeline within 1–3 miles? Heavy new supply typically softens prices + rents 12–24 months out; constrained supply supports both.
Investment metrics
- 1% rule
- 0.83% ✗
- Cap rate
- 6.39%
- Cash-on-cash
- 0.36%
- DSCR
- 1.02
- GRM
- 10.1
CMA / ARV
- ARV (on-the-fly)
- $260,930
- Comps found
- 12
Show comp detail 12 sales within ~0.75 mi
| Address | Dist | Beds/Ba | Sqft | Sold | Price | $/sf | Match |
|---|---|---|---|---|---|---|---|
| 1712 W 15th St | 0.14mi | 3/2.0 | 1,014 (+4%) | 1mo | $181,900 | $179 | 85 |
| 1306 W 16th St | 0.15mi | 3/1.5 | 923 (-5%) | 4mo | $204,900 | $222 | 79 |
| 101 Country Club Dr | 0.31mi | 3/2.0 | 1,028 (+6%) | 1mo | $292,000 | $284 | 75 |
| 1805 W 15th St | 0.17mi | 2/1.0 (-1) | 1,001 (+3%) | 5mo | $175,000 | $175 | 74 |
| 1011 W 16th St | 0.34mi | 3/2.0 | 916 (-6%) | 2mo | $249,000 | $272 | 74 |
| 1809 Pear Ave | 0.26mi | 3/1.0 | 912 (-6%) | 2mo | $199,000 | $218 | 72 |
| 115 Hays Dr | 0.41mi | 3/1.5 | 1,038 (+7%) | 3mo | $296,000 | $285 | 65 |
| 2005 Hartwell Ave | 0.38mi | 3/1.5 | 1,057 (+9%) | 0mo | $294,900 | $279 | 65 |
| 100 Hays Dr | 0.33mi | 2/1.0 (-1) | 852 (-12%) | 5mo | $230,000 | $270 | 51 |
| 127 Bob Thomas Cir | 0.67mi | 3/1.0 | 836 (-14%) | 5mo | $215,000 | $257 | 38 |
| 102 Mayrose Dr | 0.57mi | 2/1.0 (-1) | 830 (-14%) | 6mo | $223,000 | $269 | 36 |
| 129 Mayfair Cir | 0.65mi | 2/1.0 (-1) | 830 (-14%) | 2mo | $205,000 | $247 | 35 |
Match score weights: distance 35% · size 25% · config 20% · recency 20%. Top-matched comps best support the ARV.
Projected returns pro-forma
-3.0% appreciation · 0.38% rent growth · sell at horizon
- IRR
- -18.5%
- Equity multiple
- 0.36×
- Total profit
- $-36,871
- Equity at exit
- $30,864
- IRR
- -16.8%
- Equity multiple
- 0.17×
- Total profit
- $-47,939
- Equity at exit
- $17,898
Cash invested: $57,960 (down + closing). Projections, not guarantees.
Landlord ↔ Tenant lean methodology
- Overall (STATE)
- 87 Strongly Landlord-Friendly
- State Florida
- 87 Strongly Landlord-Friendly · R+3
- County
- — inherits STATE
- City
- — inherits STATE
ZIP-level market 32771
- Rents YoY
- 0.4%
- Active inventory
- 565
- Price-to-rent
- 10.1×
Monthly cashflow live
- Estimated rent
- $1,711 high interval (Pro) →
- Mortgage (P&I)
- −$1,086
- Tax from tax record
- −$163 /mo · $1,953/yr
- Insurance
- −$86
- HOA
- −$0
- Vacancy / Maint / Mgmt
- −$359
- Net cashflow
- $17
Break-even live
Sensitivity live
| Price | -10% $134 | -5% $76 | +0% $17 | +5% $-41 | +10% $-100 |
|---|---|---|---|---|---|
| Rent | -10% $-118 | -5% $-50 | +0% $17 | +5% $85 | +10% $152 |
| Rate | -1.0pp $122 | -0.5pp $70 | base $17 | +0.5pp $-36 | +1.0pp $-91 |
UW: 25.0% down · 7.5% · 30yr · 1.5% tax · 5.0% vac · 8.0% maint · 8.0% mgmt
Financing live
Cash to close
- Down payment
- $51,750
- Closing costs
- $6,210
- Reserves months
- —
- Total cash needed
- —
Loan-product check · same deal, 3 products live
Conventional
25% down · 7.5% · 30yr
- Down + closing
- —
- Monthly P&I
- —
- Monthly cashflow
- —
- DSCR
- —
- Eligible?
- —
Personal DTI + credit; lowest rate.
DSCR
20% down · 8.5% · 30yr
- Down + closing
- —
- Monthly P&I
- —
- Monthly cashflow
- —
- DSCR
- —
- Eligible?
- —
No personal income docs; deal must DSCR.
Hard money
10% down · 12.0% · 12mo
- Down + closing
- —
- Monthly P&I
- —
- Monthly cashflow
- —
- DSCR
- —
- Eligible?
- —
Short-term bridge; refi at stabilization.
Rent comps 40 comps
| Address | Beds | Baths | Sqft | Rent | $/sqft | DOM | Units | Dist |
|---|---|---|---|---|---|---|---|---|
| 1515 S Oleander Ave Sanford, FL | 2.0 | 2.0 | 1100 | $1,500 | $1.36 | 25d | 1 | 0.03mi |
| 1908 W 16th St Sanford, FL | 3.0 | 2.0 | 1100 | $1,500 | $1.36 | 22d | 1 | 0.23mi |
| 1935 W 14th St Sanford, FL | 3.0 | 1.5 | 1112 | $1,900 | $1.71 | 4d | 1 | 0.27mi |
| 106 Garrison Dr Sanford, FL | 3.0 | 2.0 | 1080 | $1,895 | $1.75 | 6d | 1 | 0.41mi |
| 1001 W 8th St Unit 1 Sanford, FL | 3.0 | 1.0 | 1075 | $2,250 | $2.09 | 23d | 1 | 0.61mi |
| 2450 Hartwell Ave Sanford, FL | 2.0 | 2.0 | 784 | $1,400 | $1.79 | 25d | 1 | 0.68mi |
| 2450 Hartwell Ave Sanford, FL | 2.0 | 2.0 | 784 | $1,400 | $1.79 | 19d | 1 | 0.68mi |
| 2450 Hartwell Ave Sanford, FL | 2.0 | 2.0 | 784 | $1,400 | $1.79 | 14d | 1 | 0.68mi |
| 2406 S Lake Ave Sanford, FL | 3.0 | 2.0 | 1111 | $2,000 | $1.80 | 16d | 1 | 0.70mi |
| 2420 S Lake Ave Unit B Sanford, FL | 3.0 | 1.0 | 1100 | $1,545 | $1.40 | 19d | 1 | 0.77mi |
| 2420 S Lake Ave Sanford, FL | 3.0 | 1.0 | 1100 | $1,545 | $1.40 | 16d | 1 | 0.77mi |
| 2417 Cedar Ave Unit B Sanford, FL | 2.0 | 2.0 | 840 | $1,500 | $1.79 | 0d | 1 | 0.79mi |
| 2437 Chase Ave Unit A Sanford, FL | 2.0 | 1.0 | 875 | $1,199 | $1.37 | 25d | 1 | 0.83mi |
| 2511 Ridgewood Ave Sanford, FL | 2.0 | 1.0 | 1000 | $1,395 | $1.40 | 25d | 1 | 0.86mi |
| 1013 W 3rd St Unit B Sanford, FL | 2.0 | 1.0 | 800 | $1,195 | $1.49 | 16d | 1 | 0.87mi |
| 2735 Bungalow Blvd Sanford, FL | 2.0 | 1.0 | 700 | $1,025 | $1.46 | 6d | 1 | 0.91mi |
| 2735 Bungalow Blvd Sanford, FL | 2.0 | 1.0 | 700 | $1,025 | $1.46 | 0d | 1 | 0.91mi |
| 2539 Ridgewood Ave Sanford, FL | 2.0 | 2.0 | 816 | $1,095 | $1.34 | 22d | 1 | 0.96mi |
| 1704 Ridgewood Ln Sanford, FL | 2.0 | 1.0 | 837 | $1,350 | $1.61 | 25d | 1 | 1.02mi |
| 101 E 21st St Sanford, FL | 3.0 | 2.0 | 896 | $2,500 | $2.79 | 25d | 1 | 1.05mi |
| 612 S Park Ave Unit 4 Sanford, FL | 2.0 | 1.0 | 720 | $1,295 | $1.80 | 23d | 1 | 1.12mi |
| 100 Windchase Blvd Sanford, FL | 1.0–3.0 | 1.0–2.0 | 957 | $1,695 | $1.77 | 5d | 1 | 1.17mi |
| 2714 Ridgewood Ave Sanford, FL | 1.0–2.0 | 1.0–2.0 | 987 | $1,650 | $1.67 | 0d | 6 | 1.29mi |
| 2541 Myrtle Ave Unit C Sanford, FL | 2.0 | 2.0 | 1000 | $1,465 | $1.47 | 4d | 1 | 1.30mi |
| 2522 S Oak Ave Unit A Sanford, FL | 2.0 | 2.0 | 963 | $1,300 | $1.35 | 25d | 1 | 1.32mi |
| 1324 S Pine Ridge Cir Unit D2 Sanford, FL | 2.0 | 2.0 | 1025 | $1,690 | $1.65 | 25d | 1 | 1.32mi |
| 2995 Railside Loop Sanford, FL | 1.0–3.0 | 1.0–2.0 | 961 | $2,458 | $2.56 | 6d | 21 | 1.33mi |
| 2995 Railside Loop Sanford, FL | 1.0–2.0 | 1.0–2.0 | 938 | $3,702 | $3.95 | 0d | 10 | 1.33mi |
| 1512 S Pine Ridge Cir Sanford, FL | 2.0 | 2.0 | 1025 | $1,550 | $1.51 | 25d | 1 | 1.33mi |
| 912 Pine Ave Sanford, FL | 2.0 | 1.0 | 1122 | $1,595 | $1.42 | 25d | 1 | 1.34mi |
| 2526 S Oak Ave Unit A Sanford, FL | 2.0 | 2.0 | 962 | $1,500 | $1.56 | 16d | 1 | 1.34mi |
| 401 W Seminole Blvd Sanford, FL | 1.0–2.0 | 1.0–2.0 | 818 | $1,824 | $2.23 | 3d | 12 | 1.35mi |
| 1223 S Pine Ridge Cir #23 Sanford, FL | 2.0 | 2.0 | 975 | $1,575 | $1.62 | 4d | 1 | 1.37mi |
| 1132 S Pine Ridge Cir Unit 108 Sanford, FL | 2.0 | 2.0 | 800 | $1,370 | $1.71 | 25d | 1 | 1.37mi |
| 1134 S Pine Ridge Cir Unit 1134 Sanford, FL | 2.0 | 2.0 | 800 | $1,450 | $1.81 | 25d | 1 | 1.38mi |
| 800 Marbella Ln Sanford, FL | 1.0–2.0 | 1.0–2.0 | 737 | $2,053 | $2.78 | 3d | 17 | 1.38mi |
| 1114 S Pine Ridge Cir #14 Sanford, FL | 2.0 | 2.0 | 800 | $1,300 | $1.62 | 16d | 1 | 1.39mi |
| 1114 S Pine Ridge Cir Unit D1 Sanford, FL | 2.0 | 2.0 | 800 | $1,300 | $1.62 | 23d | 1 | 1.39mi |
| 1122 S Pine Ridge Cir #1122 Sanford, FL | 2.0 | 2.0 | 800 | $1,300 | $1.62 | 25d | 1 | 1.39mi |
| 517 E 5th St Unit B Sanford, FL | 2.0 | 1.0 | 540 | $1,050 | $1.94 | 25d | 1 | 1.44mi |
Listing history 8 events
-
2026-06-21days on market $207,000 Active 13 DOM
-
2026-06-18days on market $207,000 Active 10 DOM
-
2026-06-17days on market $207,000 Active 9 DOM
-
2026-06-16days on market $207,000 Active 8 DOM
-
2026-06-15days on market $207,000 Active 7 DOM
-
2026-06-13days on market $207,000 Active 5 DOM
-
2026-06-08remarks 510-char remark
-
2026-06-08$207,000 Active 1 DOM
ⓘ Source: listings_history table (triggers on properties + properties_extension) + one-shot
backfill from property_details.listing_events for pre-trigger history.
Tax reassessment forecast FL · Resets to sale price
- Current annual tax
- $1,953 · $163/mo
- Projected year-2 tax
- $1,953 · $163/mo
- Expected delta
- $0/yr ($0/mo · 0.0%)
ⓘ Screening estimate from a state-policy table — verify with the county assessor before closing.
Climate risk First Street
- Flood 1/10 Low FEMA zone X (unshaded) · 0% chance over 30 yrs
- Wildfire 1/10 Low
- Heat 8/10 Severe 7 d/yr ≥107°F today · 21 d/yr by 30 yrs out
- Wind 9/10 Extreme 99% chance of damaging wind over 30 yrs
- Air quality 2/10 Low 1 unhealthy d/yr today · 1 by 30 yrs out
Nearby sold comps map
Loading sold comps map…
Walkable amenities ~0.75 mi
Loading nearby amenities…
Taxation est. · year 1
- Rental income
- $20,534
- − Mortgage interest
- −$11,595
- − Property taxes
- −$1,953
- − Insurance
- −$1,035
- − Repairs & maintenance
- −$1,643
- − Management
- −$1,643
- − Depreciation
- −$6,022
- Taxable loss
- −$3,356
- Est. tax savings @ 24.0%
- +$806
- After-tax cash flow
- $1,013/yr
For passive investors: Depreciation is non-cash, so a rental often shows a tax loss while cash-flowing — sheltering income. Rental losses are passive: they offset passive income freely, and up to $25,000/yr can offset ordinary (W-2) income if you actively participate and your MAGI is under $100k (phasing out to $0 by $150k); unused losses carry forward. On sale, claimed depreciation is recaptured at up to 25%, and gains may owe capital-gains tax (a 1031 exchange can defer both). Figures are a year-1 estimate at your 24.0% rate — not tax advice; consult a CPA.
Schools (NCES district)
- District
- Seminole
- NCES district ID
- 1201710
- Math proficiency
- 57% ▼ -7.00%
- Reading proficiency
- 61% ▼ -1.00%
- Median HH income
- $58,478
- Composite
- 51.05/100
- National rank
- #1769
- State rank
- #13 of 73 in FL
Livability — Sanford
- Score
- 73/100
- State rank
- #316
- US rank
- #5359
Category grades
Schools grade is shown separately in the Schools card above.
Census & demographics
- Census place
- Sanford, FL
- County
- Seminole County · 436,154 people
- City population
- 96,638
- Metro
- Orlando-Kissimmee-Sanford, FL
- Population (ZIP)
- 62,606
- Household income
- $77,868
- Rent vs Own
- Severe rent burden
- 2645.0
Population outlook (Seminole County) Hauer SSP2
- Today (2025)
- 515,494 people
- By 2030
- 545,713 · +5.9%
- By 2040
- 598,068 · +16.0%
- By 2050
- 640,663 · +24.3%
- By 2075
- 724,461 · +40.5%
- By 2100
- 755,530 · +46.6%
Race, ethnicity, and origin ACS 2023
- Neighborhood character
- Diverse neighborhood (Simpson 0.70)
- Race & ethnicity
- White 43% Black 24% Hispanic / Latino 23% Two or more races 13% Asian 7%
- Hispanic origin (detail)
- Mexican 2% Puerto Rican 7% Cuban 2% Dominican 2%
- Common ancestry
- Romanian 2% Slovak 1% Italian 1%
- Foreign-born
- 18% · Canada, Jamaica, China
- Languages at home
- 76% English-only · Spanish 15% Other Indo-European 3% Other Asian/Pacific 1%
Political lean MEDSL · Seminole
- 2024 margin
- Toss-up / Even · D 47.6% · R 51.1% · Other 1.3%
- 2008→2024 swing
- -0.8pp no change · 2008: -2.8pp · 2024: -3.5pp
- All cycles
- 2024: R+3.5 2020: D+2.8 2016: R+1.6 2012: R+6.5 2008: R+2.8
Not yet ingested
- Civics
- —
Market trends
- HPI YoY
- ▼ -281.27%
- Current HPI
- 299.2738
- Rent YoY
- ▲ 0.38%
- Metro
- Orlando-Kissimmee-Sanford, FL
- State GDP YoY
- ▲ 3.28%
- F500 in state
- 36
Industry mix (Fortune 500 HQ in FL)
| Industry | F500 HQs | Revenue |
|---|---|---|
| Industrial Technology | 2 | $29B |
|
||
| Insurance | 2 | $17B |
|
||
| Retail | 1 | $60B |
|
||
| Technology Distribution | 1 | $58B |
|
||
| Homebuilding | 1 | $35B |
|
||
| Technology Manufacturing | 1 | $35B |
|
||
Price history
+115.6% since first listed18 events — show timeline
- 2026-06-08 Listed $207,000 Stellar MLS as Distributed by MLS Grid
- 2025-07-25 Relisted — Stellar MLS as Distributed by MLS Grid
- 2025-04-23 Pending — Stellar MLS as Distributed by MLS Grid
- 2024-11-11 Relisted — Stellar MLS as Distributed by MLS Grid
- 2024-11-02 Pending — Stellar MLS as Distributed by MLS Grid
- 2024-10-21 Listed $210,000 Stellar MLS as Distributed by MLS Grid
- 2023-08-23 Rental Removed $1,395 STELLARMLS
- 2023-08-18 Listed for Rent $1,395 STELLARMLS
- 2020-09-25 Sold (Public Records) $129,000 Public Records
- 2020-09-22 Sold (MLS) $129,000 Stellar MLS as Distributed by MLS Grid
- 2020-09-18 Pending — Stellar MLS as Distributed by MLS Grid
- 2020-08-14 Relisted — Stellar MLS as Distributed by MLS Grid
- 2020-08-11 Pending — Stellar MLS as Distributed by MLS Grid
- 2020-07-29 Price Changed $133,947 Stellar MLS as Distributed by MLS Grid
- 2020-05-28 Price Changed $135,000 Stellar MLS as Distributed by MLS Grid
- 2019-12-26 Price Changed $149,900 Stellar MLS as Distributed by MLS Grid
- 2019-11-25 Listed $154,900 Stellar MLS as Distributed by MLS Grid
- 2019-09-24 Sold (Public Records) $96,000 Public Records
Property tax history
+11.4%/yrLatest (2025): $1,953 · +13.7% YoY. Source: county tax records.
Cash-flow waterfall
monthlySold comps — $/sqft
last 12 mo · ≤1 miLoading sold comps…