3817 Latimer St · Dallas, TX
Flood risk 1/10 · Minimal
- FEMA flood zone
- X (unshaded)
- Chance of flooding over 30 yrs
- 0.0%
- Est. flood insurance / yr
- $507 – $1,088
Fire risk 2/10 · Minimal
- Est. fire insurance / yr
- $1,222 – $2,270
Heat risk 8/10 · Major
- Hot days now (above 110°F)
- 7 days/yr
- Hot days in 30 yrs
- 25 days/yr
Wind risk 6/10 · Moderate
- Chance of severe wind over 30 yrs
- 27.0%
Air-quality risk 3/10 · Minor
- Unhealthy air days now
- 2 days/yr
- Unhealthy air days in 30 yrs
- 3 days/yr
Risk factors via First Street. Map © Google.
Why this score? — see what drove the A- grade
The composite is a weighted blend of 9 inputs, each scored 0–100. Each bar is that input's sub-score; the figure is the points it added to the 100-point composite (weight × sub-score).
- Cash flow +30.0/30.0
- ARV discount +15.0/15.0
- 1% rule +10.0/10.0
- DSCR +10.0/10.0
- Appreciation +5.4/10.0
- Rent growth +4.3/5.0
- Livability +4.0/5.0
- Schools +2.8/10.0
- Condition / age +2.5/5.0
$79,800
🖨 Deal sheet (PDF) 📄 Offer letter ✓ Due diligence
Listing remarks MLS
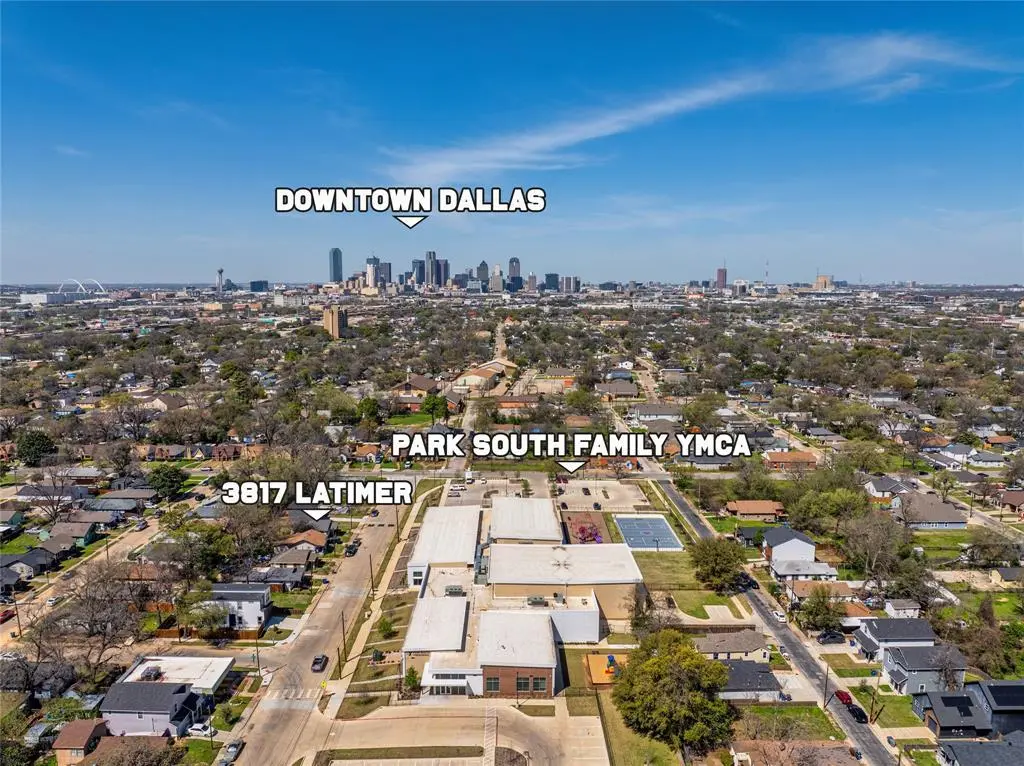
Nostalgic 2-bedroom, 1-bath home in a rapidly transforming area, directly across from the Park South Family YMCA recreation center. Surrounded by new construction, including a newly built home next door, this property offers outstanding potential for redevelopment. Existing home will not be shown the true value is in the land and the opportunity to build a new home or investment property. Come see this prime opportunity in a fast-changing neighborhood.
Key facts
- New construction
- Prime opportunity
- 3,528 sq ft lot
Tags
Neighborhood map
What this means for you Summary
Snapshot
- This is a 2-bed/1.0-bath single-family listed at $80k.
Deal economics
- At list price, monthly cash flow is $559 ($7k/yr) — positive.
- The deal already cash-flows at list — no discount required.
- Meets the 1% rule at list price ($1k rent vs $80k).
- Recommended offer: $75k (6.0% below list) — sets the bar for market timing.
- Cap rate 14.7% vs local median 2.3% in Dallas — top-decile yield for the area; either an underpriced asset or a hidden risk that comps aren't pricing in. Stress-test before assuming the spread holds.
Location & tenants
- Location reads 81/100 on livability (#24 in TX, #1,380 nationally) — a professional / high-income tenant draw. Strengths: amenities A+, commute A+, housing A+; Watch: schools C-, crime F.
- Dallas ISD (urban): math 31% / reading 36% proficiency, ranked #559 of 826 in TX (top 68%) — families likely to look elsewhere, expect single-tenant / working-renter base with shorter leases; 83% free/reduced lunch — lower-income household profile, screen leases tightly.
- Market conditions: Rents rising fast (+7.2%/yr); 247 active listings in the ZIP; 39 comparable units currently listed for rent nearby; rentals at typical pace (median 16d on market — plan ~3-4 weeks tenant-placement turnaround); 12,577 units permitted in Dallas County in 2024 (6,829 in 5+ unit buildings).
- This rent runs 39% of the median local income ($46k/yr) — at the standard rent-burdened threshold; future hikes will face affordability resistance.
Forward outlook
- In year one you build about $1k of equity ($552 loan paydown + $630 appreciation (0.8% local appreciation)).
- Dallas County population projected at +35% by 2050 — long-run rental-demand tailwind backs the buy-and-hold thesis.
- At projected returns (0.8% appreciation + 7.2% rent growth), your $22k cash investment doubles in ~3 years — after that, you're playing with house money.
Negotiation context
- It's been on market 75 days — a 6% lower offer ($75k) is reasonable based on typical stale-listing flexibility.
- 5 sale attempts; this cycle's ask has dropped $8k (9%) from the opening price — seller is motivated, your offer sets the floor, not the list.
Risks & watch-outs
- Watch-outs: property tax is 2.5% of price; built in 1926 — expect roof / HVAC / electrical / plumbing capex.
- Climate carrying-cost: major wind risk, 27% chance of damaging wind over 30y; extreme-heat days projected 7→25/yr by 2055 (HVAC capex compounding) — expect insurance premiums to compound above CPI over the hold.
Questions for the listing agent
- It's been on market 75 days. Have you received any prior offers? Is the seller open to a 6% concession, seller financing, or rate buy-down credit?
- Built in 1926 — when were the roof, HVAC, electrical panel, plumbing, and water heater last replaced?
- Property tax is high relative to price — has the assessment been appealed recently, and will the sale trigger a re-assessment?
- Why hasn't it sold? Are there any deal-killer items the seller is aware of (foundation, flood, title, zoning, code violations)?
- Is there a deadline driving the sale (1031 exchange, divorce, estate, relocation)? That informs how much negotiation room exists.
- Crime grade is F in this area — have there been break-ins, vandalism, or insurance claims at this property in the last 3 years? What carrier currently insures it and at what premium?
- What's the average days-on-market for RENTAL listings here right now (not sales)? A rising rental-DOM trend means longer vacancies and softer asking-rent achievability than the comps imply.
- What's the recent tenant-quality profile in this submarket — average credit score on applications, eviction rate, late-payment / NSF rate, and stable-employment percentage? A property-management company in the area should have these aggregated.
- How much new for-sale + rental construction is in the pipeline within 1–3 miles? Heavy new supply typically softens prices + rents 12–24 months out; constrained supply supports both.
Investment metrics
- 1% rule
- 1.87% ✓
- Cap rate
- 14.70%
- Cash-on-cash
- 30.03%
- DSCR
- 2.34
- GRM
- 4.5
CMA / ARV
- ARV (median comp)
- $143,191
- List price
- $79,800
- Delta
- -44.27%
- Verdict
- UNDERPRICED
- Comps
- 20 within 1.0 mi
Show comp detail 12 sales within ~0.75 mi
| Address | Dist | Beds/Ba | Sqft | Sold | Price | $/sf | Match |
|---|---|---|---|---|---|---|---|
| 2329 Poplar St | 0.21mi | 2/1.0 | 829 (+4%) | 16mo | $125,000 | $151 | 71 |
| 3512 S Harwood St | 0.38mi | 2/1.0 | 840 (+5%) | 4mo | $90,000 | $107 | 70 |
| 2429 Romine Ave | 0.06mi | 2/2.0 | 864 (+8%) | 12mo | $200,000 | $231 | 70 |
| 2915 Reed Ln | 0.54mi | 2/1.0 | 836 (+4%) | 5mo | $175,000 | $209 | 63 |
| 2911 Reed Ln | 0.53mi | 2/1.0 | 744 (-7%) | 11mo | $80,000 | $108 | 54 |
| 3030 Pine St | 0.62mi | 2/1.0 | 744 (-7%) | 8mo | $85,000 | $114 | 53 |
| 3115 Carpenter | 0.72mi | 2/1.0 | 842 (+5%) | 6mo | $169,000 | $201 | 52 |
| 2718 Pine St | 0.39mi | 2/1.0 | 702 (-12%) | 15mo | $95,000 | $135 | 49 |
| 3121 Metropolitan Ave | 0.71mi | 2/2.0 | 843 (+5%) | 12mo | $249,900 | $296 | 44 |
| 3119 Tuskegee St | 0.67mi | 2/1.0 | 720 (-10%) | 12mo | $85,000 | $118 | 42 |
| 3110 Roby St | 0.68mi | 2/2.0 | 728 (-9%) | 13mo | $115,000 | $158 | 38 |
| 2831 Marburg St | 0.62mi | 3/2.0 (+1) | 900 (+12%) | 11mo | $235,000 | $261 | 32 |
Match score weights: distance 35% · size 25% · config 20% · recency 20%. Top-matched comps best support the ARV.
Projected returns pro-forma
0.79% appreciation · 7.19% rent growth · sell at horizon
- IRR
- 36.0%
- Equity multiple
- 2.92×
- Total profit
- $42,916
- Equity at exit
- $26,370
- IRR
- 40.8%
- Equity multiple
- 6.68×
- Total profit
- $126,847
- Equity at exit
- $34,379
Cash invested: $22,344 (down + closing). Projections, not guarantees.
Landlord ↔ Tenant lean methodology
- Overall (STATE)
- 87 Strongly Landlord-Friendly
- State Texas
- 87 Strongly Landlord-Friendly · R+5
- County
- — inherits STATE
- City
- — inherits STATE
ZIP-level market 75215
- Home prices YoY
- 0.3%
- Rents YoY
- 7.2%
- Active inventory
- 247
- Price-to-rent
- 4.5×
Monthly cashflow live
- Estimated rent
- $1,494 high interval (Pro) →
- Mortgage (P&I)
- −$418
- Tax from tax record
- −$169 /mo · $2,031/yr
- Insurance
- −$33
- HOA
- −$0
- Vacancy / Maint / Mgmt
- −$314
- Net cashflow
- $559
Break-even live
Sensitivity live
| Price | -10% $604 | -5% $582 | +0% $559 | +5% $537 | +10% $514 |
|---|---|---|---|---|---|
| Rent | -10% $441 | -5% $500 | +0% $559 | +5% $618 | +10% $677 |
| Rate | -1.0pp $599 | -0.5pp $579 | base $559 | +0.5pp $539 | +1.0pp $517 |
UW: 25.0% down · 7.5% · 30yr · 1.5% tax · 5.0% vac · 8.0% maint · 8.0% mgmt
Financing live
Cash to close
- Down payment
- $19,950
- Closing costs
- $2,394
- Reserves months
- —
- Total cash needed
- —
Loan-product check · same deal, 3 products live
Conventional
25% down · 7.5% · 30yr
- Down + closing
- —
- Monthly P&I
- —
- Monthly cashflow
- —
- DSCR
- —
- Eligible?
- —
Personal DTI + credit; lowest rate.
DSCR
20% down · 8.5% · 30yr
- Down + closing
- —
- Monthly P&I
- —
- Monthly cashflow
- —
- DSCR
- —
- Eligible?
- —
No personal income docs; deal must DSCR.
Hard money
10% down · 12.0% · 12mo
- Down + closing
- —
- Monthly P&I
- —
- Monthly cashflow
- —
- DSCR
- —
- Eligible?
- —
Short-term bridge; refi at stabilization.
Rent comps 39 comps
| Address | Beds | Baths | Sqft | Rent | $/sqft | DOM | Units | Dist |
|---|---|---|---|---|---|---|---|---|
| 2545 Metropolitan Ave Dallas, TX | 3.0 | 1.0 | 936 | $1,750 | $1.87 | 0d | 1 | 0.21mi |
| 3711 Guaranty St Dallas, TX | 3.0 | 1.0 | 984 | $1,800 | $1.83 | 16d | 1 | 0.22mi |
| 4024 Myrtle St Dallas, TX | 3.0 | 2.0 | 1106 | $1,595 | $1.44 | 6d | 1 | 0.32mi |
| 3501 Latimer St Dallas, TX | 2.0 | 1.0 | 1008 | $1,095 | $1.09 | 4d | 1 | 0.33mi |
| 1723 Eugene St Unit 2 Dallas, TX | 1.0 | 1.0 | 756 | $1,250 | $1.65 | 44d | 1 | 0.35mi |
| 1724 Pear St Unit 1 Dallas, TX | 2.0 | 1.0 | 605 | $875 | $1.45 | 44d | 1 | 0.49mi |
| 1630 Poplar St Dallas, TX | 2.0 | 1.0 | 903 | $1,400 | $1.55 | 25d | 1 | 0.50mi |
| 1628 Poplar St Dallas, TX | 2.0 | 1.0 | 903 | $1,400 | $1.55 | 44d | 1 | 0.50mi |
| 2513 Southland St Dallas, TX | 2.0 | 1.0 | 1010 | $1,399 | $1.39 | 21d | 1 | 0.51mi |
| 2513 Southland St Dallas, TX | 2.0 | 1.0 | 1010 | $1,299 | $1.29 | 4d | 1 | 0.51mi |
| 2561 Elsie Faye Heggins St Dallas, TX | 3.0 | 2.0 | 876 | $1,390 | $1.59 | 7d | 1 | 0.57mi |
| 2563 Elsie Faye Heggins St Dallas, TX | 3.0 | 2.0 | 876 | $1,240 | $1.42 | 16d | 1 | 0.57mi |
| 2603 Elsie Faye Heggins St Dallas, TX | 3.0 | 2.0 | 876 | $1,385 | $1.58 | 44d | 1 | 0.57mi |
| 2627 Elsie Faye Heggins St Dallas, TX | 3.0 | 2.0 | 876 | $1,280 | $1.46 | 44d | 1 | 0.58mi |
| 2615 Elsie Faye Heggins St Dallas, TX | 3.0 | 2.0 | 876 | $1,280 | $1.46 | 16d | 1 | 0.58mi |
| 3907 Roberts Ave Dallas, TX | 3.0 | 1.0 | 908 | $1,395 | $1.54 | 16d | 1 | 0.67mi |
| 3408 Spring Ave Dallas, TX | 3.0 | 2.0 | 780 | $1,314 | $1.68 | 0d | 1 | 0.88mi |
| 4722 Meadow St Dallas, TX | 2.0–3.0 | 2.0 | 1107 | $1,275 | $1.15 | 12d | 4 | 0.93mi |
| 2829 Oakdale St Dallas, TX | 3.0 | 2.0 | 1028 | $1,814 | $1.76 | 0d | 1 | 0.95mi |
| 3529 Herrling St Dallas, TX | 2.0 | 1.0 | 632 | $1,200 | $1.90 | 12d | 1 | 0.98mi |
| 2642 Anderson St Dallas, TX | 2.0 | 1.0 | 820 | $1,150 | $1.40 | 25d | 1 | 1.05mi |
| 2711 Cross St Dallas, TX | 2.0 | 1.0 | 700 | $1,249 | $1.78 | 0d | 1 | 1.07mi |
| 3639 Pine St Dallas, TX | 3.0 | 2.0 | 1090 | $1,490 | $1.37 | 15d | 1 | 1.07mi |
| 3526 Elsie Faye Heggins St Dallas, TX | 3.0 | 2.0 | 1113 | $1,795 | $1.61 | 25d | 1 | 1.15mi |
| 3526 Elsie Faye Heggins St Dallas, TX | 3.0 | 2.0 | 1113 | $1,795 | $1.61 | 8d | 1 | 1.15mi |
| 3627 Sidney St Dallas, TX | 3.0 | 2.0 | 1090 | $1,600 | $1.47 | 0d | 1 | 1.23mi |
| 2216 Dyson St Dallas, TX | 3.0 | 2.0 | 1056 | $2,100 | $1.99 | 25d | 1 | 1.24mi |
| 2408 Meyers St Unit 204 Dallas, TX | 2.0 | 1.0 | 700 | $770 | $1.10 | 15d | 1 | 1.32mi |
| 4205 Metropolitan Ave Dallas, TX | 2.0 | 1.0 | 625 | $1,150 | $1.84 | 44d | 1 | 1.38mi |
| 2010 S Cesar Chavez Blvd Dallas, TX | 1.0 | 1.0 | 791 | $1,047 | $1.32 | 44d | 1 | 1.40mi |
| 2020 S Ervay St Dallas, TX | 2.0 | 1.0–2.0 | 821 | $2,325 | $2.83 | 0d | 56 | 1.41mi |
| 2016 S Ervay St Unit A1 Dallas, TX | 1.0 | 1.0 | 660 | $1,449 | $2.20 | 44d | 1 | 1.41mi |
| 2016 S Ervay St Unit A2 Dallas, TX | 1.0 | 1.0 | 760 | $1,600 | $2.11 | 44d | 1 | 1.41mi |
| 2016 S Ervay St Unit B1 Dallas, TX | 2.0 | 2.0 | 1102 | $2,225 | $2.02 | 44d | 1 | 1.41mi |
| 3910 Polly St Dallas, TX | 2.0 | 1.0 | 550 | $1,100 | $2.00 | 8d | 1 | 1.45mi |
| 4303 Jamaica St Dallas, TX | 3.0 | 2.0 | 1027 | $1,299 | $1.26 | 0d | 1 | 1.45mi |
| 2007 S Ervay St Dallas, TX | 1.0 | 1.0 | 1510 | $2,295 | $1.52 | 6d | 2 | 1.46mi |
| 2007 S Ervay St Dallas, TX | 1.0 | 1.0 | 1510 | $2,295 | $1.52 | 8d | 2 | 1.46mi |
| 1812 Hickory St Dallas, TX | 1.0–2.0 | 1.0–2.0 | 825 | $2,261 | $2.74 | 44d | 19 | 1.47mi |
Listing history 26 events
-
2026-06-21days on market $79,800 Active 75 DOM
-
2026-06-18days on market $79,800 Active 72 DOM
-
2026-06-17days on market $79,800 Active 71 DOM
-
2026-06-16days on market $79,800 Active 70 DOM
-
2026-06-15days on market $79,800 Active 69 DOM
-
2026-06-13days on market $79,800 Active 67 DOM
-
2026-06-09days on market $79,800 Active 63 DOM
-
2026-06-08days on market $79,800 Active 62 DOM
-
2026-06-07days on market $79,800 Active 61 DOM
-
2026-06-04days on market $79,800 Active 58 DOM
-
2026-06-03days on market $79,800 Active 57 DOM
-
2026-06-02days on market $79,800 Active 56 DOM
-
2026-06-01days on market $79,800 Active 55 DOM
-
2026-05-31days on market $79,800 Active 54 DOM
-
2026-05-05status Active 456-char remark
Show marketing remark (456 chars)
Nostalgic 2-bedroom, 1-bath home in a rapidly transforming area, directly across from the Park South Family YMCA recreation center. Surrounded by new construction, including a newly built home next door, this property offers outstanding potential for redevelopment. Existing home will not be shown the true value is in the land and the opportunity to build a new home or investment property. Come see this prime opportunity in a fast-changing neighborhood.
-
2026-04-27status Pending 456-char remark
Show marketing remark (456 chars)
Nostalgic 2-bedroom, 1-bath home in a rapidly transforming area, directly across from the Park South Family YMCA recreation center. Surrounded by new construction, including a newly built home next door, this property offers outstanding potential for redevelopment. Existing home will not be shown the true value is in the land and the opportunity to build a new home or investment property. Come see this prime opportunity in a fast-changing neighborhood.
-
2026-04-09status Active 456-char remark
Show marketing remark (456 chars)
Nostalgic 2-bedroom, 1-bath home in a rapidly transforming area, directly across from the Park South Family YMCA recreation center. Surrounded by new construction, including a newly built home next door, this property offers outstanding potential for redevelopment. Existing home will not be shown the true value is in the land and the opportunity to build a new home or investment property. Come see this prime opportunity in a fast-changing neighborhood.
-
2026-03-28status Pending 456-char remark
Show marketing remark (456 chars)
Nostalgic 2-bedroom, 1-bath home in a rapidly transforming area, directly across from the Park South Family YMCA recreation center. Surrounded by new construction, including a newly built home next door, this property offers outstanding potential for redevelopment. Existing home will not be shown the true value is in the land and the opportunity to build a new home or investment property. Come see this prime opportunity in a fast-changing neighborhood.
-
2026-03-11$88,000 Active 456-char remark
Show marketing remark (456 chars)
Nostalgic 2-bedroom, 1-bath home in a rapidly transforming area, directly across from the Park South Family YMCA recreation center. Surrounded by new construction, including a newly built home next door, this property offers outstanding potential for redevelopment. Existing home will not be shown the true value is in the land and the opportunity to build a new home or investment property. Come see this prime opportunity in a fast-changing neighborhood.
-
2025-10-15historical
-
2025-09-18price $75,000
-
2025-09-18status Active
-
2025-09-17price $90,000
-
2025-09-16status Pending
-
2025-09-11$129,999 Active
-
1983-11-30soldstatus
ⓘ Source: listings_history table (triggers on properties + properties_extension) + one-shot
backfill from property_details.listing_events for pre-trigger history.
Tax reassessment forecast TX · Resets to sale price
- Current annual tax
- $2,031 · $169/mo
- Projected year-2 tax
- $2,031 · $169/mo
- Expected delta
- $0/yr ($0/mo · 0.0%)
ⓘ Screening estimate from a state-policy table — verify with the county assessor before closing.
Climate risk First Street
- Flood 1/10 Low FEMA zone X (unshaded) · 0% chance over 30 yrs
- Wildfire 2/10 Low
- Heat 8/10 Severe 7 d/yr ≥110°F today · 25 d/yr by 30 yrs out
- Wind 6/10 Major 27% chance of damaging wind over 30 yrs
- Air quality 3/10 Moderate 2 unhealthy d/yr today · 3 by 30 yrs out
Nearby sold comps map
Loading sold comps map…
Walkable amenities ~0.75 mi
Loading nearby amenities…
Taxation est. · year 1
- Rental income
- $17,926
- − Mortgage interest
- −$4,470
- − Property taxes
- −$2,031
- − Insurance
- −$399
- − Repairs & maintenance
- −$1,434
- − Management
- −$1,434
- − Depreciation
- −$2,321
- Taxable income
- $5,837
- Est. tax owed @ 24.0%
- −$1,401
- After-tax cash flow
- $5,309/yr
For passive investors: Depreciation is non-cash, so a rental often shows a tax loss while cash-flowing — sheltering income. Rental losses are passive: they offset passive income freely, and up to $25,000/yr can offset ordinary (W-2) income if you actively participate and your MAGI is under $100k (phasing out to $0 by $150k); unused losses carry forward. On sale, claimed depreciation is recaptured at up to 25%, and gains may owe capital-gains tax (a 1031 exchange can defer both). Figures are a year-1 estimate at your 24.0% rate — not tax advice; consult a CPA.
Schools (NCES district)
- District
- Dallas ISD
- NCES district ID
- 4816230
- Math proficiency
- 31% ▼ -16.00%
- Reading proficiency
- 36% ▼ -4.00%
- Median HH income
- $42,881
- Composite
- 28.41/100
- National rank
- #6763
- State rank
- #559 of 826 in TX
Livability — Dallas
- Score
- 81/100
- State rank
- #24
- US rank
- #1380
Category grades
Schools grade is shown separately in the Schools card above.
Census & demographics
- Census place
- Dallas, TX
- County
- Dallas County · 2,612,404 people
- City population
- 1,168,437
- Metro
- Dallas-Fort Worth-Arlington, TX
- Population (ZIP)
- 18,895
- Household income
- $45,557
- Rent vs Own
- Severe rent burden
- 1464.0
Population outlook (Dallas County) Hauer SSP2
- Today (2025)
- 2,979,839 people
- By 2030
- 3,191,823 · +7.1%
- By 2040
- 3,619,611 · +21.5%
- By 2050
- 4,026,915 · +35.1%
- By 2075
- 4,957,073 · +66.4%
- By 2100
- 5,508,725 · +84.9%
Race, ethnicity, and origin ACS 2023
- Neighborhood character
- Diverse neighborhood (Simpson 0.58)
- Race & ethnicity
- Black 59% Hispanic / Latino 25% White 11% Two or more races 10%
- Hispanic origin (detail)
- Mexican 21%
- Common ancestry
- Italian 1% Hispanic 1%
- Foreign-born
- 16% · Canada
- Languages at home
- 74% English-only · Spanish 26%
Political lean MEDSL · Dallas
- 2024 margin
- Strong D (+22.2) · D 60.2% · R 38.0% · Other 1.8%
- 2008→2024 swing
- +6.9pp toward D · 2008: 15.3pp · 2024: 22.2pp
- All cycles
- 2024: D+22.2 2020: D+31.6 2016: D+26.2 2012: D+15.4 2008: D+15.3
Not yet ingested
- Civics
- —
Market trends
- HPI YoY
- ▲ 0.79%
- Current HPI
- 224.2955
- Rent YoY
- ▲ 7.19%
- Metro
- Dallas-Fort Worth-Arlington, TX
- State GDP YoY
- ▲ 3.95%
- F500 in state
- 110
Industry mix (Fortune 500 HQ in TX)
| Industry | F500 HQs | Revenue |
|---|---|---|
| Energy | 16 | $1,198B |
|
||
| Technology | 5 | $198B |
|
||
| Engineering / Construction | 4 | $72B |
|
||
| Energy Services | 3 | $60B |
|
||
| Utilities | 3 | $41B |
|
||
| Healthcare | 2 | $330B |
|
||
Price history
-32.3% since first listed12 events — show timeline
- 2026-05-05 Relisted — NTREIS
- 2026-04-27 Pending — NTREIS
- 2026-04-09 Relisted — NTREIS
- 2026-03-28 Pending — NTREIS
- 2026-03-11 Listed $88,000 NTREIS
- 2025-10-15 Listing Removed — NTREIS
- 2025-09-18 Price Changed $75,000 NTREIS
- 2025-09-18 Relisted — NTREIS
- 2025-09-17 Price Changed $90,000 NTREIS
- 2025-09-16 Pending — NTREIS
- 2025-09-11 Listed $129,999 NTREIS
- 1983-11-30 Sold (Public Records) — Public Records
Property tax history
+8.1%/yrLatest (2025): $2,031 · -22.2% YoY. Source: county tax records.
Cash-flow waterfall
monthlySold comps — $/sqft
last 12 mo · ≤1 miLoading sold comps…