107 N Fir St · Deer Park, WA
Flood risk 1/10 · Minimal
- FEMA flood zone
- X (unshaded)
- Chance of flooding over 30 yrs
- 0.0%
- Est. flood insurance / yr
- $473 – $860
Fire risk 7/10 · Major
- Est. fire insurance / yr
- $604 – $1,122
Heat risk 3/10 · Minor
- Hot days now (above 94°F)
- 7 days/yr
- Hot days in 30 yrs
- 15 days/yr
Wind risk 1/10 · Minimal
- Chance of severe wind over 30 yrs
- —
Air-quality risk 9/10 · Severe
- Unhealthy air days now
- 14 days/yr
- Unhealthy air days in 30 yrs
- 17 days/yr
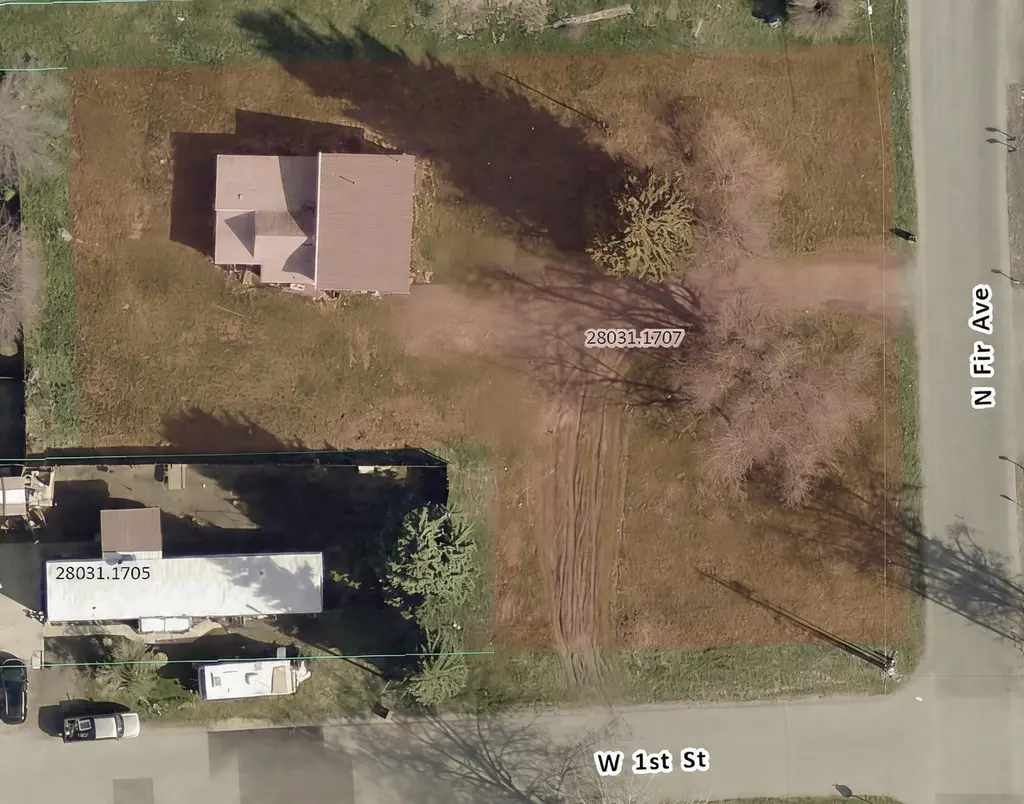
Risk factors via First Street. Map © Google.
Why this score? — see what drove the D grade
The composite is a weighted blend of 9 inputs, each scored 0–100. Each bar is that input's sub-score; the figure is the points it added to the 100-point composite (weight × sub-score).
- ARV discount +15.0/15.0
- Cash flow +9.0/30.0
- Schools +5.2/10.0
- Livability +2.9/5.0
- DSCR +2.5/10.0
- Rent growth +2.5/5.0
- Condition / age +2.5/5.0
- 1% rule +2.0/10.0
- Appreciation +0.0/10.0
$244,000
🖨 Deal sheet 📄 Offer letter ✓ Due diligence
Listing remarks MLS
Fixer-Upper on large . 55-Acre Lot in Deer Park! Discover endless potential with this 3-bedroom, 1-bath home on a large level . 55-acre lot, perfectly situated near Mix Park and downtown Deer Park. Zoned for Mixed Use - Residential or Commercial, this property is a rare gem, offering flexibility for development or creating your dream home with ample space for a massive shop or additional amenities. Usable land, ideal for residential or commercial investment or venture. All essential utilities are ready to go, simplifying your vision. Come check it out!
Key facts
- Steps from mix park
- Zoned for mixed use
- Large 55-acre lot
Tags
Neighborhood map
What this means for you Summary
Snapshot
- This is a 3-bed/1.0-bath single-family listed at $244k.
Deal economics
- At list price, monthly cash flow is $-194 ($-2k/yr) — negative.
- To cash-flow at today's rent, offer at most $210k (14.0% below list).
- To meet the 1% rule (rent ≥ 1% of price), the offer needs to be $170k (30.5% below list).
- Recommended offer: $170k (30.5% below list) — sets the bar for 1% rule.
- Cap rate 5.3% vs local median 2.5% in Deer Park — top-decile yield for the area; either an underpriced asset or a hidden risk that comps aren't pricing in. Stress-test before assuming the spread holds.
Location & tenants
- Location reads 57/100 on livability (#531 in WA) — a working-class tenant base; expect higher turnover. Strengths: housing A+, cost of living B+; Watch: amenities F, commute F, employment D-.
- Deer Park School District (rural): math 52% / reading 66% proficiency, ranked #74 of 291 in WA (top 25%) — acceptable for families but not a draw, mixed tenant base, ~2y average lease.
- Market conditions: 354 active listings in the ZIP; 3 comparable units currently listed for rent nearby; rentals leasing fast (median 14d on market — plan ~1-2 weeks tenant-placement turnaround); 3,608 units permitted in Spokane County in 2024 (1,792 in 5+ unit buildings).
Forward outlook
- Local home prices are declining (-3.0%/yr); year-one equity from $2k of loan paydown is wiped out by about $7k of value loss. Plan a longer hold.
- Spokane County population projected at +13% by 2050 — modest demand growth; plan on rents tracking national, not racing it.
Negotiation context
- It's been on market 64 days — a 6% lower offer ($229k) is reasonable based on typical stale-listing flexibility.
- 6 sale attempts since 19y ago with the ask held roughly flat each time — persistent listings suggest the price (not the market) is what's stuck; bring a comps-based counter.
- Current owner paid $50k; list at $244k implies a 388% gain — meaningful room to come down on a strong offer.
Risks & watch-outs
- Watch-outs: built in 1946 — expect roof / HVAC / electrical / plumbing capex.
- Climate carrying-cost: major wildfire risk — expect insurance premiums to compound above CPI over the hold.
Questions for the listing agent
- What do current leases actually rent for vs. the listed asking? Can we see a recent rent roll and the last 12 months of T-12 income?
- It's been on market 64 days. Have you received any prior offers? Is the seller open to a 30% concession, seller financing, or rate buy-down credit?
- Built in 1946 — when were the roof, HVAC, electrical panel, plumbing, and water heater last replaced?
- Why hasn't it sold? Are there any deal-killer items the seller is aware of (foundation, flood, title, zoning, code violations)?
- Is there a deadline driving the sale (1031 exchange, divorce, estate, relocation)? That informs how much negotiation room exists.
- The area grade is low — what's the realistic commute time and amenity access for the typical tenant pool here? Any planned neighborhood developments (good or bad) we should know about?
- What's the average days-on-market for RENTAL listings here right now (not sales)? A rising rental-DOM trend means longer vacancies and softer asking-rent achievability than the comps imply.
- What's the recent tenant-quality profile in this submarket — average credit score on applications, eviction rate, late-payment / NSF rate, and stable-employment percentage? A property-management company in the area should have these aggregated.
- How much new for-sale + rental construction is in the pipeline within 1–3 miles? Heavy new supply typically softens prices + rents 12–24 months out; constrained supply supports both.
Investment metrics
- 1% rule
- 0.70% ✗
- Cap rate
- 5.34%
- Cash-on-cash
- -3.40%
- DSCR
- 0.85
- GRM
- 12.0
CMA / ARV
- ARV (median comp)
- $316,326
- List price
- $244,000
- Delta
- -22.86%
- Verdict
- UNDERPRICED
- Comps
- 20 within 1.0 mi
Show comp detail 12 sales within ~0.75 mi
| Address | Dist | Beds/Ba | Sqft | Sold | Price | $/sf | Match |
|---|---|---|---|---|---|---|---|
| 609 N Columbia Ave | 0.36mi | 2/1.0 (-1) | 1,096 (-7%) | 1mo | $232,875 | $212 | 66 |
| 404 E Crawford Ave | 0.57mi | 3/1.0 | 1,200 (+2%) | 12mo | $290,000 | $242 | 60 |
| 4707 W Dahl Rd | 0.29mi | 3/1.0 | 1,292 (+10%) | 17mo | $405,000 | $313 | 56 |
| 214 N Arnim Ave | 0.42mi | 3/2.0 | 1,210 (+3%) | 21mo | $331,000 | $274 | 54 |
| 505 N Margaret Ave | 0.52mi | 3/1.0 | 1,216 (+3%) | 19mo | $292,000 | $240 | 54 |
| 710 N Arnim Ave | 0.59mi | 3/1.0 | 1,052 (-10%) | 7mo | $310,000 | $295 | 49 |
| 17 S Arnim St | 0.43mi | 2/1.0 (-1) | 1,040 (-12%) | 9mo | $255,000 | $245 | 48 |
| 608 S Margaret St | 0.64mi | 2/2.0 (-1) | 1,120 (-5%) | 11mo | $335,000 | $299 | 44 |
| 601 S Stevens Ln | 0.70mi | 3/2.0 | 1,265 (+8%) | 10mo | $393,500 | $311 | 43 |
| 701 S Stevens St | 0.74mi | 3/2.0 | 1,320 (+12%) | 2mo | $344,500 | $261 | 39 |
| 414 N Margaret Ave | 0.54mi | 3/1.0 | 1,003 (-15%) | 15mo | $335,000 | $334 | 38 |
| 405 E 6th St | 0.63mi | 2/1.0 (-1) | 1,021 (-13%) | 12mo | $320,000 | $313 | 34 |
Match score weights: distance 35% · size 25% · config 20% · recency 20%. Top-matched comps best support the ARV.
Projected returns pro-forma
-3.0% appreciation · 3.0% rent growth · sell at horizon
- IRR
- -22.0%
- Equity multiple
- 0.24×
- Total profit
- $-51,938
- Equity at exit
- $36,381
- IRR
- -16.1%
- Equity multiple
- 0.10×
- Total profit
- $-61,381
- Equity at exit
- $21,097
Cash invested: $68,320 (down + closing). Projections, not guarantees.
Landlord ↔ Tenant lean methodology
- Overall (STATE)
- 28 Tenant-Leaning
- State Washington
- 28 Tenant-Leaning · D+8
- County
- — inherits STATE
- City
- — inherits STATE
ZIP-level market 99006
- Home prices YoY
- -17.4%
- Active inventory
- 354
- Price-to-rent
- 12.0×
Monthly cashflow live
- Estimated rent
- $1,697 medium interval (Pro) →
- Mortgage (P&I)
- −$1,280
- Tax from tax record
- −$153 /mo · $1,832/yr
- Insurance
- −$102
- HOA
- −$0
- Vacancy / Maint / Mgmt
- −$356
- Net cashflow
- $-194
Break-even live
UW: 25.0% down · 7.5% · 30yr · 1.5% tax · 5.0% vac · 8.0% maint · 8.0% mgmt
Financing live
Cash to close
- Down payment
- $61,000
- Closing costs
- $7,320
- Reserves months
- —
- Total cash needed
- —
Loan-product check · same deal, 3 products live
Conventional
25% down · 7.5% · 30yr
- Down + closing
- —
- Monthly P&I
- —
- Monthly cashflow
- —
- DSCR
- —
- Eligible?
- —
Personal DTI + credit; lowest rate.
DSCR
20% down · 8.5% · 30yr
- Down + closing
- —
- Monthly P&I
- —
- Monthly cashflow
- —
- DSCR
- —
- Eligible?
- —
No personal income docs; deal must DSCR.
Hard money
10% down · 12.0% · 12mo
- Down + closing
- —
- Monthly P&I
- —
- Monthly cashflow
- —
- DSCR
- —
- Eligible?
- —
Short-term bridge; refi at stabilization.
Rent comps 3 comps
| Address | Beds | Baths | Sqft | Rent | $/sqft | DOM | Units | Dist |
|---|---|---|---|---|---|---|---|---|
| 420 E C St, Unit 422 Deer Park, WA | 2.0 | 1.0 | 720 | $1,200 | $1.67 | 13d | 1 | 0.31mi |
| 425 S Main St Deer Park, WA | 2.0 | 2.0 | 950 | $1,300 | $1.37 | 13d | 1 | 0.63mi |
| 107 E H St Unit 101-C Deer Park, WA | 3.0 | 2.0 | 1086 | $1,450 | $1.34 | 13d | 1 | 0.68mi |
Listing history 29 events
-
2026-06-18days on market $244,000 Active 64 DOM
-
2026-06-17days on market $244,000 Active 63 DOM
-
2026-06-16days on market $244,000 Active 62 DOM
-
2026-06-15days on market $244,000 Active 61 DOM
-
2026-06-14days on market $244,000 Active 59 DOM
-
2026-06-13days on market $244,000 Active 58 DOM
-
2026-06-10days on market $244,000 Active 56 DOM
-
2026-06-09days on market $244,000 Active 55 DOM
-
2026-06-08days on market $244,000 Active 54 DOM
-
2026-06-07days on market $244,000 Active 53 DOM
-
2026-06-03days on market $244,000 Active 49 DOM
-
2026-06-02days on market $244,000 Active 48 DOM
-
2026-06-01days on market $244,000 Active 47 DOM
-
2026-05-31days on market $244,000 Active 46 DOM
-
2026-05-31days on market $244,000 Active 45 DOM
-
2026-05-14price $244,000 558-char remark
Show marketing remark (558 chars)
Fixer-Upper on large . 55-Acre Lot in Deer Park! Discover endless potential with this 3-bedroom, 1-bath home on a large level . 55-acre lot, perfectly situated near Mix Park and downtown Deer Park. Zoned for Mixed Use - Residential or Commercial, this property is a rare gem, offering flexibility for development or creating your dream home with ample space for a massive shop or additional amenities. Usable land, ideal for residential or commercial investment or venture. All essential utilities are ready to go, simplifying your vision. Come check it out!
-
2026-04-15$249,000 Active 558-char remark
Show marketing remark (558 chars)
Fixer-Upper on large . 55-Acre Lot in Deer Park! Discover endless potential with this 3-bedroom, 1-bath home on a large level . 55-acre lot, perfectly situated near Mix Park and downtown Deer Park. Zoned for Mixed Use - Residential or Commercial, this property is a rare gem, offering flexibility for development or creating your dream home with ample space for a massive shop or additional amenities. Usable land, ideal for residential or commercial investment or venture. All essential utilities are ready to go, simplifying your vision. Come check it out!
-
2026-04-15$249,000 Active
Show marketing remark (558 chars)
Fixer-Upper on large . 55-Acre Lot in Deer Park! Discover endless potential with this 3-bedroom, 1-bath home on a large level . 55-acre lot, perfectly situated near Mix Park and downtown Deer Park. Zoned for Mixed Use - Residential or Commercial, this property is a rare gem, offering flexibility for development or creating your dream home with ample space for a massive shop or additional amenities. Usable land, ideal for residential or commercial investment or venture. All essential utilities are ready to go, simplifying your vision. Come check it out!
-
2026-04-01historical
-
2026-03-13price $249,000
-
2026-03-09status Active
-
2026-03-04status Pending
-
2026-01-02$250,000 Active
-
2025-12-30historical
-
2025-10-10$250,000 Active
-
2007-12-28historical
-
2007-07-25$139,000
-
2005-02-22soldstatus $50,000
-
1991-10-04soldstatus $35,000
ⓘ Source: listings_history table (triggers on properties + properties_extension) + one-shot
backfill from property_details.listing_events for pre-trigger history.
Tax reassessment forecast WA · Resets to sale price
- Current annual tax
- $1,832 · $153/mo
- Projected year-2 tax
- $2,391 · $199/mo
- Expected delta
- +$559/yr (+$47/mo · 30.5%)
ⓘ Screening estimate from a state-policy table — verify with the county assessor before closing.
Climate risk First Street
- Flood 1/10 Low FEMA zone X (unshaded) · 0% chance over 30 yrs
- Wildfire 7/10 Severe
- Heat 3/10 Moderate 7 d/yr ≥94°F today · 15 d/yr by 30 yrs out
- Wind 1/10 Low
- Air quality 9/10 Extreme 14 unhealthy d/yr today · 17 by 30 yrs out
Nearby sold comps map
Loading sold comps map…
Walkable amenities ~0.75 mi
Loading nearby amenities…
Taxation est. · year 1
- Rental income
- $20,359
- − Mortgage interest
- −$13,668
- − Property taxes
- −$1,832
- − Insurance
- −$1,220
- − Repairs & maintenance
- −$1,629
- − Management
- −$1,629
- − Depreciation
- −$7,098
- Taxable loss
- −$6,717
- Est. tax savings @ 24.0%
- +$1,612
- After-tax cash flow
- $-711/yr
For passive investors: Depreciation is non-cash, so a rental often shows a tax loss while cash-flowing — sheltering income. Rental losses are passive: they offset passive income freely, and up to $25,000/yr can offset ordinary (W-2) income if you actively participate and your MAGI is under $100k (phasing out to $0 by $150k); unused losses carry forward. On sale, claimed depreciation is recaptured at up to 25%, and gains may owe capital-gains tax (a 1031 exchange can defer both). Figures are a year-1 estimate at your 24.0% rate — not tax advice; consult a CPA.
Schools (NCES district)
- District
- Deer Park School District
- NCES district ID
- 5302070
- Math proficiency
- 52% ▼ -1.00%
- Reading proficiency
- 66% ▬ 0.00%
- Median HH income
- $47,808
- Composite
- 51.66/100
- National rank
- #3620
- State rank
- #74 of 291 in WA
Livability — Deer Park
- Score
- 57/100
- State rank
- #531
- US rank
- #22045
Category grades
Schools grade is shown separately in the Schools card above.
Census & demographics
- Census place
- Deer Park, WA
- County
- Spokane County · 496,401 people
- City population
- 16,177
- Metro
- Spokane-Spokane Valley, WA
- Population (ZIP)
- 16,177
- Household income
- $72,200
- Rent vs Own
- Severe rent burden
- 144.0
Population outlook (Spokane County) Hauer SSP2
- Today (2025)
- 531,314 people
- By 2030
- 549,278 · +3.4%
- By 2040
- 577,822 · +8.8%
- By 2050
- 598,188 · +12.6%
- By 2075
- 630,744 · +18.7%
- By 2100
- 622,360 · +17.1%
Race, ethnicity, and origin ACS 2023
- Neighborhood character
- Predominantly White (91%)
- Race & ethnicity
- White 91% Two or more races 6% Hispanic / Latino 4%
- Common ancestry
- Portuguese 6% Slovak 3% Serbian 3%
- Foreign-born
- 2% · Canada
- Languages at home
- 96% English-only · Spanish 2% Other Asian/Pacific 1%
Political lean MEDSL · Spokane
- 2024 margin
- Toss-up / Even · D 46.0% · R 51.0% · Other 3.0%
- 2008→2024 swing
- -3.8pp toward R · 2008: -1.1pp · 2024: -5.0pp
- All cycles
- 2024: R+5.0 2020: R+4.3 2016: R+8.3 2012: R+6.3 2008: R+1.1
Not yet ingested
- Civics
- —
Market trends
- HPI YoY
- ▼ -79.74%
- Current HPI
- 378.0416
- Rent YoY
- —
- Metro
- Spokane-Spokane Valley, WA
- State GDP YoY
- ▲ 4.65%
- F500 in state
- 22
Industry mix (Fortune 500 HQ in WA)
| Industry | F500 HQs | Revenue |
|---|---|---|
| Retail | 2 | $269B |
|
||
| Technology / Retail | 1 | $638B |
|
||
| Technology | 1 | $245B |
|
||
| Telecommunications | 1 | $38B |
|
||
| Food / Beverage | 1 | $36B |
|
||
| Automotive / Trucks | 1 | $34B |
|
||
Price history
+597.1% since first listed14 events — show timeline
- 2026-05-14 Price Changed $244,000 SPOKANEMLS as Distributed by MLS Grid
- 2026-04-15 Listed $249,000 SPOKANEMLS as Distributed by MLS Grid
- 2026-04-15 Listed $249,000 SPOKANEMLS as Distributed by MLS Grid
- 2026-04-01 Listing Removed — SPOKANEMLS as Distributed by MLS Grid
- 2026-03-13 Price Changed $249,000 SPOKANEMLS as Distributed by MLS Grid
- 2026-03-09 Relisted — SPOKANEMLS as Distributed by MLS Grid
- 2026-03-04 Pending — SPOKANEMLS as Distributed by MLS Grid
- 2026-01-02 Listed $250,000 SPOKANEMLS as Distributed by MLS Grid
- 2025-12-30 Listing Removed — SPOKANEMLS as Distributed by MLS Grid
- 2025-10-10 Listed $250,000 SPOKANEMLS as Distributed by MLS Grid
- 2007-12-28 Listing Removed — SPOKANEMLS as Distributed by MLS Grid
- 2007-07-25 Listed $139,000 SPOKANEMLS as Distributed by MLS Grid
- 2005-02-22 Sold (Public Records) $50,000 Public Records
- 1991-10-04 Sold (Public Records) $35,000 Public Records
Property tax history
+3.9%/yrLatest (2026): $1,832 · -8.6% YoY. Source: county tax records.
Cash-flow waterfall
monthlySold comps — $/sqft
last 12 mo · ≤1 miLoading sold comps…