14811 Sterling Oaks Dr · Bonita Springs, FL
Flood risk 5/10 · Moderate
- FEMA flood zone
- AH
- Chance of flooding over 30 yrs
- 0.23%
- Est. flood insurance / yr
- $1,142 – $2,507
Fire risk 3/10 · Minor
- Est. fire insurance / yr
- $947 – $1,759
Heat risk 10/10 · Severe
- Hot days now (above 107°F)
- 7 days/yr
- Hot days in 30 yrs
- 30 days/yr
Wind risk 10/10 · Severe
- Chance of severe wind over 30 yrs
- 99.0%
Air-quality risk 2/10 · Minimal
- Unhealthy air days now
- 1 days/yr
- Unhealthy air days in 30 yrs
- 1 days/yr
Risk factors via First Street. Map © Google.
Why this score? — see what drove the D grade
The composite is a weighted blend of 9 inputs, each scored 0–100. Each bar is that input's sub-score; the figure is the points it added to the 100-point composite (weight × sub-score).
- Cash flow +13.9/30.0
- ARV discount +7.5/15.0
- Schools +5.0/10.0
- 1% rule +4.4/10.0
- DSCR +4.2/10.0
- Livability +3.5/5.0
- Condition / age +2.5/5.0
- Rent growth +2.2/5.0
- Appreciation +0.0/10.0
$579,000
🖨 Deal sheet (PDF) 📄 Offer letter ✓ Due diligence
Listing remarks MLS
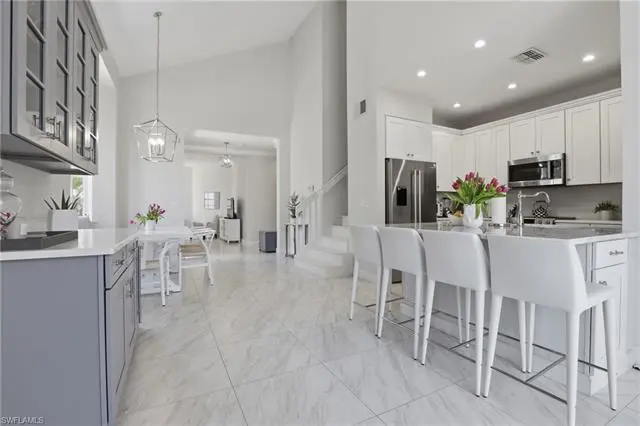
Attached villa.
Key facts
- Tropical pool
- Pickleball courts
- Bocce courts
Tags
Property features AI
Finance
- Other: Part of the Sterling Oaks development (Wildcat Cove subcommunity); Unit is one of two in the building and one unit per floor in the building (complex has many units)
- Financial info: Total annual recurring HOA fees reported; Total one-time fees reported
- HOA & community: Mandatory HOA with on-site management; Monthly HOA fee (reported); HOA covers cable, internet/WiFi, irrigation water, lawn/land maintenance, pest control (exterior), repairs, reserves, security, street lights and maintenance, manager, legal/accounting; Community amenities include clubhouse, community pool and spa/hot tub, exercise room, bocce court, pickleball, tennis, play area, restaurant, sauna, cabana, community room, sidewalks, streetlights, and underground utilities; Community type: gated
Exterior
- Parking: Attached 2-car garage
- Security: Gated community with guard at gate; Patrolled community; Entry card access
- Utilities: Central water; Central sewer; Cable available
- Home design: Attached villa; 2-story design; Zero lot line; Rear exposure faces northwest
- Construction: Concrete block construction; Stucco exterior; Shingle roof; Single-hung windows; Built in 2003
- Exterior features: Patio; Pond/lake frontage and lake view; Automatic sprinkler system
Interior
- Kitchen: Dishwasher; Disposal; Microwave; Range; Refrigerator/ice maker
- Bedrooms: 3 bedrooms plus den; Master bedroom on ground level; Split bedroom floor plan
- Flooring: Tile flooring
- Bathrooms: 3 full bathrooms; Master bath with dual sinks and shower (no tub)
- Heating & cooling: Central electric heating; Central electric cooling; Ceiling fans
- Interior features: Built-in cabinets; Cable prewire; High-speed internet available; Smoke detectors; Volume ceilings; Walk-in closet; Window coverings; Breakfast bar and formal dining; Den (study); Loft; Screened lanai/porch; Turnkey furnished
- Laundry & utility: Washer and dryer; Laundry in residence; Auto garage door
Neighborhood map
What this means for you Summary
Snapshot
- This is a 3-bed/3.0-bath single-family listed at $579k.
Deal economics
- At list price, monthly cash flow is $-92 ($-1k/yr) — negative.
- To cash-flow at today's rent, offer at most $563k (2.8% below list).
- To meet the 1% rule (rent ≥ 1% of price), the offer needs to be $547k (5.5% below list).
- Recommended offer: $544k (6.0% below list) — sets the bar for market timing.
- Cap rate 6.4% vs local median 1.7% in Bonita Springs — top-decile yield for the area; either an underpriced asset or a hidden risk that comps aren't pricing in. Stress-test before assuming the spread holds.
Location & tenants
- Location reads 70/100 on livability (#428 in FL) — a middle-class / working-renter tenant base. Strengths: crime A+, housing A+, employment A; Watch: cost of living C-, health & safety D, amenities F.
- Collier (suburban): math 60% / reading 56% proficiency, ranked #16 of 73 in FL (top 22%) — acceptable for families but not a draw, mixed tenant base, ~2y average lease.
- Zoned schools: Naples Park Elementary School (math 67% / reading 57%, grade B, #608 of 2,144 statewide, top 29%, 395 students, 48% FRL); North Naples Middle School (math 79% / reading 73%, grade A, #34 of 571 statewide, top 6%, 903 students, 25% FRL); Gulf Coast High School (math 57% / reading 68%, grade B-, #93 of 667 statewide, top 14%, 2,447 students, 20% FRL) — zoned schools average 31% FRL vs 55% district-wide (24 pts lower); this property's tenant base skews higher-income than the district average.
- Market conditions: Rents soft (-1.1%/yr); 593 active listings in the ZIP; 40 comparable units currently listed for rent nearby; rentals at typical pace (median 26d on market — plan ~3-4 weeks tenant-placement turnaround); solid renter incomes; 3,520 units permitted in Collier County in 2024 (959 in 5+ unit buildings).
- At $5,471/mo this rent would consume 67% of the median local household income ($98k/yr) (locally 1006% of renters already pay >50% of income on rent) — very limited rent-growth headroom before tenants either downsize or default.
Forward outlook
- Local home prices are declining (-3.0%/yr); year-one equity from $4k of loan paydown is wiped out by about $17k of value loss. Plan a longer hold.
- Collier County population projected at +30% by 2050 — long-run rental-demand tailwind backs the buy-and-hold thesis.
Negotiation context
- It's been on market 65 days — a 6% lower offer ($544k) is reasonable based on typical stale-listing flexibility.
- 2 sale attempts since 2y ago with the ask held roughly flat each time — persistent listings suggest the price (not the market) is what's stuck; bring a comps-based counter.
Risks & watch-outs
- Watch-outs: flood insurance adds $152/mo.
- Climate carrying-cost: in FEMA flood zone AH (mandatory federal flood insurance); severe wind risk, 99% chance of damaging wind over 30y; extreme-heat days projected 7→30/yr by 2055 (HVAC capex compounding) — expect insurance premiums to compound above CPI over the hold.
Questions for the listing agent
- What do current leases actually rent for vs. the listed asking? Can we see a recent rent roll and the last 12 months of T-12 income?
- It's been on market 65 days. Have you received any prior offers? Is the seller open to a 6% concession, seller financing, or rate buy-down credit?
- What's the actual annual flood-insurance premium (NFIP or private), and is the property in a SFHA with mandatory coverage?
- What does the HOA fee cover, when was the last increase, and are there any pending special assessments or reserve-fund shortfalls?
- Why hasn't it sold? Are there any deal-killer items the seller is aware of (foundation, flood, title, zoning, code violations)?
- Is there a deadline driving the sale (1031 exchange, divorce, estate, relocation)? That informs how much negotiation room exists.
- The area grade is low — what's the realistic commute time and amenity access for the typical tenant pool here? Any planned neighborhood developments (good or bad) we should know about?
- What's the average days-on-market for RENTAL listings here right now (not sales)? A rising rental-DOM trend means longer vacancies and softer asking-rent achievability than the comps imply.
- What's the recent tenant-quality profile in this submarket — average credit score on applications, eviction rate, late-payment / NSF rate, and stable-employment percentage? A property-management company in the area should have these aggregated.
- How much new for-sale + rental construction is in the pipeline within 1–3 miles? Heavy new supply typically softens prices + rents 12–24 months out; constrained supply supports both.
Investment metrics
- 1% rule
- 0.94% ✗
- Cap rate
- 6.42%
- Cash-on-cash
- 0.44%
- DSCR
- 1.02
- GRM
- 8.8
CMA / ARV
No comps found within radius.
Projected returns pro-forma
-3.0% appreciation · 0.0% rent growth · sell at horizon
- IRR
- -21.1%
- Equity multiple
- 0.29×
- Total profit
- $-115,378
- Equity at exit
- $86,331
- IRR
- -25.0%
- Equity multiple
- -0.04×
- Total profit
- $-168,612
- Equity at exit
- $50,061
Cash invested: $162,120 (down + closing). Projections, not guarantees.
Landlord ↔ Tenant lean methodology
- Overall (STATE)
- 87 Strongly Landlord-Friendly
- State Florida
- 87 Strongly Landlord-Friendly · R+3
- County
- — inherits STATE
- City
- — inherits STATE
ZIP-level market 34110
- Rents YoY
- -1.1%
- Active inventory
- 593
- Price-to-rent
- 8.8×
Monthly cashflow live
- Estimated rent
- $5,471 high interval (Pro) →
- Mortgage (P&I)
- −$3,036
- Tax from tax record
- −$345 /mo · $4,137/yr
- Insurance
- −$241
- Flood insurance flood zone
- −$152 /mo · $1,824/yr
- HOA
- −$640
- Vacancy / Maint / Mgmt
- −$1,149
- Net cashflow
- $-92
Break-even live
Sensitivity live
| Price | -10% $236 | -5% $72 | +0% $-92 | +5% $-256 | +10% $-420 |
|---|---|---|---|---|---|
| Rent | -10% $-524 | -5% $-308 | +0% $-92 | +5% $124 | +10% $340 |
| Rate | -1.0pp $200 | -0.5pp $55 | base $-92 | +0.5pp $-242 | +1.0pp $-395 |
UW: 25.0% down · 7.5% · 30yr · 1.5% tax · 5.0% vac · 8.0% maint · 8.0% mgmt
Financing live
Cash to close
- Down payment
- $144,750
- Closing costs
- $17,370
- Reserves months
- —
- Total cash needed
- —
Loan-product check · same deal, 3 products live
Conventional
25% down · 7.5% · 30yr
- Down + closing
- —
- Monthly P&I
- —
- Monthly cashflow
- —
- DSCR
- —
- Eligible?
- —
Personal DTI + credit; lowest rate.
DSCR
20% down · 8.5% · 30yr
- Down + closing
- —
- Monthly P&I
- —
- Monthly cashflow
- —
- DSCR
- —
- Eligible?
- —
No personal income docs; deal must DSCR.
Hard money
10% down · 12.0% · 12mo
- Down + closing
- —
- Monthly P&I
- —
- Monthly cashflow
- —
- DSCR
- —
- Eligible?
- —
Short-term bridge; refi at stabilization.
Rent comps 40 comps
| Address | Beds | Baths | Sqft | Rent | $/sqft | DOM | Units | Dist |
|---|---|---|---|---|---|---|---|---|
| 1214 Sweetwater Ln #2306 Naples, FL | 2.0 | 2.0 | 1378 | $6,500 | $4.72 | 25d | 1 | 0.05mi |
| 14907 Sterling Oaks Dr Naples, FL | 3.0 | 3.0 | 1760 | $6,500 | $3.69 | 25d | 1 | 0.16mi |
| 1117 Sweetwater Ln #2201 Naples, FL | 2.0 | 2.0 | 1193 | $6,500 | $5.45 | 25d | 1 | 0.18mi |
| 1325 Sweetwater Cv #201 Naples, FL | 3.0 | 2.0 | 1381 | $6,000 | $4.34 | 25d | 1 | 0.27mi |
| 1420 Sweetwater Cv #102 Naples, FL | 2.0 | 2.0 | 1279 | $5,000 | $3.91 | 25d | 1 | 0.27mi |
| 1420 Sweetwater Cv #102 Naples, FL | 2.0 | 2.0 | 1279 | $5,000 | $3.91 | 23d | 1 | 0.27mi |
| 1415 Sweetwater Cv #104 Naples, FL | 3.0 | 2.0 | 1381 | $6,500 | $4.71 | 25d | 1 | 0.31mi |
| 1405 Sweetwater Cv #204 Naples, FL | 3.0 | 2.0 | 1381 | $6,000 | $4.34 | 15d | 1 | 0.32mi |
| 1405 Sweetwater Cv #204 Naples, FL | 3.0 | 2.0 | 1381 | $6,000 | $4.34 | 25d | 1 | 0.32mi |
| 1340 Sweetwater Cv #103 Naples, FL | 2.0 | 2.0 | 1279 | $5,000 | $3.91 | 25d | 1 | 0.33mi |
| 1390 Sweetwater Cv #203 Naples, FL | 2.0 | 2.0 | 1279 | $2,200 | $1.72 | 15d | 1 | 0.33mi |
| 1345 Sweetwater Cv #203 Naples, FL | 2.0 | 2.0 | 1279 | $4,800 | $3.75 | 25d | 1 | 0.33mi |
| 1360 Sweetwater Cv #202 Naples, FL | 2.0 | 2.0 | 1279 | $5,500 | $4.30 | 25d | 1 | 0.34mi |
| 1250 Silverstrand Dr Naples, FL | 3.0 | 2.0 | 1848 | $5,000 | $2.71 | 25d | 1 | 0.35mi |
| 9855 Costa Mesa Ln #403 Bonita Springs, FL | 2.0 | 2.0 | 1146 | $1,600 | $1.40 | 25d | 1 | 0.38mi |
| 9851 Costa Mesa Ln Unit 1546344P Bonita Springs, FL | 2.0 | 2.0 | 1194 | $1,935 | $1.62 | 18d | 1 | 0.43mi |
| 28790 Versol Dr Bonita Springs, FL | 1.0–3.0 | 1.0–2.0 | 1075 | $3,391 | $3.15 | 3d | 19 | 0.47mi |
| 15985 Arbor View Blvd Naples, FL | 2.0–4.0 | 2.0 | 1208 | $2,062 | $1.71 | 15d | 14 | 0.47mi |
| 28700 Trails Edge Blvd Bonita Springs, FL | 3.0 | 2.0 | 1458 | $2,175 | $1.49 | 5d | 2 | 0.53mi |
| 28460 Highgate Dr Bonita Springs, FL | 2.0 | 2.0 | 1871 | $10,500 | $5.61 | 25d | 1 | 0.61mi |
| 28611 Carriage Home Dr #101 Bonita Springs, FL | 2.0 | 2.0 | 1433 | $2,550 | $1.78 | 25d | 1 | 0.70mi |
| 28650 Carriage Home Dr Unit 1049692P Bonita Springs, FL | 3.0 | 2.0 | 1528 | $3,980 | $2.60 | 18d | 1 | 0.72mi |
| 9908 White Sands Pl Bonita Springs, FL | 3.0 | 2.0 | 1827 | $7,500 | $4.11 | 25d | 1 | 0.74mi |
| 9111 Las Maderas Dr #102 Bonita Springs, FL | 2.0 | 2.0 | 1624 | $7,500 | $4.62 | 25d | 1 | 0.75mi |
| 9021 Las Maderas Dr #202 Bonita Springs, FL | 2.0 | 2.0 | 1674 | $7,500 | $4.48 | 25d | 1 | 0.76mi |
| 9030 Las Maderas Dr #101 Bonita Springs, FL | 2.0 | 2.0 | 1432 | $2,500 | $1.75 | 25d | 1 | 0.78mi |
| 9050 Las Maderas Dr #101 Bonita Springs, FL | 2.0 | 2.0 | 1364 | $2,100 | $1.54 | 25d | 1 | 0.81mi |
| 1130 Turtle Creek Blvd Naples, FL | 1.0–2.0 | 1.0–2.0 | 800 | $2,145 | $2.68 | 15d | 22 | 0.82mi |
| 28387 Las Palmas Cir Bonita Springs, FL | 2.0 | 2.0 | 1705 | $6,200 | $3.64 | 25d | 1 | 0.82mi |
| 28327 Hidden Lake Dr Bonita Springs, FL | 3.0 | 2.0 | 1567 | $8,950 | $5.71 | 25d | 1 | 0.85mi |
| 8981 Palmas Grandes Blvd #102 Bonita Springs, FL | 2.0 | 2.0 | 1791 | $7,500 | $4.19 | 25d | 1 | 0.85mi |
| 28052 Palmas Grandes Ln #101 Bonita Springs, FL | 2.0 | 2.0 | 1500 | $7,200 | $4.80 | 25d | 1 | 0.86mi |
| 28105 Mandolin Ct #213 Bonita Springs, FL | 3.0 | 2.0 | 1500 | $2,600 | $1.73 | 25d | 1 | 0.86mi |
| 8990 Palmas Grandes Blvd #201 Bonita Springs, FL | 2.0 | 2.0 | 1797 | $5,000 | $2.78 | 25d | 1 | 0.89mi |
| 28119 Tamberine Ct #1412 Bonita Springs, FL | 3.0 | 2.0 | 1593 | $5,800 | $3.64 | 25d | 1 | 0.89mi |
| 9050 Palmas Grandes Blvd #101 Bonita Springs, FL | 2.0 | 2.0 | 1200 | $2,000 | $1.67 | 25d | 1 | 0.91mi |
| 9651 Spanish Moss Way #4121 Bonita Springs, FL | 3.0 | 2.0 | 1857 | $4,800 | $2.58 | 25d | 1 | 0.99mi |
| 9631 Spanish Moss Way #3922 Bonita Springs, FL | 2.0 | 2.0 | 1504 | $6,000 | $3.99 | 5d | 1 | 1.05mi |
| 9621 Spanish Moss Way Bonita Springs, FL | 2.0 | 2.0 | 1504 | $5,125 | $3.41 | 25d | 2 | 1.08mi |
| 28251 Lisbon Ct #3412 Bonita Springs, FL | 2.0 | 2.0 | 1637 | $5,500 | $3.36 | 25d | 1 | 1.11mi |
HOA detail
- Monthly dues
- $640 · $7,680/yr
Listing history 27 events
-
2026-06-21days on market $579,000 Active 65 DOM
-
2026-06-18days on market $579,000 Active 62 DOM
-
2026-06-17days on market $579,000 Active 61 DOM
-
2026-06-16days on market $579,000 Active 60 DOM
-
2026-06-15days on market $579,000 Active 59 DOM
-
2026-06-14days on market $579,000 Active 57 DOM
-
2026-06-10days on market $579,000 Active 54 DOM
-
2026-06-09days on market $579,000 Active 53 DOM
-
2026-06-08days on market $579,000 Active 52 DOM
-
2026-06-07days on market $579,000 Active 51 DOM
-
2026-06-03days on market $579,000 Active 47 DOM
-
2026-06-02days on market $579,000 Active 46 DOM
-
2026-06-01days on market $579,000 Active 45 DOM
-
2026-05-31days on market $579,000 Active 44 DOM
-
2026-05-30days on market $579,000 Active 43 DOM
-
2026-04-17$579,000 Active
-
2024-04-01soldstatus $580,000
-
2024-03-29soldstatus $580,000 Sold 15-char remark
Show marketing remark (15 chars)
Attached villa.
-
2024-03-06status Pending 15-char remark
Show marketing remark (15 chars)
Attached villa.
-
2024-02-23status Pending With Contingencies 15-char remark
Show marketing remark (15 chars)
Attached villa.
-
2024-02-13$625,000 Active 15-char remark
Show marketing remark (15 chars)
Attached villa.
-
2016-05-16soldstatus $280,000
-
2016-05-12price $280,000
-
2016-05-12price $284,900
-
2005-10-12soldstatus $361,000
-
2001-05-07soldstatus $8,750,000
-
1996-10-07soldstatus $11,235,400
ⓘ Source: listings_history table (triggers on properties + properties_extension) + one-shot
backfill from property_details.listing_events for pre-trigger history.
Tax reassessment forecast FL · Resets to sale price
- Current annual tax
- $4,137 · $345/mo
- Projected year-2 tax
- $4,806 · $400/mo
- Expected delta
- +$669/yr (+$56/mo · 16.2%)
ⓘ Screening estimate from a state-policy table — verify with the county assessor before closing.
Climate risk First Street
- Flood 5/10 Major FEMA zone AH · 23% chance over 30 yrs
- Wildfire 3/10 Moderate
- Heat 10/10 Extreme 7 d/yr ≥107°F today · 30 d/yr by 30 yrs out
- Wind 10/10 Extreme 99% chance of damaging wind over 30 yrs
- Air quality 2/10 Low 1 unhealthy d/yr today · 1 by 30 yrs out
Nearby sold comps map
Loading sold comps map…
Walkable amenities ~0.75 mi
Loading nearby amenities…
Taxation est. · year 1
- Rental income
- $65,657
- − Mortgage interest
- −$32,433
- − Property taxes
- −$4,137
- − Insurance
- −$4,720
- − Repairs & maintenance
- −$5,253
- − Management
- −$5,253
- − HOA
- −$7,680
- − Depreciation
- −$16,844
- Taxable loss
- −$10,661
- Est. tax savings @ 24.0%
- +$2,559
- After-tax cash flow
- $1,455/yr
For passive investors: Depreciation is non-cash, so a rental often shows a tax loss while cash-flowing — sheltering income. Rental losses are passive: they offset passive income freely, and up to $25,000/yr can offset ordinary (W-2) income if you actively participate and your MAGI is under $100k (phasing out to $0 by $150k); unused losses carry forward. On sale, claimed depreciation is recaptured at up to 25%, and gains may owe capital-gains tax (a 1031 exchange can defer both). Figures are a year-1 estimate at your 24.0% rate — not tax advice; consult a CPA.
Schools (NCES district)
- District
- Collier
- NCES district ID
- 1200330
- Math proficiency
- 60% ▼ -4.00%
- Reading proficiency
- 56% ▼ -2.00%
- Median HH income
- $58,275
- Composite
- 50.23/100
- National rank
- #1892
- State rank
- #16 of 73 in FL
Livability — Bonita Springs
- Score
- 70/100
- State rank
- #428
- US rank
- #7576
Category grades
Schools grade is shown separately in the Schools card above.
Census & demographics
- County
- Collier County · 396,295 people
- City population
- 64,727
- Metro
- Naples-Marco Island, FL
- Population (ZIP)
- 25,630
- Household income
- $97,564
- Rent vs Own
- Severe rent burden
- 1006.0
Population outlook (Collier County) Hauer SSP2
- Today (2025)
- 420,858 people
- By 2030
- 450,054 · +6.9%
- By 2040
- 502,232 · +19.3%
- By 2050
- 544,932 · +29.5%
- By 2075
- 627,203 · +49.0%
- By 2100
- 659,015 · +56.6%
Race, ethnicity, and origin ACS 2023
- Neighborhood character
- Predominantly White (84%)
- Race & ethnicity
- White 84% Hispanic / Latino 10% Two or more races 9% Asian 2% Black 1%
- Hispanic origin (detail)
- Mexican 2% Puerto Rican 1% Cuban 3%
- Common ancestry
- Romanian 4% Lithuanian 3% Slovak 2%
- Foreign-born
- 11% · Canada, South Korea
- Languages at home
- 87% English-only · Spanish 7% Other Indo-European 3% French/Haitian/Cajun 1%
Political lean MEDSL · Collier
- 2024 margin
- Solid R (+33.1) · D 33.1% · R 66.2%
- 2008→2024 swing
- -10.6pp toward R · 2008: -22.5pp · 2024: -33.1pp
- All cycles
- 2024: R+33.1 2020: R+24.7 2016: R+26.0 2012: R+30.1 2008: R+22.5
Not yet ingested
- Civics
- —
Market trends
- HPI YoY
- ▼ -172.68%
- Current HPI
- 267.4644
- Rent YoY
- ▼ -1.06%
- Metro
- Naples-Marco Island, FL
- State GDP YoY
- ▲ 3.28%
- F500 in state
- 36
Industry mix (Fortune 500 HQ in FL)
| Industry | F500 HQs | Revenue |
|---|---|---|
| Industrial Technology | 2 | $29B |
|
||
| Insurance | 2 | $17B |
|
||
| Retail | 1 | $60B |
|
||
| Technology Distribution | 1 | $58B |
|
||
| Homebuilding | 1 | $35B |
|
||
| Technology Manufacturing | 1 | $35B |
|
||
Price history
-94.8% since first listed12 events — show timeline
- 2026-04-17 Listed $579,000 NAPLESMLS
- 2024-04-01 Sold (Public Records) $580,000 Public Records
- 2024-03-29 Sold (MLS) $580,000 NAPLESMLS
- 2024-03-06 Pending — NAPLESMLS
- 2024-02-23 Pending — NAPLESMLS
- 2024-02-13 Listed $625,000 NAPLESMLS
- 2016-05-16 Sold (Public Records) $280,000 Public Records
- 2016-05-12 Price Changed $280,000 BEARMLS
- 2016-05-12 Price Changed $284,900 BEARMLS
- 2005-10-12 Sold (Public Records) $361,000 Public Records
- 2001-05-07 Sold (Public Records) $8,750,000 Public Records
- 1996-10-07 Sold (Public Records) $11,235,400 Public Records
Property tax history
+5.3%/yrLatest (2025): $4,137 · +4.8% YoY. Source: county tax records.
Cash-flow waterfall
monthlySold comps — $/sqft
last 12 mo · ≤1 miLoading sold comps…