 Multi-family
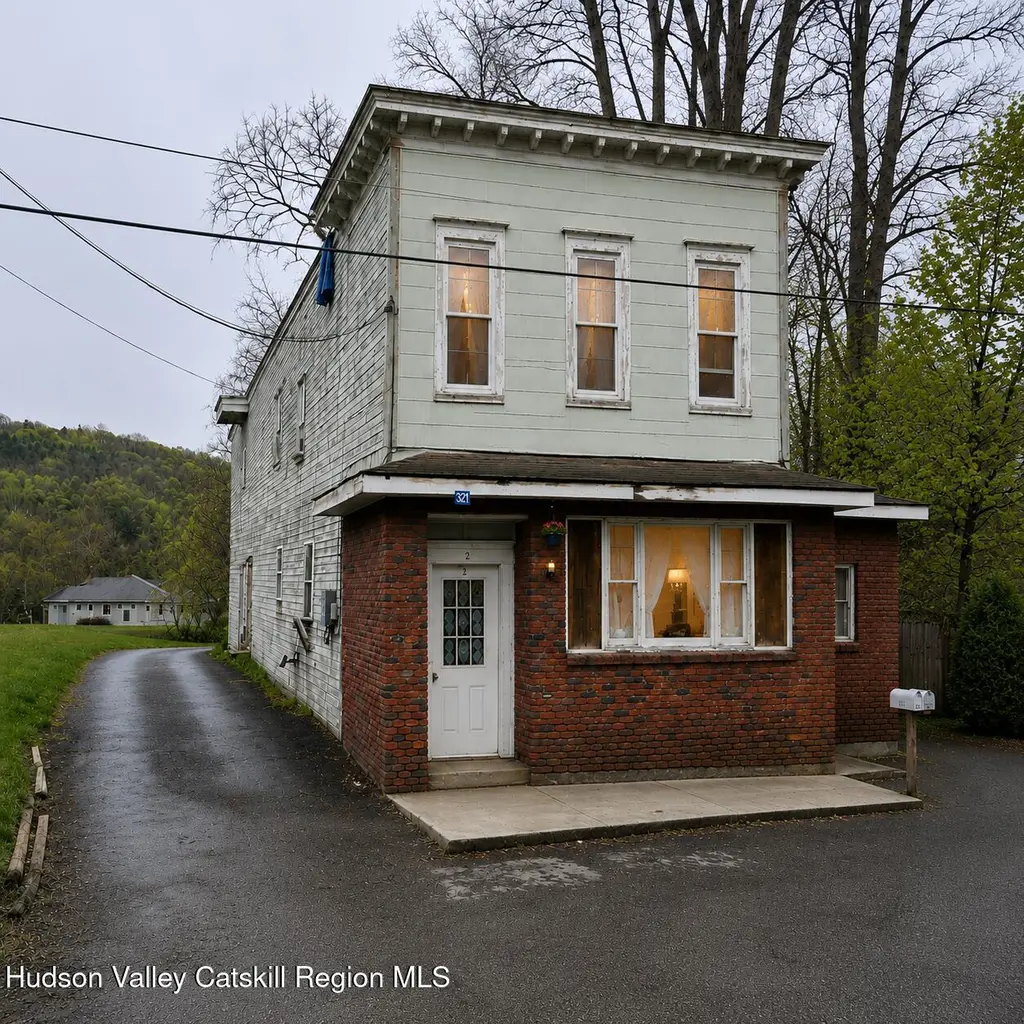
621 County Route 22 · Preston-Potter Hollow, NY
Flood risk No data
- FEMA flood zone
- —
- Chance of flooding over 30 yrs
- —
- Est. flood insurance / yr
- —
Fire risk No data
- Est. fire insurance / yr
- —
Heat risk No data
- Hot days now (above threshold)
- —
- Hot days in 30 yrs
- —
Wind risk No data
- Chance of severe wind over 30 yrs
- —
Air-quality risk No data
- Unhealthy air days now
- —
- Unhealthy air days in 30 yrs
- —
Risk factors via First Street. Map © Google.
Why this score? — see what drove the B+ grade
The composite is a weighted blend of 9 inputs, each scored 0–100. Each bar is that input's sub-score; the figure is the points it added to the 100-point composite (weight × sub-score).
- Cash flow +30.0/30.0
- DSCR +10.0/10.0
- 1% rule +9.6/10.0
- ARV discount +7.5/15.0
- Appreciation +7.4/10.0
- Schools +3.8/10.0
- Rent growth +2.5/5.0
- Livability +2.5/5.0
- Condition / age +2.2/5.0
$279,000
🖨 Deal sheet 📄 Offer letter ✓ Due diligence
Multi-family units
County records classify this as Multi-Family (5+ Unit). Listing-text estimate: 1 unit. estimate disagrees with records
5+ unit building — per-unit beds/baths from public records are typically unavailable; the breakdown below (if shown) is an estimate from the listing text.
Listing remarks
621 County Route 22, Durham, NY Multi-family property consisting of four residential units, including a mix of studio to two-bedroom layouts. With the possibility of a 5th Unit. The property has an established rental history and 3 out of the 4 units are currently occupied, providing immediate income potential. The building is situated on a spacious lot and requires repairs and updates, offering an opportunity to improve value and increase rental performance over time. Each unit features a distinct layout and room for improvement. Located in the center of Durham with access to local amenities and destinations. This property presents potential for investors seeking income-producing real es
Key facts
- Spacious lot
- 0.65 acre lot
- Built 1950
Tags
Property features AI
Finance
- Other: Call listing agent for additional equipment details
- Financial info: Residential income / multi-family property
- HOA & community: Sidewalks in the community
Exterior
- Parking: Driveway with shared driveway access
- Utilities: Private well water; Septic tank; Electricity available and connected; Cable available; Water connected; DC well pump (see listing agent)
- Home design: Multi-family residential income property; Two levels; Flat roof
- Construction: Multi-family construction; No foundation details listed
- Exterior features: Private yard; Partial fencing; Sloped lot with gentle slope and backyard; Paved road frontage on a county road; Views
Interior
- Flooring: Varies
- Heating & cooling: Heating available; includes pellet stove (varies by unit); Cooling available; includes wall units (varies by unit)
- Interior features: Natural woodwork; Open floorplan; One fireplace with pellet stove
- Laundry & utility: Laundry area (details vary by unit)
Neighborhood map
What this means for you Summary
Snapshot
- This is a 5-bed/4.0-bath multifamily listed at $279k. Condition is rated fair.
Deal economics
- At list price, monthly cash flow is $1k ($15k/yr) — positive.
- The deal already cash-flows at list — no discount required.
- Meets the 1% rule at list price ($4k rent vs $279k).
- Recommended offer: $275k (1.5% below list) — sets the bar for market timing.
- Cap rate 11.8% vs local median 2.1% in Preston-Potter Hollow — top-decile yield for the area; either an underpriced asset or a hidden risk that comps aren't pricing in. Stress-test before assuming the spread holds.
Location & tenants
- Location reads: area grade B — affects rentability + tenant quality, not the cash-flow math above.
- Cairo-Durham Central School District (rural): math 41% / reading 48% proficiency, ranked #470 of 590 in NY (top 80%) — families likely to look elsewhere, expect single-tenant / working-renter base with shorter leases.
- Market conditions: 9 active listings in the ZIP; 97 units permitted in Greene County in 2024 (0 in 5+ unit buildings).
Forward outlook
- In year one you build about $15k of equity ($2k loan paydown + $13k appreciation (4.8% local appreciation)).
- Greene County population projected at -22% by 2050 — secular population decline; favor cash flow + early exit over multi-decade hold.
- At projected returns (4.8% appreciation + 3.0% rent growth), your $78k cash investment doubles in ~3 years — after that, you're playing with house money.
- By year 3, paydown + projected appreciation supports a ~$38k cash-out refi (75% LTV) — recoverable capital for the next deal without selling this one.
Negotiation context
- It's been on market 19 days — a 2% lower offer ($275k) is reasonable based on typical stale-listing flexibility.
- 2 sale attempts since 2y ago with the ask held roughly flat each time — persistent listings suggest the price (not the market) is what's stuck; bring a comps-based counter.
Risks & watch-outs
- Watch-outs: built in 1950 — expect roof / HVAC / electrical / plumbing capex.
Questions for the listing agent
- Have any recent inspections been done? Can we get a copy of the seller's disclosures and any deferred-maintenance estimates?
- Built in 1950 — when were the roof, HVAC, electrical panel, plumbing, and water heater last replaced?
- Is there a deadline driving the sale (1031 exchange, divorce, estate, relocation)? That informs how much negotiation room exists.
- What's the average days-on-market for RENTAL listings here right now (not sales)? A rising rental-DOM trend means longer vacancies and softer asking-rent achievability than the comps imply.
- What's the recent tenant-quality profile in this submarket — average credit score on applications, eviction rate, late-payment / NSF rate, and stable-employment percentage? A property-management company in the area should have these aggregated.
- How much new apartment / multifamily construction is in the pipeline within 1–3 miles? Heavy new supply (>2% of stock underway) typically softens rents 12–24 months out; light construction supports rent growth.
Investment metrics
- 1% rule
- 1.46% ✓
- Cap rate
- 11.80%
- Cash-on-cash
- 19.65%
- DSCR
- 1.87
- GRM
- 5.7
CMA / ARV
No comps found within radius.
Projected returns pro-forma
4.76% appreciation · 3.0% rent growth · sell at horizon
- IRR
- 29.5%
- Equity multiple
- 2.82×
- Total profit
- $141,957
- Equity at exit
- $153,969
- IRR
- 28.4%
- Equity multiple
- 5.62×
- Total profit
- $360,755
- Equity at exit
- $262,371
Cash invested: $78,120 (down + closing). Projections, not guarantees.
Landlord ↔ Tenant lean methodology
- Overall (STATE)
- 15 Strongly Tenant-Friendly
- State New York
- 15 Strongly Tenant-Friendly · D+10
- County
- — inherits STATE
- City
- — inherits STATE
ZIP-level market 12422
- Home prices YoY
- 2.5%
- Active inventory
- 9
- Price-to-rent
- 25.2×
Monthly cashflow live
- Estimated rent
- $4,060 medium interval (Pro) →
- Mortgage (P&I)
- −$1,463
- Tax est. 1.5%
- −$349 /mo · $4,185/yr
- Insurance
- −$116
- HOA
- −$0
- Vacancy / Maint / Mgmt
- −$853
- Net cashflow
- $1,279
Break-even live
4-unit breakdown (identical units grouped — click to expand)
| Units | Beds | Baths | Est. rent |
|---|---|---|---|
| 1× unit | 1 | 1 | $922 |
| 3× units | 2 | 1 | $3,138 |
| #2 | 2 | 1 | $1,046 |
| #3 | 2 | 1 | $1,046 |
| #4 | 2 | 1 | $1,046 |
| Total (4 units) | $4,060 | ||
UW: 25.0% down · 7.5% · 30yr · 1.5% tax · 5.0% vac · 8.0% maint · 8.0% mgmt
Financing live
Cash to close
- Down payment
- $69,750
- Closing costs
- $8,370
- Reserves months
- —
- Total cash needed
- —
Loan-product check · same deal, 3 products live
Conventional
25% down · 7.5% · 30yr
- Down + closing
- —
- Monthly P&I
- —
- Monthly cashflow
- —
- DSCR
- —
- Eligible?
- —
Personal DTI + credit; lowest rate.
DSCR
20% down · 8.5% · 30yr
- Down + closing
- —
- Monthly P&I
- —
- Monthly cashflow
- —
- DSCR
- —
- Eligible?
- —
No personal income docs; deal must DSCR.
Hard money
10% down · 12.0% · 12mo
- Down + closing
- —
- Monthly P&I
- —
- Monthly cashflow
- —
- DSCR
- —
- Eligible?
- —
Short-term bridge; refi at stabilization.
Listing history 15 events
-
2026-06-18days on market $279,000 Active 19 DOM
-
2026-06-17days on market $279,000 Active 18 DOM
-
2026-06-16days on market $279,000 Active 17 DOM
-
2026-06-15days on market $279,000 Active 16 DOM
-
2026-06-14days on market $279,000 Active 14 DOM
-
2026-06-10days on market $279,000 Active 11 DOM
-
2026-06-09days on market $279,000 Active 10 DOM
-
2026-06-08days on market $279,000 Active 9 DOM
-
2026-06-07days on market $279,000 Active 8 DOM
-
2026-06-05days on market $279,000 Active 5 DOM
-
2026-06-03days on market $279,000 Active 4 DOM
-
2026-06-02days on market $279,000 Active 3 DOM
-
2026-06-01days on market $279,000 Active 2 DOM
-
2026-05-31remarks 699-char remark
-
2026-05-31$279,000 Active 1 DOM
ⓘ Source: listings_history table (triggers on properties + properties_extension) + one-shot
backfill from property_details.listing_events for pre-trigger history.
Nearby sold comps map
Loading sold comps map…
Walkable amenities ~0.75 mi
Loading nearby amenities…
Taxation est. · year 1
- Rental income
- $48,720
- − Mortgage interest
- −$15,628
- − Property taxes
- −$4,185
- − Insurance
- −$1,395
- − Repairs & maintenance
- −$3,898
- − Management
- −$3,898
- − Depreciation
- −$8,116
- Taxable income
- $11,600
- Est. tax owed @ 24.0%
- −$2,784
- After-tax cash flow
- $12,568/yr
For passive investors: Depreciation is non-cash, so a rental often shows a tax loss while cash-flowing — sheltering income. Rental losses are passive: they offset passive income freely, and up to $25,000/yr can offset ordinary (W-2) income if you actively participate and your MAGI is under $100k (phasing out to $0 by $150k); unused losses carry forward. On sale, claimed depreciation is recaptured at up to 25%, and gains may owe capital-gains tax (a 1031 exchange can defer both). Figures are a year-1 estimate at your 24.0% rate — not tax advice; consult a CPA.
Condition & rehab AI · 5 photos
This multi-family property requires moderate repairs and updates to its exterior and landscaping, which could significantly increase its resale and rental value.
Repairs flagged
- Moderate siding — Weathered and discolored
- Moderate exterior paint — Needs touch-up
Value-add opportunities
- Both Painting and repainting the exterior — Enhances curb appeal and value
- Both Landscaping and trimming — Improves curb appeal and rental value
- Both Interior updates — Enhances living space and rental potential
Renovation cost estimate screening
| Repair item | Severity | Est. cost |
|---|---|---|
| siding · Weathered and discolored | Moderate | $3,000–15,000 |
| exterior paint · Needs touch-up | Moderate | $3,000–15,000 |
| Total estimated repair cost · 2 items | $6,000–30,000 |
Value-add ROI direction
- Both Painting and repainting the exterior — Enhances curb appeal and value ↑
- Both Landscaping and trimming — Improves curb appeal and rental value ↑
- Both Interior updates — Enhances living space and rental potential ↑
ⓘ Cost ranges are severity-bucket heuristics (US national rule-of-thumb). Get contractor quotes + a written scope before underwriting a rehab budget.
Schools (NCES district)
- District
- Cairo-Durham Central School District
- NCES district ID
- 3606160
- Math proficiency
- 41% ▼ -3.00%
- Reading proficiency
- 48% ▲ 8.00%
- Median HH income
- $46,192
- Composite
- 37.84/100
- National rank
- #4330
- State rank
- #470 of 590 in NY
Livability — Preston-Potter Hollow
No livability data for this city. (Only ~50 U.S. cities are tracked.)
Census & demographics
- City population
- 842
- Population (ZIP)
- 469
Population outlook (Greene County) Hauer SSP2
- Today (2025)
- 44,963 people
- By 2030
- 43,126 · -4.1%
- By 2040
- 38,756 · -13.8%
- By 2050
- 34,913 · -22.4%
- By 2075
- 28,156 · -37.4%
- By 2100
- 22,296 · -50.4%
Race, ethnicity, and origin ACS 2023
- Neighborhood character
- Predominantly White (96%)
- Race & ethnicity
- White 96% Asian 4%
- Common ancestry
- Slovak 8% Iranian 4%
- Foreign-born
- 9% · Canada
Political lean MEDSL · Greene
- 2024 margin
- R (+17.0) · D 41.5% · R 58.5%
- 2008→2024 swing
- -7.1pp toward R · 2008: -9.9pp · 2024: -17.0pp
- All cycles
- 2024: R+17.0 2020: R+15.6 2016: R+27.4 2012: R+11.1 2008: R+9.9
Not yet ingested
- Civics
- —
Market trends
- HPI YoY
- ▲ 4.76%
- Current HPI
- 197.4051
- Rent YoY
- —
- Metro
- —
- State GDP YoY
- ▲ 2.60%
- F500 in state
- 92
Industry mix (Fortune 500 HQ in NY)
| Industry | F500 HQs | Revenue |
|---|---|---|
| Financial Services | 10 | $950B |
|
||
| Consumer Goods | 9 | $162B |
|
||
| Insurance | 4 | $225B |
|
||
| Telecommunications | 2 | $144B |
|
||
| Pharmaceuticals | 2 | $112B |
|
||
| Media / Entertainment | 2 | $69B |
|
||
Price history
-7.0% since first listed2 events — show timeline
- 2026-05-28 Listed $279,000 HVCRMLS
- 2024-07-09 Listed $299,999 HVCRMLS
Cash-flow waterfall
monthlySold comps — $/sqft
last 12 mo · ≤1 miLoading sold comps…