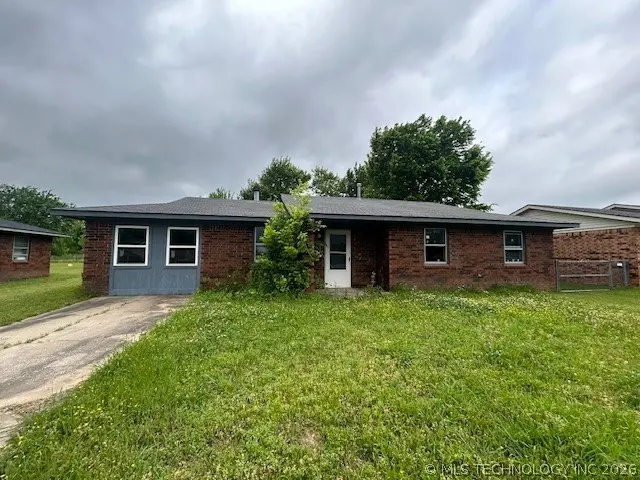
404 N Quapaw Rd · Porum, OK
Flood risk No data
- FEMA flood zone
- —
- Chance of flooding over 30 yrs
- —
- Est. flood insurance / yr
- —
Fire risk No data
- Est. fire insurance / yr
- —
Heat risk No data
- Hot days now (above threshold)
- —
- Hot days in 30 yrs
- —
Wind risk No data
- Chance of severe wind over 30 yrs
- —
Air-quality risk No data
- Unhealthy air days now
- —
- Unhealthy air days in 30 yrs
- —
Risk factors via First Street. Map © Google.
Why this score? — see what drove the C- grade
The composite is a weighted blend of 9 inputs, each scored 0–100. Each bar is that input's sub-score; the figure is the points it added to the 100-point composite (weight × sub-score).
- Cash flow +16.6/30.0
- Appreciation +8.3/10.0
- ARV discount +7.5/15.0
- DSCR +5.2/10.0
- 1% rule +3.5/10.0
- Livability +3.1/5.0
- Rent growth +2.5/5.0
- Condition / age +2.5/5.0
- Schools +1.7/10.0
$127,900
🖨 Deal sheet 📄 Offer letter ✓ Due diligence
Listing remarks
Brick 3 bed, 1.5 bath home located on a quiet cul-de-sac road. A great opportunity with a comfortable layout and peaceful setting. Spacious living area featuring updated flooring and neutral tones throughout. The enclosed garage conversion opens up the layout, creating an oversized living space with plenty of room for multiple seating areas, entertaining, or a flexible second living/dining setup. Wide opening leads into an additional living space, adding to the home’s open feel. Spacious living area featuring updated flooring and neutral tones throughout. Functional galley style kitchen with ample cabinet storage and extended counter space. Natural light from the window brightens the
Key facts
- Natural light
- Cul-de-sac road
- 9,100 sq ft lot
Tags
Property features AI
Exterior
- Security: Smoke detector(s); No safety shelter
- Utilities: Electricity available; Natural gas available; Public water; Public sewer
- Home design: Single-story; Faces east; Slab foundation
- Construction: Brick veneer; Wood siding; Wood frame construction; Asphalt/fiberglass roof
- Exterior features: Covered porch; Porch; Cul-de-sac lot
Interior
- Kitchen: Oven; Range; Stove
- Flooring: Carpet; Vinyl
- Bathrooms: 1 full bathroom; 1 half bathroom
- Heating & cooling: Central heating (electric); Central air conditioning
- Interior features: Laminate counters; Ceiling fan(s); Aluminum window frames; Gas range connection
- Laundry & utility: Washer hookup; Electric dryer hookup; Gas water heater
Neighborhood map
What this means for you Summary
Snapshot
- This is a 3-bed/1.0-bath single-family listed at $128k.
Deal economics
- At list price, monthly cash flow is $77 ($928/yr) — positive.
- The deal already cash-flows at list — no discount required.
- To meet the 1% rule (rent ≥ 1% of price), the offer needs to be $109k (14.7% below list).
- Recommended offer: $109k (14.7% below list) — sets the bar for 1% rule.
Location & tenants
- Location reads 62/100 on livability (#240 in OK) — a middle-class / working-renter tenant base. Strengths: cost of living A+, housing A+, health & safety A+; Watch: schools F, crime F, amenities F.
- Porum (rural): math 19% / reading 24% proficiency, ranked #172 of 270 in OK (top 64%) — low school quality limits family demand, transient renter base, plan for 1-2y turnover; 70% free/reduced lunch — lower-income household profile, screen leases tightly.
- Market conditions: 129 active listings in the ZIP; 58 units permitted in Muskogee County in 2024 (0 in 5+ unit buildings).
Forward outlook
- In year one you build about $9k of equity ($884 loan paydown + $8k appreciation (6.6% local appreciation)).
- Muskogee County population projected at -15% by 2050 — secular population decline; favor cash flow + early exit over multi-decade hold.
- At projected returns (6.6% appreciation + 3.0% rent growth), your $36k cash investment doubles in ~4 years — after that, you're playing with house money.
- By year 4, paydown + projected appreciation supports a ~$32k cash-out refi (75% LTV) — recoverable capital for the next deal without selling this one.
Negotiation context
- It's been on market 55 days — a 3% lower offer ($124k) is reasonable based on typical stale-listing flexibility.
- 2 sale attempts since 6y ago with the ask held roughly flat each time — persistent listings suggest the price (not the market) is what's stuck; bring a comps-based counter.
- Current owner paid $69k; list at $128k implies a 85% gain — meaningful room to come down on a strong offer.
Questions for the listing agent
- It's been on market 55 days. Have you received any prior offers? Is the seller open to a 15% concession, seller financing, or rate buy-down credit?
- Is there a deadline driving the sale (1031 exchange, divorce, estate, relocation)? That informs how much negotiation room exists.
- Schools are F-rated, which usually means shorter tenancies and higher turnover. Who's the typical renter profile here, and what's been the actual vacancy rate?
- Crime grade is F in this area — have there been break-ins, vandalism, or insurance claims at this property in the last 3 years? What carrier currently insures it and at what premium?
- What's the average days-on-market for RENTAL listings here right now (not sales)? A rising rental-DOM trend means longer vacancies and softer asking-rent achievability than the comps imply.
- What's the recent tenant-quality profile in this submarket — average credit score on applications, eviction rate, late-payment / NSF rate, and stable-employment percentage? A property-management company in the area should have these aggregated.
- How much new for-sale + rental construction is in the pipeline within 1–3 miles? Heavy new supply typically softens prices + rents 12–24 months out; constrained supply supports both.
Investment metrics
- 1% rule
- 0.85% ✗
- Cap rate
- 7.02%
- Cash-on-cash
- 2.59%
- DSCR
- 1.12
- GRM
- 9.8
CMA / ARV
No comps found within radius.
Projected returns pro-forma
6.57% appreciation · 3.0% rent growth · sell at horizon
- IRR
- 18.8%
- Equity multiple
- 2.29×
- Total profit
- $46,170
- Equity at exit
- $85,042
- IRR
- 18.0%
- Equity multiple
- 4.65×
- Total profit
- $130,858
- Equity at exit
- $158,390
Cash invested: $35,812 (down + closing). Projections, not guarantees.
Landlord ↔ Tenant lean methodology
- Overall (STATE)
- 83 Strongly Landlord-Friendly
- State Oklahoma
- 83 Strongly Landlord-Friendly · R+20
- County
- — inherits STATE
- City
- — inherits STATE
ZIP-level market 74455
- Home prices YoY
- 2.3%
- Active inventory
- 129
- Price-to-rent
- 9.8×
Monthly cashflow live
- Estimated rent
- $1,091 medium interval (Pro) →
- Mortgage (P&I)
- −$671
- Tax from tax record
- −$60 /mo · $724/yr
- Insurance
- −$53
- HOA
- −$0
- Vacancy / Maint / Mgmt
- −$229
- Net cashflow
- $77
Break-even live
UW: 25.0% down · 7.5% · 30yr · 1.5% tax · 5.0% vac · 8.0% maint · 8.0% mgmt
Financing live
Cash to close
- Down payment
- $31,975
- Closing costs
- $3,837
- Reserves months
- —
- Total cash needed
- —
Loan-product check · same deal, 3 products live
Conventional
25% down · 7.5% · 30yr
- Down + closing
- —
- Monthly P&I
- —
- Monthly cashflow
- —
- DSCR
- —
- Eligible?
- —
Personal DTI + credit; lowest rate.
DSCR
20% down · 8.5% · 30yr
- Down + closing
- —
- Monthly P&I
- —
- Monthly cashflow
- —
- DSCR
- —
- Eligible?
- —
No personal income docs; deal must DSCR.
Hard money
10% down · 12.0% · 12mo
- Down + closing
- —
- Monthly P&I
- —
- Monthly cashflow
- —
- DSCR
- —
- Eligible?
- —
Short-term bridge; refi at stabilization.
Listing history 18 events
-
2026-06-18days on market $127,900 Active 55 DOM
-
2026-06-17days on market $127,900 Active 54 DOM
-
2026-06-16days on market $127,900 Active 53 DOM
-
2026-06-15days on market $127,900 Active 52 DOM
-
2026-06-13days on market $127,900 Active 50 DOM
-
2026-06-12days on market $127,900 Active 49 DOM
-
2026-06-09days on market $127,900 Active 46 DOM
-
2026-06-08days on market $127,900 Active 45 DOM
-
2026-06-08days on market $127,900 Active 44 DOM
-
2026-06-07days on market $127,900 Active 43 DOM
-
2026-06-04days on market $127,900 Active 40 DOM
-
2026-06-02days on market $127,900 Active 39 DOM
-
2026-06-01days on market $127,900 Active 38 DOM
-
2026-05-31days on market $127,900 Active 37 DOM
-
2026-04-23$127,900 Active
-
2021-03-19soldstatus $69,000
-
2021-03-12historical
-
2020-09-14$68,500 Active
ⓘ Source: listings_history table (triggers on properties + properties_extension) + one-shot
backfill from property_details.listing_events for pre-trigger history.
Tax reassessment forecast OK · Resets to sale price
- Current annual tax
- $724 · $60/mo
- Projected year-2 tax
- $1,151 · $96/mo
- Expected delta
- +$427/yr (+$36/mo · 59.0%)
ⓘ Screening estimate from a state-policy table — verify with the county assessor before closing.
Nearby sold comps map
Loading sold comps map…
Walkable amenities ~0.75 mi
Loading nearby amenities…
Taxation est. · year 1
- Rental income
- $13,089
- − Mortgage interest
- −$7,164
- − Property taxes
- −$724
- − Insurance
- −$640
- − Repairs & maintenance
- −$1,047
- − Management
- −$1,047
- − Depreciation
- −$3,721
- Taxable loss
- −$1,254
- Est. tax savings @ 24.0%
- +$301
- After-tax cash flow
- $1,229/yr
For passive investors: Depreciation is non-cash, so a rental often shows a tax loss while cash-flowing — sheltering income. Rental losses are passive: they offset passive income freely, and up to $25,000/yr can offset ordinary (W-2) income if you actively participate and your MAGI is under $100k (phasing out to $0 by $150k); unused losses carry forward. On sale, claimed depreciation is recaptured at up to 25%, and gains may owe capital-gains tax (a 1031 exchange can defer both). Figures are a year-1 estimate at your 24.0% rate — not tax advice; consult a CPA.
Schools (NCES district)
- District
- Porum
- NCES district ID
- 4024840
- Math proficiency
- 19% ▼ -11.00%
- Reading proficiency
- 24% ▼ -5.00%
- Median HH income
- $30,183
- Composite
- 17.25/100
- National rank
- #9092
- State rank
- #172 of 270 in OK
Livability — Porum
- Score
- 62/100
- State rank
- #240
- US rank
- #16214
Category grades
Schools grade is shown separately in the Schools card above.
Census & demographics
- Census place
- Porum, OK
- City population
- 2,717
- Population (ZIP)
- 2,717
Population outlook (Muskogee County) Hauer SSP2
- Today (2025)
- 66,842 people
- By 2030
- 64,969 · -2.8%
- By 2040
- 60,920 · -8.9%
- By 2050
- 56,978 · -14.8%
- By 2075
- 47,160 · -29.4%
- By 2100
- 35,336 · -47.1%
Race, ethnicity, and origin ACS 2023
- Neighborhood character
- Predominantly White (73%)
- Race & ethnicity
- White 73% Native American 15% Two or more races 9% Hispanic / Latino 2%
- Common ancestry
- Italian 1% Portuguese 1%
- Foreign-born
- 1% · Canada
- Languages at home
- 98% English-only · Other Asian/Pacific 1%
Political lean MEDSL · Muskogee
- 2024 margin
- Solid R (+37.6) · D 30.4% · R 68.0% · Other 1.7%
- 2008→2024 swing
- -22.6pp toward R · 2008: -15.0pp · 2024: -37.6pp
- All cycles
- 2024: R+37.6 2020: R+33.9 2016: R+29.2 2012: R+14.8 2008: R+15.0
Not yet ingested
- Civics
- —
Market trends
- HPI YoY
- ▲ 6.57%
- Current HPI
- 288.3386
- Rent YoY
- —
- Metro
- —
- State GDP YoY
- ▲ 1.55%
- F500 in state
- 6
Industry mix (Fortune 500 HQ in OK)
| Industry | F500 HQs | Revenue |
|---|---|---|
| Energy | 3 | $48B |
|
||
Price history
+86.7% since first listed4 events — show timeline
- 2026-04-23 Listed $127,900 MLS Technology, Inc.
- 2021-03-19 Sold (Public Records) $69,000 Public Records
- 2021-03-12 Listing Removed — MLS Technology, Inc.
- 2020-09-14 Listed $68,500 MLS Technology, Inc.
Property tax history
+5.3%/yrLatest (2025): $724 · +8.9% YoY. Source: county tax records.
Cash-flow waterfall
monthlySold comps — $/sqft
last 12 mo · ≤1 miLoading sold comps…