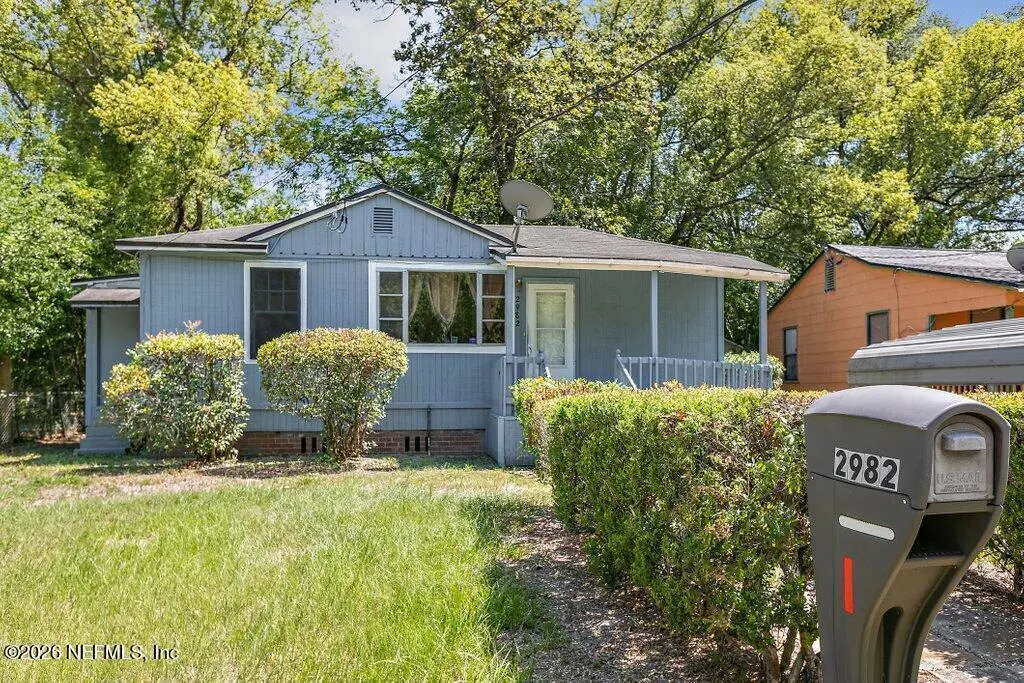
2982 Dellwood Ave · Jacksonville, FL
Flood risk 7/10 · Major
- FEMA flood zone
- X (unshaded)
- Chance of flooding over 30 yrs
- 0.76%
- Est. flood insurance / yr
- $507 – $1,088
Fire risk 1/10 · Minimal
- Est. fire insurance / yr
- $947 – $1,759
Heat risk 9/10 · Severe
- Hot days now (above 107°F)
- 7 days/yr
- Hot days in 30 yrs
- 20 days/yr
Wind risk 9/10 · Severe
- Chance of severe wind over 30 yrs
- 99.0%
Air-quality risk 5/10 · Moderate
- Unhealthy air days now
- 7 days/yr
- Unhealthy air days in 30 yrs
- 7 days/yr
Risk factors via First Street. Map © Google.
Why this score? — see what drove the C grade
The composite is a weighted blend of 9 inputs, each scored 0–100. Each bar is that input's sub-score; the figure is the points it added to the 100-point composite (weight × sub-score).
- Cash flow +18.0/30.0
- ARV discount +15.0/15.0
- DSCR +5.6/10.0
- 1% rule +4.7/10.0
- Livability +4.2/5.0
- Schools +3.9/10.0
- Rent growth +2.9/5.0
- Condition / age +2.5/5.0
- Appreciation +0.0/10.0
$129,000
🖨 Deal sheet 📄 Offer letter ✓ Due diligence
Listing remarks
Incredible opportunity awaits in the highly sought-after Murray Hill neighborhood. Located just minutes from the vibrant dining, shopping, and nightlife of historic Riverside, this charming three-bedroom, one-bathroom bungalow is aggressively priced and primed for a great deal. Whether you are an equity-minded homebuyer looking for a cozy space to make your own or a savvy investor looking to maximize profit, execute a profitable flip, or add a high-demand asset to your rental portfolio, this versatile property delivers on all fronts. The functional layout offers the perfect canvas for your personal updates, while the prime location places you right in the heart of one of Jacksonville's most
Key facts
- Walkable areas
- Functional layout
- Historic riverside
Tags
Property features AI
Finance
- HOA & community: Not a senior community
Exterior
- Parking: Additional parking
- Utilities: Public sewer; Electricity available; Sewer available; Water available; City street frontage; Asphalt road surface
- Home design: Single family residence; One story; Faces north; Used as a residential single-family home
- Construction: Shingle roof
- Exterior features: Front porch; Back yard fencing; Chain link fence; Wood fence; Shingle roof
Interior
- Kitchen: Electric cooktop; Electric oven; Refrigerator
- Bedrooms: 3 bedrooms
- Flooring: Carpet; Laminate
- Bathrooms: 1 full bathroom
- Heating & cooling: Central heating; Central air
- Interior features: Central heating; Central air conditioning; Unfurnished
- Laundry & utility: Washer hookup; Electric dryer hookup
Neighborhood map
What this means for you Summary
Snapshot
- This is a 2-bed/1.0-bath single-family listed at $129k.
Deal economics
- At list price, monthly cash flow is $45 ($539/yr) — positive.
- The deal already cash-flows at list — no discount required.
- To meet the 1% rule (rent ≥ 1% of price), the offer needs to be $125k (3.2% below list).
- Recommended offer: $125k (3.2% below list) — sets the bar for 1% rule.
- Cap rate 7.3% vs local median 4.0% in Jacksonville — top-decile yield for the area; either an underpriced asset or a hidden risk that comps aren't pricing in. Stress-test before assuming the spread holds.
Location & tenants
- Location reads 83/100 on livability (#50 in FL, #911 nationally) — a professional / high-income tenant draw. Strengths: amenities A+, commute A+, housing A+.
- Duval (urban): math 46% / reading 45% proficiency, ranked #48 of 73 in FL (top 66%) — families likely to look elsewhere, expect single-tenant / working-renter base with shorter leases.
- Zoned schools: Ruth N. Upson Elementary School (math 72% / reading 67%, grade A-, #364 of 2,144 statewide, top 19%, 376 students, 61% FRL); Lake Shore Middle School (math 25% / reading 22%, grade F, #536 of 571 statewide, top 95%, 972 students, 75% FRL); Riverside High School (math 24% / reading 39%, grade F, #424 of 667 statewide, top 64%, 1,567 students, 60% FRL) — zoned schools average 65% FRL vs 49% district-wide (16 pts higher); higher-poverty schools than district average — tighter screening recommended.
- Market conditions: Rents rising (+1.7%/yr); 320 active listings in the ZIP; 40 comparable units currently listed for rent nearby; rentals at typical pace (median 17d on market — plan ~3-4 weeks tenant-placement turnaround); 6,503 units permitted in Duval County in 2024 (1,131 in 5+ unit buildings).
Forward outlook
- Local home prices are declining (-3.0%/yr); year-one equity from $892 of loan paydown is wiped out by about $4k of value loss. Plan a longer hold.
- Duval County population projected at +19% by 2050 — long-run rental-demand tailwind backs the buy-and-hold thesis.
Negotiation context
- It's been on market 26 days — a 2% lower offer ($127k) is reasonable based on typical stale-listing flexibility.
- Current owner paid $10k; list at $129k implies a 1190% gain — meaningful room to come down on a strong offer.
Risks & watch-outs
- Watch-outs: flood insurance adds $66/mo; built in 1944 — expect roof / HVAC / electrical / plumbing capex.
- Climate carrying-cost: major flood risk; severe wind risk, 99% chance of damaging wind over 30y; extreme-heat days projected 7→20/yr by 2055 (HVAC capex compounding) — expect insurance premiums to compound above CPI over the hold.
Questions for the listing agent
- Built in 1944 — when were the roof, HVAC, electrical panel, plumbing, and water heater last replaced?
- What's the actual annual flood-insurance premium (NFIP or private), and is the property in a SFHA with mandatory coverage?
- Is there a deadline driving the sale (1031 exchange, divorce, estate, relocation)? That informs how much negotiation room exists.
- Schools are B-rated — typically a magnet for longer-tenancy family renters. What's the average tenant stay here, and is there a school-zone premium baked into asking?
- What's the average days-on-market for RENTAL listings here right now (not sales)? A rising rental-DOM trend means longer vacancies and softer asking-rent achievability than the comps imply.
- What's the recent tenant-quality profile in this submarket — average credit score on applications, eviction rate, late-payment / NSF rate, and stable-employment percentage? A property-management company in the area should have these aggregated.
- How much new for-sale + rental construction is in the pipeline within 1–3 miles? Heavy new supply typically softens prices + rents 12–24 months out; constrained supply supports both.
Investment metrics
- 1% rule
- 0.97% ✗
- Cap rate
- 7.33%
- Cash-on-cash
- 3.70%
- DSCR
- 1.16
- GRM
- 8.6
CMA / ARV
- ARV (on-the-fly)
- $170,280
- Comps found
- 12
Show comp detail 12 sales within ~0.75 mi
| Address | Dist | Beds/Ba | Sqft | Sold | Price | $/sf | Match |
|---|---|---|---|---|---|---|---|
| 3053 Gilmore St | 0.19mi | 2/1.0 | 1,008 (+7%) | 0mo | $130,000 | $129 | 80 |
| 3034 Rayford St | 0.27mi | 2/1.0 | 912 (-4%) | 2mo | $160,000 | $175 | 79 |
| 646 Day Ave | 0.36mi | 3/1.0 (+1) | 922 (-2%) | 3mo | $180,000 | $195 | 72 |
| 3119 Rosselle St | 0.27mi | 3/1.0 (+1) | 1,018 (+8%) | 3mo | $167,500 | $165 | 68 |
| 3333 Ernest St | 0.49mi | 3/1.0 (+1) | 984 (+4%) | 1mo | $207,000 | $210 | 65 |
| 3207 Dellwood Ave | 0.31mi | 2/1.0 | 824 (-13%) | 0mo | $165,000 | $200 | 64 |
| 3332 Dellwood Ave | 0.48mi | 2/1.0 | 1,023 (+8%) | 0mo | $184,000 | $180 | 64 |
| 3140 Thomas St | 0.71mi | 3/1.0 (+1) | 928 (-2%) | 3mo | $60,000 | $65 | 56 |
| 2881 Lenox Ave | 0.42mi | 3/1.0 (+1) | 1,068 (+13%) | 2mo | $90,000 | $84 | 52 |
| 2858 Downing St | 0.56mi | 3/1.0 (+1) | 1,080 (+14%) | 0mo | $195,000 | $181 | 45 |
| 2807 Lydia St | 0.67mi | 2/2.0 | 1,080 (+14%) | 2mo | $375,000 | $347 | 40 |
| 3205 Dignan St | 0.65mi | 3/2.0 (+1) | 1,080 (+14%) | 2mo | $140,000 | $130 | 35 |
Match score weights: distance 35% · size 25% · config 20% · recency 20%. Top-matched comps best support the ARV.
Projected returns pro-forma
-3.0% appreciation · 1.73% rent growth · sell at horizon
- IRR
- -15.4%
- Equity multiple
- 0.46×
- Total profit
- $-19,569
- Equity at exit
- $19,234
- IRR
- -9.3%
- Equity multiple
- 0.46×
- Total profit
- $-19,458
- Equity at exit
- $11,154
Cash invested: $36,120 (down + closing). Projections, not guarantees.
Landlord ↔ Tenant lean methodology
- Overall (STATE)
- 87 Strongly Landlord-Friendly
- State Florida
- 87 Strongly Landlord-Friendly · R+3
- County
- — inherits STATE
- City
- — inherits STATE
ZIP-level market 32205
- Rents YoY
- 1.7%
- Active inventory
- 320
- Price-to-rent
- 8.6×
Monthly cashflow live
- Estimated rent
- $1,249 high interval (Pro) →
- Mortgage (P&I)
- −$676
- Tax from tax record
- −$145 /mo · $1,739/yr
- Insurance
- −$54
- Flood insurance flood zone
- −$66 /mo · $798/yr
- HOA
- −$0
- Vacancy / Maint / Mgmt
- −$262
- Net cashflow
- $45
Break-even live
UW: 25.0% down · 7.5% · 30yr · 1.5% tax · 5.0% vac · 8.0% maint · 8.0% mgmt
Financing live
Cash to close
- Down payment
- $32,250
- Closing costs
- $3,870
- Reserves months
- —
- Total cash needed
- —
Loan-product check · same deal, 3 products live
Conventional
25% down · 7.5% · 30yr
- Down + closing
- —
- Monthly P&I
- —
- Monthly cashflow
- —
- DSCR
- —
- Eligible?
- —
Personal DTI + credit; lowest rate.
DSCR
20% down · 8.5% · 30yr
- Down + closing
- —
- Monthly P&I
- —
- Monthly cashflow
- —
- DSCR
- —
- Eligible?
- —
No personal income docs; deal must DSCR.
Hard money
10% down · 12.0% · 12mo
- Down + closing
- —
- Monthly P&I
- —
- Monthly cashflow
- —
- DSCR
- —
- Eligible?
- —
Short-term bridge; refi at stabilization.
Rent comps 40 comps
| Address | Beds | Baths | Sqft | Rent | $/sqft | DOM | Units | Dist |
|---|---|---|---|---|---|---|---|---|
| 809 McDuff Ave S Jacksonville, FL | 2.0 | 1.0 | 1006 | $995 | $0.99 | 4d | 1 | 0.03mi |
| 2980 Ernest St Jacksonville, FL | 2.0 | 1.0 | 920 | $1,200 | $1.30 | 23d | 1 | 0.04mi |
| 2920 Dellwood Ave #2 Jacksonville, FL | 1.0 | 1.0 | 650 | $900 | $1.38 | 7d | 1 | 0.13mi |
| 2920 Dellwood Ave Unit 4 Jacksonville, FL | 1.0 | 1.0 | 650 | $900 | $1.38 | 10d | 1 | 0.13mi |
| 3036 Green St Jacksonville, FL | 3.0 | 1.0 | 924 | $1,495 | $1.62 | 23d | 1 | 0.16mi |
| 975 Willow Branch Ave Jacksonville, FL | 1.0 | 1.0 | 950 | $1,200 | $1.26 | 4d | 1 | 0.26mi |
| 2929 Post St Jacksonville, FL | 1.0 | 1.0 | 950 | $1,100 | $1.16 | 4d | 1 | 0.27mi |
| 2892 College St Unit 2892-2 Jacksonville, FL | 1.0 | 1.0 | 700 | $1,195 | $1.71 | 17d | 1 | 0.29mi |
| 2908 Post St Unit 4 Jacksonville, FL | 1.0 | 1.0 | 720 | $995 | $1.38 | 2d | 1 | 0.32mi |
| 2908 Post St Apt 3 Jacksonville, FL | 1.0 | 1.0 | 720 | $995 | $1.38 | 14d | 1 | 0.32mi |
| 2877 Post St Unit 07 Jacksonville, FL | 1.0 | 1.0 | 650 | $995 | $1.53 | 17d | 1 | 0.33mi |
| 2853 College St Unit 1 Jacksonville, FL | 1.0 | 1.0 | 655 | $1,100 | $1.68 | 23d | 1 | 0.33mi |
| 3233 Dellwood Ave Jacksonville, FL | 2.0 | 2.0 | 1000 | $1,750 | $1.75 | 23d | 1 | 0.34mi |
| 2851 College St Unit 1 Jacksonville, FL | 1.0 | 1.0 | 655 | $1,100 | $1.68 | 23d | 1 | 0.35mi |
| 1052 Willow Branch Ave #2 Jacksonville, FL | 1.0 | 1.0 | 730 | $891 | $1.22 | 23d | 1 | 0.37mi |
| 3236 Phyllis St Unit 3244 Jacksonville, FL | 2.0 | 1.0 | 720 | $850 | $1.18 | 23d | 1 | 0.39mi |
| 2759 Dellwood Ave Jacksonville, FL | 3.0 | 2.0 | 1080 | $2,100 | $1.94 | 19d | 1 | 0.41mi |
| 3250 Phyllis St Jacksonville, FL | 2.0 | 1.0 | 720 | $850 | $1.18 | 23d | 1 | 0.42mi |
| 3233 Post St Jacksonville, FL | 2.0 | 1.0 | 750 | $1,095 | $1.46 | 23d | 1 | 0.42mi |
| 2803 College St Jacksonville, FL | 2.0 | 1.0 | 1100 | $1,550 | $1.41 | 14d | 1 | 0.43mi |
| 3312 Ernest St Jacksonville, FL | 3.0 | 1.0 | 1065 | $1,148 | $1.08 | 23d | 1 | 0.43mi |
| 3313 Green St Jacksonville, FL | 3.0 | 1.0 | 1058 | $1,450 | $1.37 | 7d | 1 | 0.44mi |
| 3353 Dellwood Ave Jacksonville, FL | 3.0 | 1.0 | 934 | $1,595 | $1.71 | 17d | 1 | 0.50mi |
| 1098 Cherry St Unit 1 Jacksonville, FL | 1.0 | 1.0 | 700 | $1,250 | $1.79 | 17d | 1 | 0.51mi |
| 3337 Post St Unit 2 Jacksonville, FL | 1.0 | 1.0 | 642 | $925 | $1.44 | 10d | 1 | 0.53mi |
| 2966 Remington St #4 Jacksonville, FL | 1.0 | 1.0 | 650 | $1,100 | $1.69 | 14d | 1 | 0.54mi |
| 2966 Remington St #4 Jacksonville, FL | 1.0 | 1.0 | 650 | $1,095 | $1.68 | 14d | 1 | 0.54mi |
| 2701 Myra St Jacksonville, FL | 3.0 | 1.0 | 1065 | $1,595 | $1.50 | 21d | 1 | 0.54mi |
| 3343 Post St Unit 1 Jacksonville, FL | 1.0 | 1.0 | 642 | $925 | $1.44 | 10d | 1 | 0.54mi |
| 1109 Cherry St Unit 4 Jacksonville, FL | 1.0 | 1.0 | 850 | $1,195 | $1.41 | 20d | 1 | 0.55mi |
| 420 Sunshine St Jacksonville, FL | 3.0 | 2.0 | 1050 | $1,350 | $1.29 | 1d | 1 | 0.55mi |
| 2979 Downing St Unit 1 Jacksonville, FL | 1.0 | 1.0 | 700 | $1,170 | $1.67 | 7d | 1 | 0.57mi |
| 2979 Downing St Unit 2 Jacksonville, FL | 1.0 | 1.0 | 700 | $1,250 | $1.79 | 23d | 1 | 0.57mi |
| 3307 Mayflower St #1 Jacksonville, FL | 2.0 | 1.0 | 820 | $1,125 | $1.37 | 7d | 1 | 0.58mi |
| 2786 Downing St Jacksonville, FL | 1.0 | 1.0 | 900 | $1,200 | $1.33 | 23d | 1 | 0.58mi |
| 3356 Lenox Ave Jacksonville, FL | 2.0 | 1.0 | 899 | $999 | $1.11 | 23d | 1 | 0.61mi |
| 3329 Mayflower St Unit 3331 Jacksonville, FL | 1.0 | 1.0 | 616 | $1,095 | $1.78 | 4d | 1 | 0.63mi |
| 3319 Hunt St Jacksonville, FL | 3.0 | 1.0 | 924 | $1,295 | $1.40 | 23d | 1 | 0.64mi |
| 3035 Fitzgerald St Jacksonville, FL | 2.0 | 1.0 | 900 | $1,021 | $1.13 | 3d | 1 | 0.64mi |
| 676 Bridal Ave Jacksonville, FL | 3.0 | 2.0 | 1008 | $1,450 | $1.44 | 23d | 1 | 0.65mi |
Listing history 16 events
-
2026-06-17days on market $129,000 Active 26 DOM
-
2026-06-16days on market $129,000 Active 25 DOM
-
2026-06-15days on market $129,000 Active 24 DOM
-
2026-06-13days on market $129,000 Active 22 DOM
-
2026-06-13days on market $129,000 Active 21 DOM
-
2026-06-10days on market $129,000 Active 18 DOM
-
2026-06-08days on market $129,000 Active 17 DOM
-
2026-06-07days on market $129,000 Active 16 DOM
-
2026-06-05days on market $129,000 Active 13 DOM
-
2026-06-03days on market $129,000 Active 12 DOM
-
2026-06-02days on market $129,000 Active 11 DOM
-
2026-06-01days on market $129,000 Active 10 DOM
-
2026-05-31days on market $129,000 Active 9 DOM
-
2026-05-22$129,000 Active
-
1991-12-17soldstatus $10,000
-
1985-07-01soldstatus $18,400
ⓘ Source: listings_history table (triggers on properties + properties_extension) + one-shot
backfill from property_details.listing_events for pre-trigger history.
Tax reassessment forecast FL · Resets to sale price
- Current annual tax
- $1,739 · $145/mo
- Projected year-2 tax
- $1,739 · $145/mo
- Expected delta
- $0/yr ($0/mo · 0.0%)
ⓘ Screening estimate from a state-policy table — verify with the county assessor before closing.
Climate risk First Street
- Flood 7/10 Severe FEMA zone X (unshaded) · 76% chance over 30 yrs
- Wildfire 1/10 Low
- Heat 9/10 Extreme 7 d/yr ≥107°F today · 20 d/yr by 30 yrs out
- Wind 9/10 Extreme 99% chance of damaging wind over 30 yrs
- Air quality 5/10 Major 7 unhealthy d/yr today · 7 by 30 yrs out
Nearby sold comps map
Loading sold comps map…
Walkable amenities ~0.75 mi
Loading nearby amenities…
Taxation est. · year 1
- Rental income
- $14,986
- − Mortgage interest
- −$7,226
- − Property taxes
- −$1,739
- − Insurance
- −$1,442
- − Repairs & maintenance
- −$1,199
- − Management
- −$1,199
- − Depreciation
- −$3,753
- Taxable loss
- −$1,573
- Est. tax savings @ 24.0%
- +$377
- After-tax cash flow
- $916/yr
For passive investors: Depreciation is non-cash, so a rental often shows a tax loss while cash-flowing — sheltering income. Rental losses are passive: they offset passive income freely, and up to $25,000/yr can offset ordinary (W-2) income if you actively participate and your MAGI is under $100k (phasing out to $0 by $150k); unused losses carry forward. On sale, claimed depreciation is recaptured at up to 25%, and gains may owe capital-gains tax (a 1031 exchange can defer both). Figures are a year-1 estimate at your 24.0% rate — not tax advice; consult a CPA.
Schools (NCES district)
- District
- Duval
- NCES district ID
- 1200480
- Math proficiency
- 46% ▼ -11.00%
- Reading proficiency
- 45% ▼ -4.00%
- Median HH income
- $48,987
- Composite
- 38.97/100
- National rank
- #4076
- State rank
- #48 of 73 in FL
Livability — Jacksonville
- Score
- 83/100
- State rank
- #50
- US rank
- #911
Category grades
Schools grade is shown separately in the Schools card above.
Census & demographics
- Census place
- Jacksonville, FL
- County
- Duval County · 1,015,274 people
- City population
- 979,034
- Metro
- Jacksonville, FL
- Population (ZIP)
- 29,148
- Household income
- $64,789
- Rent vs Own
- Severe rent burden
- 1398.0
Population outlook (Duval County) Hauer SSP2
- Today (2025)
- 1,013,010 people
- By 2030
- 1,059,228 · +4.6%
- By 2040
- 1,141,439 · +12.7%
- By 2050
- 1,205,258 · +19.0%
- By 2075
- 1,324,282 · +30.7%
- By 2100
- 1,319,620 · +30.3%
Race, ethnicity, and origin ACS 2023
- Neighborhood character
- Diverse neighborhood (Simpson 0.59)
- Race & ethnicity
- White 59% Black 21% Hispanic / Latino 11% Two or more races 7% Asian 3%
- Hispanic origin (detail)
- Mexican 3% Puerto Rican 4% Cuban 1%
- Common ancestry
- Slovak 3% Lithuanian 2% Romanian 2%
- Foreign-born
- 8% · Canada, Vietnam, Dominican Republic
- Languages at home
- 88% English-only · Spanish 8% Vietnamese 1% French/Haitian/Cajun 1%
Political lean MEDSL · Duval
- 2024 margin
- Toss-up / Even · D 48.7% · R 50.1% · Other 1.2%
- 2008→2024 swing
- +0.4pp no change · 2008: -1.9pp · 2024: -1.5pp
- All cycles
- 2024: R+1.5 2020: D+3.8 2016: R+1.5 2012: R+3.6 2008: R+1.9
Not yet ingested
- Civics
- —
Market trends
- HPI YoY
- ▼ -386.70%
- Current HPI
- 310.4566
- Rent YoY
- ▲ 1.73%
- Metro
- Jacksonville, FL
- State GDP YoY
- ▲ 3.28%
- F500 in state
- 36
Industry mix (Fortune 500 HQ in FL)
| Industry | F500 HQs | Revenue |
|---|---|---|
| Industrial Technology | 2 | $29B |
|
||
| Insurance | 2 | $17B |
|
||
| Retail | 1 | $60B |
|
||
| Technology Distribution | 1 | $58B |
|
||
| Homebuilding | 1 | $35B |
|
||
| Technology Manufacturing | 1 | $35B |
|
||
Price history
+601.1% since first listed3 events — show timeline
- 2026-05-22 Listed $129,000 realMLS
- 1991-12-17 Sold (Public Records) $10,000 Public Records
- 1985-07-01 Sold (Public Records) $18,400 Public Records
Property tax history
+7.4%/yrLatest (2025): $1,739 · +17.5% YoY. Source: county tax records.
Cash-flow waterfall
monthlySold comps — $/sqft
last 12 mo · ≤1 miLoading sold comps…