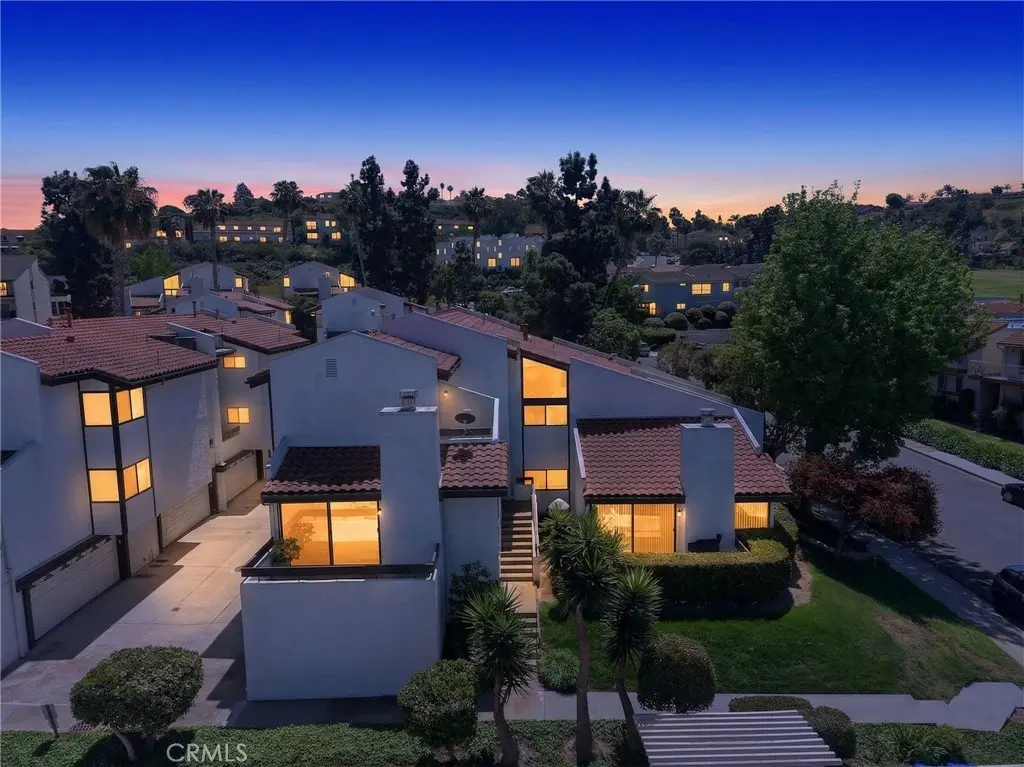
7526 Jerez Ct #4 · Carlsbad, CA
Flood risk 1/10 · Minimal
- FEMA flood zone
- X (unshaded)
- Chance of flooding over 30 yrs
- 0.0%
- Est. flood insurance / yr
- $507 – $1,088
Fire risk 4/10 · Minor
- Est. fire insurance / yr
- $659 – $1,223
Heat risk 5/10 · Moderate
- Hot days now (above 89°F)
- 7 days/yr
- Hot days in 30 yrs
- 23 days/yr
Wind risk 1/10 · Minimal
- Chance of severe wind over 30 yrs
- —
Air-quality risk 4/10 · Minor
- Unhealthy air days now
- 4 days/yr
- Unhealthy air days in 30 yrs
- 4 days/yr
Risk factors via First Street. Map © Google.
Why this score? — see what drove the D- grade
The composite is a weighted blend of 9 inputs, each scored 0–100. Each bar is that input's sub-score; the figure is the points it added to the 100-point composite (weight × sub-score).
- ARV discount +7.5/15.0
- Schools +7.1/10.0
- Cash flow +6.0/30.0
- Appreciation +5.5/10.0
- Livability +3.9/5.0
- Rent growth +3.7/5.0
- Condition / age +2.5/5.0
- 1% rule +1.1/10.0
- DSCR +0.4/10.0
$775,000
🖨 Deal sheet (PDF) 📄 Offer letter ✓ Due diligence
Listing remarks
Welcome to coastal living at its finest in the highly sought-after La Costa golf course community of Carlsbad. This rare end-unit, three-level condo offers one of the largest and most desirable floorplans in the neighborhood, with 1,867 square feet of open, light-filled living space designed for both comfort and style. Step inside from the main-level two-car garage—complete with in-unit laundry—and head upstairs to a bright and airy living area perfect for relaxing or entertaining. The spacious second floor features a custom wet bar, a private balcony to catch the ocean breeze, a designated dining space, and a well-appointed kitchen with stone countertops and seamless flow. A be
Key facts
- End-unit
- Custom wet bar
- Private balcony
Tags
Property features AI
Finance
- Other: Living area and lot size sourced from assessor/public records; Lot size source: Assessor's Data; Year built source: Public Records
- HOA & community: Part of an association (Jerez Ct Condos); Monthly association fee; Association provides insurance, pest control, and grounds maintenance; Association rules (call for rules); Community of 24 units; Community features: curbs, golf course access, hiking, street lighting, storm drains, sidewalks
Exterior
- Parking: Attached garage with rear entry; Direct garage access; Two garage spaces; Two total parking spaces; Two-door garage
- Security: Carbon monoxide detector(s); Smoke detector
- Utilities: Public sewer; District/public water; Natural gas connected; Electricity connected; Sewer connected; Water connected
- Home design: House structure (attached property / condominium); End unit with one common wall; No one above or below; Three or more levels; Entry at level 1 (front door or garage)
- Construction: No fencing; Property identified as Condominium; No ADU
- Exterior features: Concrete patio; Has patio; No pool; Corner lot; Landscaped; Has view
Interior
- Kitchen: Formal, separate dining area; Stone counters
- Bedrooms: Primary bedroom; Main floor bedroom; Walk-in closet
- Flooring: Vinyl flooring; Carpet
- Bathrooms: Two full bathrooms; One half bathroom; Walk-in shower; Shower; Stone counters in bathrooms
- Heating & cooling: Central cooling; Central furnace; Fireplace heating
- Interior features: Sliding glass doors; Mirrored closet doors; Tile counters; Two staircases; Blinds; Window screens; Carbon monoxide detector(s); Smoke detector
- Laundry & utility: Washer hookup; Gas dryer hookup; Laundry area in garage
Neighborhood map
What this means for you Summary
Snapshot
- This is a 2-bed/3.0-bath condo listed at $775k.
Deal economics
- At list price, monthly cash flow is $-1k ($-18k/yr) — negative.
- To cash-flow at today's rent, offer at most $515k (33.5% below list).
- To meet the 1% rule (rent ≥ 1% of price), the offer needs to be $476k (38.6% below list).
- Recommended offer: $476k (38.6% below list) — sets the bar for 1% rule.
- Cap rate 4.0% vs local median 2.1% in Carlsbad — top-decile yield for the area; either an underpriced asset or a hidden risk that comps aren't pricing in. Stress-test before assuming the spread holds.
Location & tenants
- Location reads 78/100 on livability (#67 in CA, #2,526 nationally) — a middle-class / working-renter tenant base. Strengths: amenities A+, commute A+, employment A+; Watch: health & safety D+, cost of living F.
- San Dieguito Union High (urban): math 72% / reading 79% proficiency, ranked #56 of 1,400 in CA (top 4%) — strong family-tenant draw, lease renewals of 3-5y typical; only 8% free/reduced lunch — higher-income household profile.
- Zoned schools: La Costa Heights Elementary (634 students, 14% FRL); Oak Crest Middle (802 students, 24% FRL); Canyon Crest Academy (2,336 students, 11% FRL).
- Market conditions: Rents rising fast (+4.9%/yr); 177 active listings in the ZIP; 10 comparable units currently listed for rent nearby; rentals leasing fast (median 5d on market — plan ~1-2 weeks tenant-placement turnaround); high-income renter base; 11,759 units permitted in San Diego County in 2024 (7,244 in 5+ unit buildings).
- This rent runs 35% of the median local income ($164k/yr) — at the standard rent-burdened threshold; future hikes will face affordability resistance.
Forward outlook
- In year one you build about $13k of equity ($5k loan paydown + $7k appreciation (1.0% local appreciation)).
- San Diego County population projected at +20% by 2050 — long-run rental-demand tailwind backs the buy-and-hold thesis.
- By year 4, paydown + projected appreciation supports a ~$47k cash-out refi (75% LTV) — recoverable capital for the next deal without selling this one.
Negotiation context
- It's been on market 68 days — a 6% lower offer ($728k) is reasonable based on typical stale-listing flexibility.
- Current owner paid $160k; list at $775k implies a 384% gain — meaningful room to come down on a strong offer.
Risks & watch-outs
- Climate carrying-cost: extreme-heat days projected 7→23/yr by 2055 (HVAC capex compounding) — expect insurance premiums to compound above CPI over the hold.
Questions for the listing agent
- What do current leases actually rent for vs. the listed asking? Can we see a recent rent roll and the last 12 months of T-12 income?
- It's been on market 68 days. Have you received any prior offers? Is the seller open to a 39% concession, seller financing, or rate buy-down credit?
- Built in 1975 — when were the roof, HVAC, electrical panel, plumbing, and water heater last replaced?
- What does the HOA fee cover, when was the last increase, and are there any pending special assessments or reserve-fund shortfalls?
- Any open or pending special assessments — roof, HVAC, plumbing, elevator, façade? What's the per-unit balance and payoff schedule, and is the seller paying it off at close or rolling it to the buyer?
- Why hasn't it sold? Are there any deal-killer items the seller is aware of (foundation, flood, title, zoning, code violations)?
- Is there a deadline driving the sale (1031 exchange, divorce, estate, relocation)? That informs how much negotiation room exists.
- Schools are A-rated — typically a magnet for longer-tenancy family renters. What's the average tenant stay here, and is there a school-zone premium baked into asking?
- The area grade is low — what's the realistic commute time and amenity access for the typical tenant pool here? Any planned neighborhood developments (good or bad) we should know about?
- What's the average days-on-market for RENTAL listings here right now (not sales)? A rising rental-DOM trend means longer vacancies and softer asking-rent achievability than the comps imply.
- What's the recent tenant-quality profile in this submarket — average credit score on applications, eviction rate, late-payment / NSF rate, and stable-employment percentage? A property-management company in the area should have these aggregated.
- How much new apartment / multifamily construction is in the pipeline within 1–3 miles? Heavy new supply (>2% of stock underway) typically softens rents 12–24 months out; light construction supports rent growth.
Investment metrics
- 1% rule
- 0.61% ✗
- Cap rate
- 4.02%
- Cash-on-cash
- -8.13%
- DSCR
- 0.64
- GRM
- 13.6
CMA / ARV
No comps found within radius.
Projected returns pro-forma
0.97% appreciation · 4.9% rent growth · sell at horizon
- IRR
- -6.5%
- Equity multiple
- 0.67×
- Total profit
- $-71,163
- Equity at exit
- $263,223
- IRR
- 0.0%
- Equity multiple
- 1.00×
- Total profit
- $925
- Equity at exit
- $348,759
Cash invested: $217,000 (down + closing). Projections, not guarantees.
Landlord ↔ Tenant lean methodology
- Overall (STATE)
- 18 Strongly Tenant-Friendly
- State California
- 18 Strongly Tenant-Friendly · D+13
- County
- — inherits STATE
- City
- — inherits STATE
ZIP-level market 92009
- Home prices YoY
- 0.2%
- Rents YoY
- 4.9%
- Active inventory
- 177
- Price-to-rent
- 13.6×
Monthly cashflow live
- Estimated rent
- $4,757 high interval (Pro) →
- Mortgage (P&I)
- −$4,064
- Tax from tax record
- −$289 /mo · $3,472/yr
- Insurance
- −$323
- HOA
- −$552
- Vacancy / Maint / Mgmt
- −$999
- Net cashflow
- $-1,470
Break-even live
Sensitivity live
| Price | -10% $-1,032 | -5% $-1,251 | +0% $-1,470 | +5% $-1,690 | +10% $-1,909 |
|---|---|---|---|---|---|
| Rent | -10% $-1,846 | -5% $-1,658 | +0% $-1,470 | +5% $-1,282 | +10% $-1,095 |
| Rate | -1.0pp $-1,080 | -0.5pp $-1,273 | base $-1,470 | +0.5pp $-1,671 | +1.0pp $-1,875 |
UW: 25.0% down · 7.5% · 30yr · 1.5% tax · 5.0% vac · 8.0% maint · 8.0% mgmt
Financing live
Cash to close
- Down payment
- $193,750
- Closing costs
- $23,250
- Reserves months
- —
- Total cash needed
- —
Loan-product check · same deal, 3 products live
Conventional
25% down · 7.5% · 30yr
- Down + closing
- —
- Monthly P&I
- —
- Monthly cashflow
- —
- DSCR
- —
- Eligible?
- —
Personal DTI + credit; lowest rate.
DSCR
20% down · 8.5% · 30yr
- Down + closing
- —
- Monthly P&I
- —
- Monthly cashflow
- —
- DSCR
- —
- Eligible?
- —
No personal income docs; deal must DSCR.
Hard money
10% down · 12.0% · 12mo
- Down + closing
- —
- Monthly P&I
- —
- Monthly cashflow
- —
- DSCR
- —
- Eligible?
- —
Short-term bridge; refi at stabilization.
Rent comps 10 comps
| Address | Beds | Baths | Sqft | Rent | $/sqft | DOM | Units | Dist |
|---|---|---|---|---|---|---|---|---|
| 7517 Jerez Ct Unit B Carlsbad, CA | 3.0 | 3.5 | 1827 | $6,500 | $3.56 | 25d | 1 | 0.06mi |
| 2607 Pirineos Way #111 Carlsbad, CA | 2.0 | 2.0 | 1400 | $3,550 | $2.54 | 0d | 1 | 0.17mi |
| 2564 Navarra Dr #206 Carlsbad, CA | 1.0 | 1.5 | 1427 | $3,500 | $2.45 | 0d | 1 | 0.18mi |
| 7563 Agua Dulce Ct Carlsbad, CA | 2.0 | 2.0 | 1291 | $3,400 | $2.63 | 0d | 1 | 0.76mi |
| 2319 Caringa Way #56 Carlsbad, CA | 2.0 | 2.0 | 1536 | $3,500 | $2.28 | 45d | 1 | 0.86mi |
| 7727 Caminito Monarca #108 Carlsbad, CA | 2.0 | 3.0 | 1250 | $1,850 | $1.48 | 4d | 1 | 1.08mi |
| 2657 Cazadero Dr #59 Carlsbad, CA | 3.0 | 2.5 | 2295 | $5,299 | $2.31 | 45d | 1 | 1.17mi |
| 7264 Estrella de Mar Rd Carlsbad, CA | 3.0 | 2.5 | 2304 | $6,300 | $2.73 | 0d | 1 | 1.19mi |
| 6801 El Fuerte St Carlsbad, CA | 2.0 | 2.5 | 1441 | $5,495 | $3.81 | 26d | 1 | 1.40mi |
| 2833 Luciernaga St Carlsbad, CA | 3.0 | 3.0 | 1856 | $5,500 | $2.96 | 4d | 1 | 1.44mi |
HOA detail condo
- Monthly dues
- $552 · $6,624/yr
- Assessments
- None detected in remarks — confirm with the listing agent.
Listing history 20 events
-
2026-06-21days on market $775,000 Active 68 DOM
-
2026-06-18days on market $775,000 Active 65 DOM
-
2026-06-17days on market $775,000 Active 64 DOM
-
2026-06-16days on market $775,000 Active 63 DOM
-
2026-06-15days on market $775,000 Active 62 DOM
-
2026-06-13days on market $775,000 Active 60 DOM
-
2026-06-13days on market $775,000 Active 59 DOM
-
2026-06-10price $775,000 Active 56 DOM
-
2026-06-09days on market $795,000 Active 56 DOM
-
2026-06-08days on market $795,000 Active 55 DOM
-
2026-06-07days on market $795,000 Active 54 DOM
-
2026-06-04days on market $795,000 Active 51 DOM
-
2026-06-03days on market $795,000 Active 50 DOM
-
2026-06-02days on market $795,000 Active 49 DOM
-
2026-06-01days on market $795,000 Active 48 DOM
-
2026-05-31days on market $795,000 Active 47 DOM
-
2026-04-14$835,000 Active
-
2026-04-14historical $835,000
-
1994-04-22soldstatus $160,000
-
1980-04-09soldstatus $68,000
ⓘ Source: listings_history table (triggers on properties + properties_extension) + one-shot
backfill from property_details.listing_events for pre-trigger history.
Tax reassessment forecast CA · Resets to sale price
- Current annual tax
- $3,472 · $289/mo
- Projected year-2 tax
- $5,890 · $491/mo
- Expected delta
- +$2,418/yr (+$202/mo · 69.6%)
ⓘ Screening estimate from a state-policy table — verify with the county assessor before closing.
Climate risk First Street
- Flood 1/10 Low FEMA zone X (unshaded) · 0% chance over 30 yrs
- Wildfire 4/10 Moderate
- Heat 5/10 Major 7 d/yr ≥89°F today · 23 d/yr by 30 yrs out
- Wind 1/10 Low
- Air quality 4/10 Moderate 4 unhealthy d/yr today · 4 by 30 yrs out
Nearby sold comps map
Loading sold comps map…
Walkable amenities ~0.75 mi
Loading nearby amenities…
Taxation est. · year 1
- Rental income
- $57,085
- − Mortgage interest
- −$43,412
- − Property taxes
- −$3,472
- − Insurance
- −$3,875
- − Repairs & maintenance
- −$4,567
- − Management
- −$4,567
- − HOA
- −$6,624
- − Depreciation
- −$22,545
- Taxable loss
- −$31,977
- Est. tax savings @ 24.0%
- +$7,675
- After-tax cash flow
- $-9,970/yr
For passive investors: Depreciation is non-cash, so a rental often shows a tax loss while cash-flowing — sheltering income. Rental losses are passive: they offset passive income freely, and up to $25,000/yr can offset ordinary (W-2) income if you actively participate and your MAGI is under $100k (phasing out to $0 by $150k); unused losses carry forward. On sale, claimed depreciation is recaptured at up to 25%, and gains may owe capital-gains tax (a 1031 exchange can defer both). Figures are a year-1 estimate at your 24.0% rate — not tax advice; consult a CPA.
Schools (NCES district)
- District
- San Dieguito Union High
- NCES district ID
- 0634380
- Math proficiency
- 72% ▬ 0.00%
- Reading proficiency
- 79% ▼ -1.00%
- Median HH income
- $110,199
- Composite
- 70.63/100
- National rank
- #519
- State rank
- #56 of 1400 in CA
Livability — Carlsbad
- Score
- 78/100
- State rank
- #67
- US rank
- #2526
Category grades
Schools grade is shown separately in the Schools card above.
Census & demographics
- Census place
- Carlsbad, CA
- County
- San Diego County · 3,178,799 people
- City population
- 114,373
- Metro
- San Diego-Chula Vista-Carlsbad, CA
- Population (ZIP)
- 44,739
- Household income
- $164,182
- Rent vs Own
- Severe rent burden
- 1152.0
Population outlook (San Diego County) Hauer SSP2
- Today (2025)
- 3,678,185 people
- By 2030
- 3,856,546 · +4.8%
- By 2040
- 4,171,407 · +13.4%
- By 2050
- 4,421,607 · +20.2%
- By 2075
- 4,831,599 · +31.4%
- By 2100
- 4,832,502 · +31.4%
Race, ethnicity, and origin ACS 2023
- Neighborhood character
- Predominantly White (69%)
- Race & ethnicity
- White 69% Hispanic / Latino 16% Two or more races 12% Asian 9% Black 1%
- Hispanic origin (detail)
- Mexican 12%
- Common ancestry
- Romanian 3% Italian 3% Lithuanian 2%
- Foreign-born
- 14% · Canada, China, Vietnam
- Languages at home
- 84% English-only · Spanish 8% Other Indo-European 3% Chinese 1%
Political lean MEDSL · San Diego
- 2024 margin
- D (+16.8) · D 56.9% · R 40.1% · Other 2.9%
- 2008→2024 swing
- +6.6pp toward D · 2008: 10.2pp · 2024: 16.8pp
- All cycles
- 2024: D+16.8 2020: D+22.8 2016: D+17.8 2012: D+5.1 2008: D+10.2
Not yet ingested
- Civics
- —
Market trends
- HPI YoY
- ▲ 0.97%
- Current HPI
- 448.8771
- Rent YoY
- ▲ 4.90%
- Metro
- San Diego-Chula Vista-Carlsbad, CA
- State GDP YoY
- ▲ 3.21%
- F500 in state
- 116
Industry mix (Fortune 500 HQ in CA)
| Industry | F500 HQs | Revenue |
|---|---|---|
| Technology | 27 | $1,492B |
|
||
| Financial Services | 3 | $174B |
|
||
| Retail | 3 | $44B |
|
||
| Insurance | 3 | $26B |
|
||
| Media / Entertainment | 2 | $115B |
|
||
| Pharmaceuticals / Biotech | 2 | $62B |
|
||
Price history
+1127.9% since first listed4 events — show timeline
- 2026-04-14 Listed $835,000 CRMLS
- 2026-04-14 Coming Soon $835,000 CRMLS
- 1994-04-22 Sold (Public Records) $160,000 Public Records
- 1980-04-09 Sold (Public Records) $68,000 Public Records
Property tax history
+2.4%/yrLatest (2025): $3,472 · +5.0% YoY. Source: county tax records.
Cash-flow waterfall
monthlySold comps — $/sqft
last 12 mo · ≤1 miLoading sold comps…