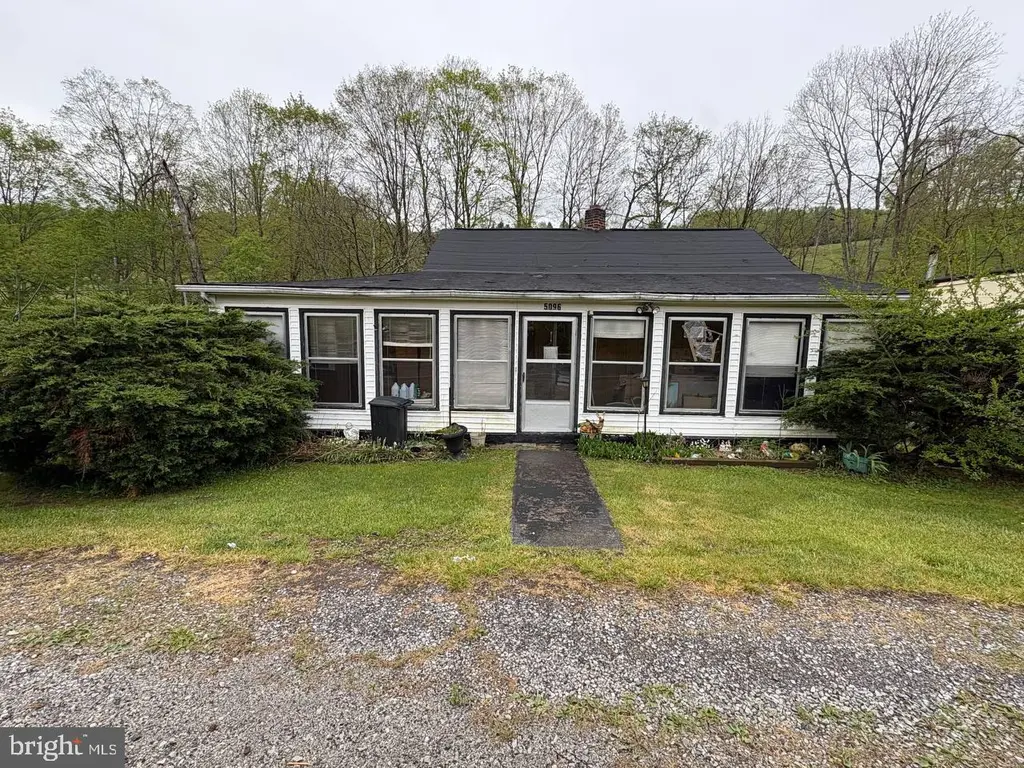
5096 E Blue Grass Trl · Bland, VA
Flood risk 10/10 · Severe
- FEMA flood zone
- X (unshaded)
- Chance of flooding over 30 yrs
- 0.99%
- Est. flood insurance / yr
- $473 – $860
Fire risk 6/10 · Moderate
- Est. fire insurance / yr
- $666 – $1,236
Heat risk 3/10 · Minor
- Hot days now (above 92°F)
- 8 days/yr
- Hot days in 30 yrs
- 22 days/yr
Wind risk 2/10 · Minimal
- Chance of severe wind over 30 yrs
- 1.0%
Air-quality risk 1/10 · Minimal
- Unhealthy air days now
- 0 days/yr
- Unhealthy air days in 30 yrs
- 0 days/yr
Risk factors via First Street. Map © Google.
Why this score? — see what drove the B+ grade
The composite is a weighted blend of 9 inputs, each scored 0–100. Each bar is that input's sub-score; the figure is the points it added to the 100-point composite (weight × sub-score).
- Cash flow +30.0/30.0
- 1% rule +10.0/10.0
- DSCR +10.0/10.0
- Appreciation +7.7/10.0
- ARV discount +7.5/15.0
- Schools +6.0/10.0
- Livability +3.6/5.0
- Rent growth +2.5/5.0
- Condition / age +2.5/5.0
$49,990
🖨 Deal sheet 📄 Offer letter ✓ Due diligence
Listing remarks
Charming rural retreat located on E Blue Grass Trail in scenic Bland County, Virginia. This 2-bedroom home offers a peaceful country setting with plenty of space to enjoy the outdoors. The property includes an additional trailer, perfect for storage, workshop use, or flexible utility space. Situated on a generous parcel, the land provides privacy, room for recreation, gardening, or expansion. Ideal for those seeking quiet living with convenient access to the Town of Bland and I-77. Whether you're looking for a full-time residence, weekend getaway, or investment opportunity, this property delivers the simplicity and charm of Southwest Virginia living. Property is being sold as-is; buyer to p
Key facts
- 1 acre lot
- Built 1948
- Listed 43 days
Property features AI
Finance
- Financial info: Tax assessed value reported (financial details available)
Exterior
- Parking: Driveway
- Utilities: Well water; Private sewer
- Home design: Fee simple ownership; Year built estimated
- Exterior features: No tidal water reported; Other above-grade structures
Interior
- Bedrooms: 2 bedrooms on the main level
- Bathrooms: 1 full bathroom on the main level
- Heating & cooling: Baseboard electric heating; Central air conditioning; Electric hot water
- Interior features: Estimated living area; Basement present (other type)
Neighborhood map
What this means for you Summary
Snapshot
- This is a 2-bed/1.0-bath single-family listed at $50k.
Deal economics
- At list price, monthly cash flow is $374 ($4k/yr) — positive.
- The deal already cash-flows at list — no discount required.
- Meets the 1% rule at list price ($939 rent vs $50k).
- Recommended offer: $48k (3.0% below list) — sets the bar for market timing.
Location & tenants
- Location reads 72/100 on livability (#202 in VA) — a middle-class / working-renter tenant base. Strengths: schools A+, cost of living A+, housing A+; Watch: crime D+, employment D+, amenities F.
- Bland County Public School District (rural): math 62% / reading 80% proficiency, ranked #23 of 131 in VA (top 18%) — strong family-tenant draw, lease renewals of 3-5y typical.
- Market conditions: 21 active listings in the ZIP; 8 units permitted in Bland County in 2024 (0 in 5+ unit buildings).
Forward outlook
- In year one you build about $3k of equity ($346 loan paydown + $3k appreciation (5.3% local appreciation)).
- Bland County population projected at -20% by 2050 — secular population decline; favor cash flow + early exit over multi-decade hold.
- At projected returns (5.3% appreciation + 3.0% rent growth), your $14k cash investment doubles in ~2 years — after that, you're playing with house money.
- By year 10, paydown + projected appreciation supports a ~$30k cash-out refi (75% LTV) — recoverable capital for the next deal without selling this one.
Negotiation context
- It's been on market 44 days — a 3% lower offer ($48k) is reasonable based on typical stale-listing flexibility.
Risks & watch-outs
- Watch-outs: flood insurance adds $56/mo; built in 1948 — expect roof / HVAC / electrical / plumbing capex.
- Climate carrying-cost: severe flood risk; major wildfire risk — expect insurance premiums to compound above CPI over the hold.
Questions for the listing agent
- It's been on market 44 days. Have you received any prior offers? Is the seller open to a 3% concession, seller financing, or rate buy-down credit?
- Built in 1948 — when were the roof, HVAC, electrical panel, plumbing, and water heater last replaced?
- What's the actual annual flood-insurance premium (NFIP or private), and is the property in a SFHA with mandatory coverage?
- Is there a deadline driving the sale (1031 exchange, divorce, estate, relocation)? That informs how much negotiation room exists.
- Schools are A-rated — typically a magnet for longer-tenancy family renters. What's the average tenant stay here, and is there a school-zone premium baked into asking?
- Crime grade is D in this area — have there been break-ins, vandalism, or insurance claims at this property in the last 3 years? What carrier currently insures it and at what premium?
- What's the average days-on-market for RENTAL listings here right now (not sales)? A rising rental-DOM trend means longer vacancies and softer asking-rent achievability than the comps imply.
- What's the recent tenant-quality profile in this submarket — average credit score on applications, eviction rate, late-payment / NSF rate, and stable-employment percentage? A property-management company in the area should have these aggregated.
- How much new for-sale + rental construction is in the pipeline within 1–3 miles? Heavy new supply typically softens prices + rents 12–24 months out; constrained supply supports both.
Investment metrics
- 1% rule
- 1.88% ✓
- Cap rate
- 16.62%
- Cash-on-cash
- 36.87%
- DSCR
- 2.64
- GRM
- 4.4
CMA / ARV
No comps found within radius.
Projected returns pro-forma
5.3% appreciation · 3.0% rent growth · sell at horizon
- IRR
- 41.6%
- Equity multiple
- 3.59×
- Total profit
- $36,273
- Equity at exit
- $29,257
- IRR
- 39.4%
- Equity multiple
- 7.34×
- Total profit
- $88,702
- Equity at exit
- $51,278
Cash invested: $13,997 (down + closing). Projections, not guarantees.
Landlord ↔ Tenant lean methodology
- Overall (STATE)
- 55 Moderately Landlord-Leaning
- State Virginia
- 55 Moderately Landlord-Leaning · D+2
- County
- — inherits STATE
- City
- — inherits STATE
ZIP-level market 24315
- Home prices YoY
- 3.3%
- Active inventory
- 21
- Price-to-rent
- 4.4×
Monthly cashflow live
- Estimated rent
- $939 medium interval (Pro) →
- Mortgage (P&I)
- −$262
- Tax from tax record
- −$28 /mo · $342/yr
- Insurance
- −$21
- Flood insurance flood zone
- −$56 /mo · $666/yr
- HOA
- −$0
- Vacancy / Maint / Mgmt
- −$197
- Net cashflow
- $374
Break-even live
UW: 25.0% down · 7.5% · 30yr · 1.5% tax · 5.0% vac · 8.0% maint · 8.0% mgmt
Financing live
Cash to close
- Down payment
- $12,498
- Closing costs
- $1,500
- Reserves months
- —
- Total cash needed
- —
Loan-product check · same deal, 3 products live
Conventional
25% down · 7.5% · 30yr
- Down + closing
- —
- Monthly P&I
- —
- Monthly cashflow
- —
- DSCR
- —
- Eligible?
- —
Personal DTI + credit; lowest rate.
DSCR
20% down · 8.5% · 30yr
- Down + closing
- —
- Monthly P&I
- —
- Monthly cashflow
- —
- DSCR
- —
- Eligible?
- —
No personal income docs; deal must DSCR.
Hard money
10% down · 12.0% · 12mo
- Down + closing
- —
- Monthly P&I
- —
- Monthly cashflow
- —
- DSCR
- —
- Eligible?
- —
Short-term bridge; refi at stabilization.
Listing history 17 events
-
2026-06-19days on market $49,990 Active 44 DOM
-
2026-06-18days on market $49,990 Active 43 DOM
-
2026-06-17days on market $49,990 Active 42 DOM
-
2026-06-16days on market $49,990 Active 41 DOM
-
2026-06-15days on market $49,990 Active 40 DOM
-
2026-06-14days on market $49,990 Active 38 DOM
-
2026-06-12days on market $49,990 Active 37 DOM
-
2026-06-09days on market $49,990 Active 34 DOM
-
2026-06-08days on market $49,990 Active 33 DOM
-
2026-06-07days on market $49,990 Active 32 DOM
-
2026-06-05days on market $49,990 Active 29 DOM
-
2026-06-03days on market $49,990 Active 28 DOM
-
2026-06-02days on market $49,990 Active 27 DOM
-
2026-06-01days on market $49,990 Active 26 DOM
-
2026-05-31days on market $49,990 Active 25 DOM
-
2026-05-30days on market $49,990 Active 24 DOM
-
2026-05-06$60,000 Active 840-char remark
ⓘ Source: listings_history table (triggers on properties + properties_extension) + one-shot
backfill from property_details.listing_events for pre-trigger history.
Tax reassessment forecast VA · Resets to sale price
- Current annual tax
- $342 · $28/mo
- Projected year-2 tax
- $410 · $34/mo
- Expected delta
- +$68/yr (+$6/mo · 19.9%)
ⓘ Screening estimate from a state-policy table — verify with the county assessor before closing.
Climate risk First Street
- Flood 10/10 Extreme FEMA zone X (unshaded) · 99% chance over 30 yrs
- Wildfire 6/10 Major
- Heat 3/10 Moderate 8 d/yr ≥92°F today · 22 d/yr by 30 yrs out
- Wind 2/10 Low 100% chance of damaging wind over 30 yrs
- Air quality 1/10 Low 0 unhealthy d/yr today · 0 by 30 yrs out
Nearby sold comps map
Loading sold comps map…
Walkable amenities ~0.75 mi
Loading nearby amenities…
Taxation est. · year 1
- Rental income
- $11,264
- − Mortgage interest
- −$2,800
- − Property taxes
- −$342
- − Insurance
- −$916
- − Repairs & maintenance
- −$901
- − Management
- −$901
- − Depreciation
- −$1,454
- Taxable income
- $3,948
- Est. tax owed @ 24.0%
- −$948
- After-tax cash flow
- $3,546/yr
For passive investors: Depreciation is non-cash, so a rental often shows a tax loss while cash-flowing — sheltering income. Rental losses are passive: they offset passive income freely, and up to $25,000/yr can offset ordinary (W-2) income if you actively participate and your MAGI is under $100k (phasing out to $0 by $150k); unused losses carry forward. On sale, claimed depreciation is recaptured at up to 25%, and gains may owe capital-gains tax (a 1031 exchange can defer both). Figures are a year-1 estimate at your 24.0% rate — not tax advice; consult a CPA.
Schools (NCES district)
- District
- Bland County Public School District
- NCES district ID
- 5100390
- Math proficiency
- 62% ▼ -25.00%
- Reading proficiency
- 80% ▬ 0.00%
- Median HH income
- $44,048
- Composite
- 59.56/100
- National rank
- #917
- State rank
- #23 of 131 in VA
Livability — Bland
- Score
- 72/100
- State rank
- #202
- US rank
- #6245
Category grades
Schools grade is shown separately in the Schools card above.
Census & demographics
- Population (ZIP)
- 3,789
Population outlook (Bland County) Hauer SSP2
- Today (2025)
- 6,172 people
- By 2030
- 5,928 · -4.0%
- By 2040
- 5,402 · -12.5%
- By 2050
- 4,926 · -20.2%
- By 2075
- 4,051 · -34.4%
- By 2100
- 3,028 · -50.9%
Race, ethnicity, and origin ACS 2023
- Neighborhood character
- Predominantly White (91%)
- Race & ethnicity
- White 91% Black 6% Two or more races 2% Hispanic / Latino 1%
- Common ancestry
- Serbian 2% Slovak 1% Lithuanian 1%
- Foreign-born
- 0%
- Languages at home
- 97% English-only · Spanish 2%
Political lean MEDSL · Bland
- 2024 margin
- Solid R (+69.7) · D 14.8% · R 84.5%
- 2008→2024 swing
- -30.3pp toward R · 2008: -39.4pp · 2024: -69.7pp
- All cycles
- 2024: R+69.7 2020: R+68.2 2016: R+67.8 2012: R+48.0 2008: R+39.4
Not yet ingested
- Civics
- —
Market trends
- HPI YoY
- ▲ 5.30%
- Current HPI
- 166.2616
- Rent YoY
- —
- Metro
- —
- State GDP YoY
- ▲ 2.40%
- F500 in state
- 50
Industry mix (Fortune 500 HQ in VA)
| Industry | F500 HQs | Revenue |
|---|---|---|
| Aerospace / Defense | 4 | $236B |
|
||
| Technology / Defense | 3 | $32B |
|
||
| Financial Services | 2 | $176B |
|
||
| Utilities | 2 | $27B |
|
||
| Insurance | 2 | $25B |
|
||
| Technology | 2 | $15B |
|
||
Price history
-16.7% since first listed2 events — show timeline
- 2026-05-28 Price Changed $49,990 BRIGHT MLS
- 2026-05-06 Listed $60,000 BRIGHT MLS
Property tax history
-0.8%/yrLatest (2025): $342 · +0.0% YoY. Source: county tax records.
Cash-flow waterfall
monthlySold comps — $/sqft
last 12 mo · ≤1 miLoading sold comps…