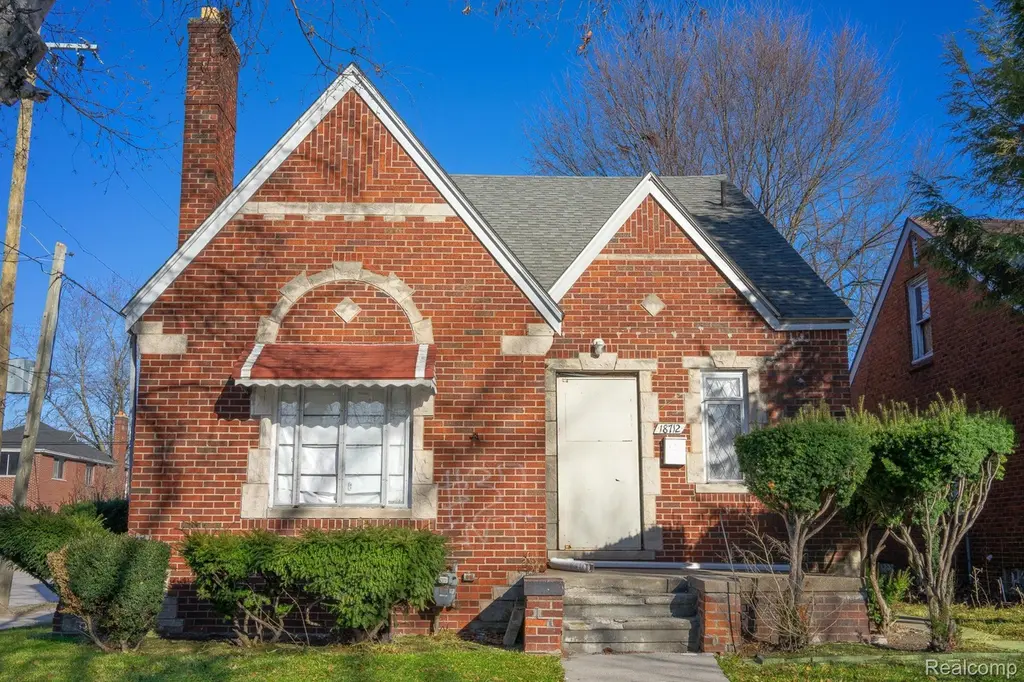
18712 Waltham St · Detroit, MI
Flood risk 1/10 · Minimal
- FEMA flood zone
- X (unshaded)
- Chance of flooding over 30 yrs
- 0.0%
- Est. flood insurance / yr
- $507 – $1,088
Fire risk 1/10 · Minimal
- Est. fire insurance / yr
- $784 – $1,456
Heat risk 3/10 · Minor
- Hot days now (above 96°F)
- 7 days/yr
- Hot days in 30 yrs
- 15 days/yr
Wind risk 2/10 · Minimal
- Chance of severe wind over 30 yrs
- —
Air-quality risk 3/10 · Minor
- Unhealthy air days now
- 2 days/yr
- Unhealthy air days in 30 yrs
- 5 days/yr
Risk factors via First Street. Map © Google.
Why this score? — see what drove the C+ grade
The composite is a weighted blend of 9 inputs, each scored 0–100. Each bar is that input's sub-score; the figure is the points it added to the 100-point composite (weight × sub-score).
- Cash flow +30.0/30.0
- 1% rule +10.0/10.0
- DSCR +10.0/10.0
- ARV discount +4.3/15.0
- Livability +3.7/5.0
- Rent growth +2.8/5.0
- Condition / age +2.5/5.0
- Schools +1.3/10.0
- Appreciation +0.0/10.0
$65,000
🖨 Deal sheet 📄 Offer letter ✓ Due diligence
Listing remarks MLS
A blank canvas ready to be brought to life, this generously sized home is full of potential and possibility. Perfect for investors seeking their next project or a hands-on homeowner ready to create something truly their own, this property is all about vision and upside. Ideally located near major highways, schools, parks, and shopping, it offers convenience without compromise. With the right touch, this could be something special—schedule your private showing and imagine what it can become. Purchaser to pay 395 processing fee. As-is sale. SELLER FINANCING / LAND CONTRACT TERMS AVAILABLE AT 75,000 PURCHASE PRICE, 25,000 DOWN PAYMENT, 8% INTEREST, 84 MONTH TERM. 779 / MONTH. seller financing/land contract terms are negotiable.
Key facts
- 5,227 sq ft lot
- 2 garage spots
- Built 1939
Neighborhood map
What this means for you Summary
Snapshot
- This is a 3-bed/1.5-bath single-family listed at $65k.
Deal economics
- At list price, monthly cash flow is $649 ($8k/yr) — positive.
- The deal already cash-flows at list — no discount required.
- Meets the 1% rule at list price ($1k rent vs $65k).
- Recommended offer: $59k (9.0% below list) — sets the bar for market timing.
- Cap rate 18.3% vs local median 10.2% in Detroit — top-decile yield for the area; either an underpriced asset or a hidden risk that comps aren't pricing in. Stress-test before assuming the spread holds.
Location & tenants
- Location reads 73/100 on livability (#218 in MI) — a middle-class / working-renter tenant base. Strengths: amenities A+, commute A+, cost of living A+; Watch: schools F, crime F, employment F.
- Detroit Public Schools Community District (urban): math 10% / reading 24% proficiency, ranked #499 of 540 in MI (top 92%) — low school quality limits family demand, transient renter base, plan for 1-2y turnover; 90% free/reduced lunch — lower-income household profile, screen leases tightly.
- Market conditions: Rents rising (+1.3%/yr); 373 active listings in the ZIP; 22 comparable units currently listed for rent nearby; rentals at typical pace (median 18d on market — plan ~3-4 weeks tenant-placement turnaround); lower-income renter base — watch delinquency; 2,639 units permitted in Wayne County in 2024 (1,216 in 5+ unit buildings).
- This rent runs 43% of the median local income ($39k/yr) — at the standard rent-burdened threshold; future hikes will face affordability resistance.
Forward outlook
- Local home prices are declining (-3.0%/yr); year-one equity from $449 of loan paydown is wiped out by about $2k of value loss. Plan a longer hold.
- Wayne County population projected at -17% by 2050 — secular population decline; favor cash flow + early exit over multi-decade hold.
- At projected returns (-3.0% appreciation + 1.3% rent growth), your $18k cash investment doubles in ~3 years — after that, you're playing with house money.
Negotiation context
- It's been on market 92 days — a 9% lower offer ($59k) is reasonable based on typical stale-listing flexibility.
- 4 sale attempts since 14y ago with the ask held roughly flat each time — persistent listings suggest the price (not the market) is what's stuck; bring a comps-based counter.
- Current owner paid $48k; 35% above their basis — modest negotiation headroom, anchor on the comps not their cost.
Risks & watch-outs
- Watch-outs: built in 1939 — expect roof / HVAC / electrical / plumbing capex.
Questions for the listing agent
- It's been on market 92 days. Have you received any prior offers? Is the seller open to a 9% concession, seller financing, or rate buy-down credit?
- Built in 1939 — when were the roof, HVAC, electrical panel, plumbing, and water heater last replaced?
- Why hasn't it sold? Are there any deal-killer items the seller is aware of (foundation, flood, title, zoning, code violations)?
- Is there a deadline driving the sale (1031 exchange, divorce, estate, relocation)? That informs how much negotiation room exists.
- Schools are F-rated, which usually means shorter tenancies and higher turnover. Who's the typical renter profile here, and what's been the actual vacancy rate?
- Crime grade is F in this area — have there been break-ins, vandalism, or insurance claims at this property in the last 3 years? What carrier currently insures it and at what premium?
- What's the average days-on-market for RENTAL listings here right now (not sales)? A rising rental-DOM trend means longer vacancies and softer asking-rent achievability than the comps imply.
- What's the recent tenant-quality profile in this submarket — average credit score on applications, eviction rate, late-payment / NSF rate, and stable-employment percentage? A property-management company in the area should have these aggregated.
- How much new for-sale + rental construction is in the pipeline within 1–3 miles? Heavy new supply typically softens prices + rents 12–24 months out; constrained supply supports both.
Investment metrics
- 1% rule
- 2.15% ✓
- Cap rate
- 18.27%
- Cash-on-cash
- 42.79%
- DSCR
- 2.90
- GRM
- 3.9
CMA / ARV
- ARV (median comp)
- $60,663
- List price
- $65,000
- Delta
- 7.15%
- Verdict
- FAIR
- Comps
- 20 within 1.0 mi
Show comp detail 12 sales within ~0.75 mi
| Address | Dist | Beds/Ba | Sqft | Sold | Price | $/sf | Match |
|---|---|---|---|---|---|---|---|
| 19591 Joann St | 0.53mi | 3/1.0 | 1,639 (-1%) | 9mo | $85,000 | $52 | 64 |
| 19738 Fairport St | 0.60mi | 3/1.0 | 1,716 (+3%) | 3mo | $75,000 | $44 | 62 |
| 19559 Pelkey St | 0.61mi | 4/2.0 (+1) | 1,765 (+6%) | 2mo | $27,700 | $16 | 52 |
| 19616 Goulburn St | 0.50mi | 3/2.0 | 1,850 (+11%) | 8mo | $115,000 | $62 | 49 |
| 19741 Waltham St | 0.57mi | 3/1.0 | 1,499 (-10%) | 10mo | $106,000 | $71 | 47 |
| 19920 Waltham St | 0.67mi | 3/1.0 | 1,776 (+7%) | 11mo | $55,000 | $31 | 46 |
| 13351 Tacoma St | 0.69mi | 2/1.0 (-1) | 1,521 (-8%) | 2mo | $95,000 | $62 | 45 |
| 12854 Hickory St | 0.69mi | 3/1.0 | 1,512 (-9%) | 8mo | $75,000 | $50 | 44 |
| 13707 Linnhurst St | 0.60mi | 4/1.0 (+1) | 1,500 (-10%) | 10mo | $38,000 | $25 | 41 |
| 18939 Teppert St | 0.73mi | 3/1.5 | 1,468 (-12%) | 9mo | $50,000 | $34 | 39 |
| 17841 Hoover St | 0.70mi | 3/1.0 | 1,906 (+15%) | 8mo | $70,000 | $37 | 34 |
| 13417 Tacoma St | 0.70mi | 2/2.0 (-1) | 1,834 (+10%) | 11mo | $40,000 | $22 | 34 |
Match score weights: distance 35% · size 25% · config 20% · recency 20%. Top-matched comps best support the ARV.
Projected returns pro-forma
-3.0% appreciation · 1.33% rent growth · sell at horizon
- IRR
- 37.7%
- Equity multiple
- 2.57×
- Total profit
- $28,511
- Equity at exit
- $9,692
- IRR
- 43.4%
- Equity multiple
- 4.79×
- Total profit
- $68,973
- Equity at exit
- $5,620
Cash invested: $18,200 (down + closing). Projections, not guarantees.
Landlord ↔ Tenant lean methodology
- Overall (STATE)
- 62 Landlord-Friendly
- State Michigan
- 62 Landlord-Friendly · EVEN
- County
- — inherits STATE
- City
- — inherits STATE
ZIP-level market 48205
- Home prices YoY
- -28.1%
- Rents YoY
- 1.3%
- Active inventory
- 373
- Price-to-rent
- 3.9×
Monthly cashflow live
- Estimated rent
- $1,399 high interval (Pro) →
- Mortgage (P&I)
- −$341
- Tax from tax record
- −$89 /mo · $1,064/yr
- Insurance
- −$27
- HOA
- −$0
- Vacancy / Maint / Mgmt
- −$294
- Net cashflow
- $649
Break-even live
UW: 25.0% down · 7.5% · 30yr · 1.5% tax · 5.0% vac · 8.0% maint · 8.0% mgmt
Financing live
Cash to close
- Down payment
- $16,250
- Closing costs
- $1,950
- Reserves months
- —
- Total cash needed
- —
Loan-product check · same deal, 3 products live
Conventional
25% down · 7.5% · 30yr
- Down + closing
- —
- Monthly P&I
- —
- Monthly cashflow
- —
- DSCR
- —
- Eligible?
- —
Personal DTI + credit; lowest rate.
DSCR
20% down · 8.5% · 30yr
- Down + closing
- —
- Monthly P&I
- —
- Monthly cashflow
- —
- DSCR
- —
- Eligible?
- —
No personal income docs; deal must DSCR.
Hard money
10% down · 12.0% · 12mo
- Down + closing
- —
- Monthly P&I
- —
- Monthly cashflow
- —
- DSCR
- —
- Eligible?
- —
Short-term bridge; refi at stabilization.
Rent comps 22 comps
| Address | Beds | Baths | Sqft | Rent | $/sqft | DOM | Units | Dist |
|---|---|---|---|---|---|---|---|---|
| 19143 Fairport St Detroit, MI | 3.0 | 1.0 | 1070 | $1,225 | $1.14 | 17d | 1 | 0.21mi |
| 19207 Westphalia St Detroit, MI | 4.0 | 1.0 | 1179 | $1,800 | $1.53 | 17d | 1 | 0.24mi |
| 19419 Westphalia St Detroit, MI | 3.0 | 1.0 | 1293 | $1,325 | $1.02 | 17d | 1 | 0.37mi |
| 13218 Greiner St Detroit, MI | 3.0 | 1.0 | 1162 | $1,195 | $1.03 | 17d | 1 | 0.47mi |
| 19610 Westphalia St Detroit, MI | 3.0 | 1.0 | 1200 | $1,595 | $1.33 | 17d | 1 | 0.49mi |
| 17851 Strasburg St Detroit, MI | 3.0 | 1.0 | 1079 | $1,100 | $1.02 | 17d | 1 | 0.52mi |
| 18457 Hoover St Unit 57 Detroit, MI | 2.0 | 1.0 | 1950 | $850 | $0.44 | 14d | 1 | 0.59mi |
| 18947 Runyon St Detroit, MI | 3.0 | 1.0 | 1614 | $1,100 | $0.68 | 43d | 1 | 0.69mi |
| 18961 Teppert St Detroit, MI | 3.0 | 1.5 | 2015 | $1,250 | $0.62 | 12d | 1 | 0.75mi |
| 18431 Teppert St Detroit, MI | 4.0 | 1.0 | 1200 | $1,400 | $1.17 | 1d | 1 | 0.78mi |
| 17241 Rowe St Detroit, MI | 3.0 | 1.5 | 1316 | $1,450 | $1.10 | 17d | 1 | 0.87mi |
| 20290 Annott St Detroit, MI | 3.0 | 1.0 | 1300 | $1,250 | $0.96 | 17d | 1 | 1.04mi |
| 20553 Hamburg St Detroit, MI | 3.0 | 1.0 | 1074 | $1,300 | $1.21 | 3d | 1 | 1.07mi |
| 14481 Maddelein St Detroit, MI | 3.0 | 1.0 | 1200 | $1,100 | $0.92 | 43d | 1 | 1.07mi |
| 11785 Nashville St Detroit, MI | 3.0 | 2.0 | 1360 | $1,450 | $1.07 | 3d | 1 | 1.09mi |
| 13693 Edmore Dr Detroit, MI | 3.0 | 1.5 | 1269 | $1,550 | $1.22 | 11d | 1 | 1.10mi |
| 14504 Coram St Detroit, MI | 3.0 | 1.0 | 1203 | $1,175 | $0.98 | 24d | 1 | 1.12mi |
| 11760 Nashville St Detroit, MI | 3.0 | 1.0 | 1200 | $1,250 | $1.04 | 17d | 1 | 1.13mi |
| 14201 Mayfield St Detroit, MI | 4.0 | 1.5 | 1296 | $1,250 | $0.96 | 43d | 1 | 1.14mi |
| 12807 Coleen Ave Warren, MI | 3.0 | 1.0 | 1080 | $1,250 | $1.16 | 24d | 1 | 1.19mi |
| 14134 Collingham Dr Detroit, MI | 3.0 | 1.5 | 1300 | $1,350 | $1.04 | 43d | 1 | 1.32mi |
| 11074 Kennebec St Detroit, MI | 3.0 | 1.0 | 1200 | $1,350 | $1.12 | 43d | 1 | 1.36mi |
Listing history 21 events
-
2026-06-18days on market $65,000 Active 92 DOM
-
2026-06-17days on market $65,000 Active 91 DOM
-
2026-06-15days on market $65,000 Active 89 DOM
-
2026-06-13days on market $65,000 Active 87 DOM
-
2026-06-13days on market $65,000 Active 86 DOM
-
2026-06-09days on market $65,000 Active 83 DOM
-
2026-06-08days on market $65,000 Active 82 DOM
-
2026-06-07days on market $65,000 Active 81 DOM
-
2026-06-04days on market $65,000 Active 78 DOM
-
2026-06-03days on market $65,000 Active 77 DOM
-
2026-06-01days on market $65,000 Active 75 DOM
-
2026-05-31days on market $65,000 Active 74 DOM
-
2026-03-18$65,000 Active 740-char remark
Show marketing remark (736 chars)
A blank canvas ready to be brought to life, this generously sized home is full of potential and possibility. Perfect for investors seeking their next project or a hands-on homeowner ready to create something truly their own, this property is all about vision and upside. Ideally located near major highways, schools, parks, and shopping, it offers convenience without compromise. With the right touch, this could be something special - schedule your private showing and imagine what it can become. Purchaser to pay 395 processing fee. As-is sale. SELLER FINANCING / LAND CONTRACT TERMS AVAILABLE AT 75,000 PURCHASE PRICE, 25,000 DOWN PAYMENT, 8% INTEREST, 84 MONTH TERM. 779 / MONTH. seller financing/land contract terms are negotiable.
-
2026-03-18$65,000 Active 736-char remark
Show marketing remark (736 chars)
A blank canvas ready to be brought to life, this generously sized home is full of potential and possibility. Perfect for investors seeking their next project or a hands-on homeowner ready to create something truly their own, this property is all about vision and upside. Ideally located near major highways, schools, parks, and shopping, it offers convenience without compromise. With the right touch, this could be something special - schedule your private showing and imagine what it can become. Purchaser to pay 395 processing fee. As-is sale. SELLER FINANCING / LAND CONTRACT TERMS AVAILABLE AT 75,000 PURCHASE PRICE, 25,000 DOWN PAYMENT, 8% INTEREST, 84 MONTH TERM. 779 / MONTH. seller financing/land contract terms are negotiable.
-
2018-01-12soldstatus $48,000
-
2012-10-25soldstatus $12,000
-
2012-10-25soldstatus $12,000
-
2012-10-05historical
-
2012-10-05historical
-
2012-07-29$15,000
-
2012-07-29$15,000
ⓘ Source: listings_history table (triggers on properties + properties_extension) + one-shot
backfill from property_details.listing_events for pre-trigger history.
Tax reassessment forecast MI · Partial reset (capped growth)
- Current annual tax
- $1,064 · $89/mo
- Projected year-2 tax
- $1,064 · $89/mo
- Expected delta
- $0/yr ($0/mo · 0.0%)
ⓘ Screening estimate from a state-policy table — verify with the county assessor before closing.
Climate risk First Street
- Flood 1/10 Low FEMA zone X (unshaded) · 0% chance over 30 yrs
- Wildfire 1/10 Low
- Heat 3/10 Moderate 7 d/yr ≥96°F today · 15 d/yr by 30 yrs out
- Wind 2/10 Low
- Air quality 3/10 Moderate 2 unhealthy d/yr today · 5 by 30 yrs out
Nearby sold comps map
Loading sold comps map…
Walkable amenities ~0.75 mi
Loading nearby amenities…
Taxation est. · year 1
- Rental income
- $16,794
- − Mortgage interest
- −$3,641
- − Property taxes
- −$1,064
- − Insurance
- −$325
- − Repairs & maintenance
- −$1,343
- − Management
- −$1,343
- − Depreciation
- −$1,891
- Taxable income
- $7,185
- Est. tax owed @ 24.0%
- −$1,725
- After-tax cash flow
- $6,063/yr
For passive investors: Depreciation is non-cash, so a rental often shows a tax loss while cash-flowing — sheltering income. Rental losses are passive: they offset passive income freely, and up to $25,000/yr can offset ordinary (W-2) income if you actively participate and your MAGI is under $100k (phasing out to $0 by $150k); unused losses carry forward. On sale, claimed depreciation is recaptured at up to 25%, and gains may owe capital-gains tax (a 1031 exchange can defer both). Figures are a year-1 estimate at your 24.0% rate — not tax advice; consult a CPA.
Schools (NCES district)
- District
- Detroit Public Schools Community District
- NCES district ID
- 2601103
- Math proficiency
- 10% ▼ -2.00%
- Reading proficiency
- 24% ▲ 6.00%
- Median HH income
- $25,815
- Composite
- 13.06/100
- National rank
- #9564
- State rank
- #499 of 540 in MI
Livability — Detroit
- Score
- 73/100
- State rank
- #218
- US rank
- #5427
Category grades
Schools grade is shown separately in the Schools card above.
Census & demographics
- Census place
- Detroit, MI
- County
- Wayne County · 1,562,939 people
- City population
- 572,865
- Metro
- Detroit-Warren-Dearborn, MI
- Population (ZIP)
- 34,187
- Household income
- $38,966
- Rent vs Own
- Severe rent burden
- 2121.0
Population outlook (Wayne County) Hauer SSP2
- Today (2025)
- 1,675,273 people
- By 2030
- 1,620,300 · -3.3%
- By 2040
- 1,502,341 · -10.3%
- By 2050
- 1,384,039 · -17.4%
- By 2075
- 1,124,592 · -32.9%
- By 2100
- 881,193 · -47.4%
Race, ethnicity, and origin ACS 2023
- Neighborhood character
- Predominantly Black (93%)
- Race & ethnicity
- Black 93% White 3% Two or more races 2%
- Foreign-born
- 1% · Canada
- Languages at home
- 98% English-only · Spanish 1%
Political lean MEDSL · Wayne
- 2024 margin
- Strong D (+29.0) · D 62.7% · R 33.7% · Other 3.6%
- 2008→2024 swing
- -20.5pp toward R · 2008: 49.5pp · 2024: 29.0pp
- All cycles
- 2024: D+29.0 2020: D+38.1 2016: D+37.3 2012: D+46.9 2008: D+49.5
Not yet ingested
- Civics
- —
Market trends
- HPI YoY
- ▼ -91.80%
- Current HPI
- 235.0926
- Rent YoY
- ▲ 1.33%
- Metro
- Detroit-Warren-Dearborn, MI
- State GDP YoY
- ▲ 1.37%
- F500 in state
- 28
Industry mix (Fortune 500 HQ in MI)
| Industry | F500 HQs | Revenue |
|---|---|---|
| Automotive Parts | 3 | $48B |
|
||
| Automotive | 2 | $372B |
|
||
| Chemicals | 1 | $45B |
|
||
| Automotive Retail | 1 | $29B |
|
||
| Healthcare / Medical Devices | 1 | $23B |
|
||
| Automotive Technology | 1 | $20B |
|
||
Price history
+333.3% since first listed9 events — show timeline
- 2026-03-18 Listed $65,000 REALCOMP
- 2026-03-18 Listed $65,000 MiRealSource-MiMLS
- 2018-01-12 Sold (Public Records) $48,000 Public Records
- 2012-10-25 Sold (MLS) $12,000 MiRealSource-MiMLS
- 2012-10-25 Sold (MLS) $12,000 REALCOMP
- 2012-10-05 Listing Removed — MiRealSource-MiMLS
- 2012-10-05 Listing Removed — REALCOMP
- 2012-07-29 Listed $15,000 MiRealSource-MiMLS
- 2012-07-29 Listed $15,000 REALCOMP
Property tax history
-5.2%/yrLatest (2025): $1,064 · -53.8% YoY. Source: county tax records.
Cash-flow waterfall
monthlySold comps — $/sqft
last 12 mo · ≤1 miLoading sold comps…