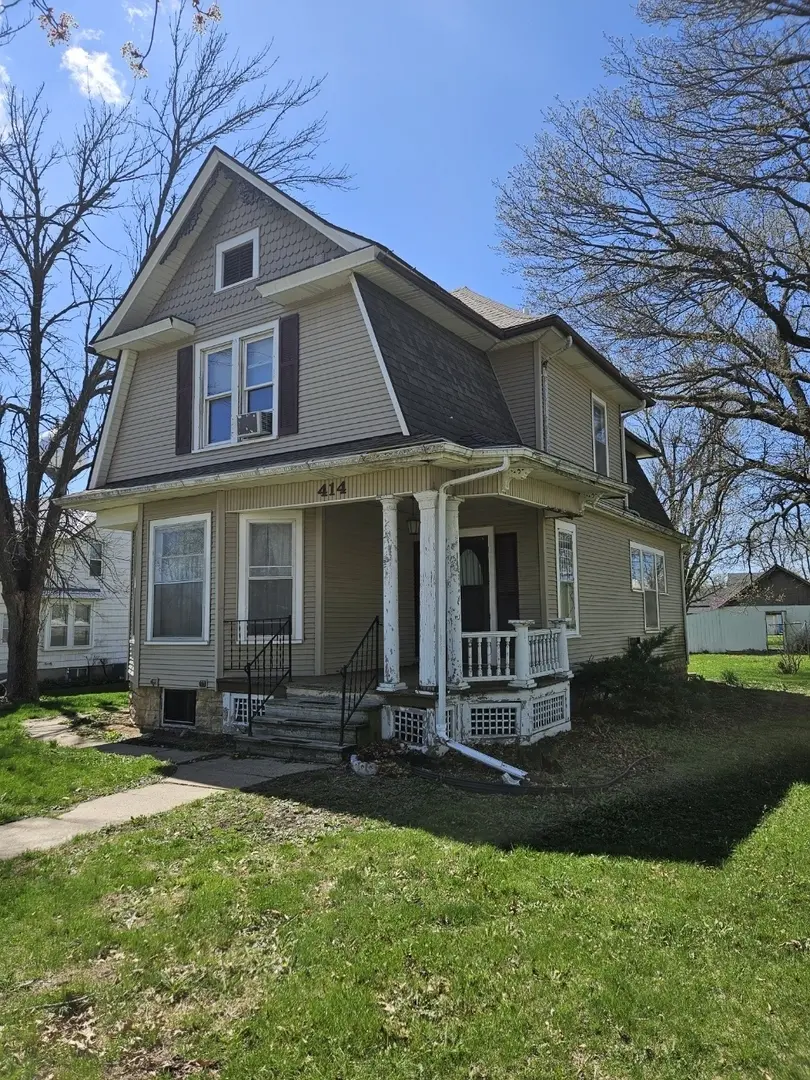
414 6th Ave · Clarence, IA
Flood risk 1/10 · Minimal
- FEMA flood zone
- X (unshaded)
- Chance of flooding over 30 yrs
- 0.0%
- Est. flood insurance / yr
- $473 – $860
Fire risk 1/10 · Minimal
- Est. fire insurance / yr
- $902 – $1,676
Heat risk 3/10 · Minor
- Hot days now (above 102°F)
- 7 days/yr
- Hot days in 30 yrs
- 15 days/yr
Wind risk 2/10 · Minimal
- Chance of severe wind over 30 yrs
- —
Air-quality risk 2/10 · Minimal
- Unhealthy air days now
- 1 days/yr
- Unhealthy air days in 30 yrs
- 2 days/yr
Risk factors via First Street. Map © Google.
Why this score? — see what drove the B grade
The composite is a weighted blend of 9 inputs, each scored 0–100. Each bar is that input's sub-score; the figure is the points it added to the 100-point composite (weight × sub-score).
- Cash flow +26.7/30.0
- ARV discount +15.0/15.0
- DSCR +9.2/10.0
- 1% rule +7.2/10.0
- Schools +5.3/10.0
- Livability +3.8/5.0
- Rent growth +2.5/5.0
- Condition / age +2.5/5.0
- Appreciation +0.0/10.0
$99,900
🖨 Deal sheet (PDF) 📄 Offer letter ✓ Due diligence
Listing remarks MLS
This charming two-story home at 414 6th Ave blends timeless character with everyday comfort in the heart of Clarence. Featuring classic Folk Victorian influences, the home showcases a welcoming front porch, a distinctive bay window, and a beautifully balanced yet asymmetrical facade. Inside, you'll find spacious living areas filled with natural light, offering both functionality and warmth for daily living. The upper level provides comfortable bedrooms with charming architectural details, while the main floor offers flexible space for gathering and entertaining. Situated on a generous lot with mature trees and a well-kept yard, the property provides a peaceful small-town setting while remaining conveniently located. This home is a perfect blend of historic charm and livable space, ideal for those seeking character and comfort and offers a lot of opportunity for you to make it your own! THIS PROPERTY IS BEING SOLD "AS-IS".
Key facts
- Generous lot
- Mature trees
- 0.27 acre lot
Tags
Neighborhood map
What this means for you Summary
Snapshot
- This is a 3-bed/1.5-bath single-family listed at $100k.
Deal economics
- At list price, monthly cash flow is $271 ($3k/yr) — positive.
- The deal already cash-flows at list — no discount required.
- Meets the 1% rule at list price ($1k rent vs $100k).
- Recommended offer: $94k (6.0% below list) — sets the bar for market timing.
Location & tenants
- Location reads 75/100 on livability (#212 in IA, #3,902 nationally) — a middle-class / working-renter tenant base. Strengths: crime A+, cost of living A+, housing A+; Watch: amenities F, commute F.
- North Cedar Community School District (rural): math 61% / reading 63% proficiency, ranked #219 of 289 in IA (top 76%) — acceptable for families but not a draw, mixed tenant base, ~2y average lease.
- Market conditions: 9 active listings in the ZIP; 89 units permitted in Cedar County in 2024 (40 in 5+ unit buildings).
Forward outlook
- Local home prices are declining (-3.0%/yr); year-one equity from $691 of loan paydown is wiped out by about $3k of value loss. Plan a longer hold.
- Cedar County population projected to shrink 9% by 2050 — rents likely to lag national; underwrite the cash flow, not the appreciation.
- At projected returns (-3.0% appreciation + 3.0% rent growth), your $28k cash investment doubles in ~10 years — after that, you're playing with house money.
Negotiation context
- It's been on market 64 days — a 6% lower offer ($94k) is reasonable based on typical stale-listing flexibility.
Risks & watch-outs
- Watch-outs: built in 1908 — expect roof / HVAC / electrical / plumbing capex.
Questions for the listing agent
- It's been on market 64 days. Have you received any prior offers? Is the seller open to a 6% concession, seller financing, or rate buy-down credit?
- Built in 1908 — when were the roof, HVAC, electrical panel, plumbing, and water heater last replaced?
- Why hasn't it sold? Are there any deal-killer items the seller is aware of (foundation, flood, title, zoning, code violations)?
- Is there a deadline driving the sale (1031 exchange, divorce, estate, relocation)? That informs how much negotiation room exists.
- Schools are B-rated — typically a magnet for longer-tenancy family renters. What's the average tenant stay here, and is there a school-zone premium baked into asking?
- What's the average days-on-market for RENTAL listings here right now (not sales)? A rising rental-DOM trend means longer vacancies and softer asking-rent achievability than the comps imply.
- What's the recent tenant-quality profile in this submarket — average credit score on applications, eviction rate, late-payment / NSF rate, and stable-employment percentage? A property-management company in the area should have these aggregated.
- How much new for-sale + rental construction is in the pipeline within 1–3 miles? Heavy new supply typically softens prices + rents 12–24 months out; constrained supply supports both.
Investment metrics
- 1% rule
- 1.22% ✓
- Cap rate
- 9.55%
- Cash-on-cash
- 11.62%
- DSCR
- 1.52
- GRM
- 6.8
CMA / ARV
- ARV (median comp)
- $173,167
- List price
- $99,900
- Delta
- -42.31%
- Verdict
- UNDERPRICED
- Comps
- 20 within 1.0 mi
Show comp detail 6 sales within ~0.75 mi
| Address | Dist | Beds/Ba | Sqft | Sold | Price | $/sf | Match |
|---|---|---|---|---|---|---|---|
| 412 5th Ave | 0.09mi | 3/2.0 | 1,968 (+3%) | 4mo | $165,000 | $84 | 86 |
| 516 9th Ave Ave | 0.30mi | 3/2.0 | 1,856 (-3%) | 14mo | $200,000 | $108 | 68 |
| 306 7th Ave | 0.19mi | 2/2.0 (-1) | 1,696 (-11%) | 10mo | $170,000 | $100 | 57 |
| 115 Ball Street St | 0.31mi | 2/2.0 (-1) | 1,881 (-2%) | 24mo | $180,000 | $96 | 56 |
| 116 Ball Street St | 0.29mi | 4/2.0 (+1) | 2,124 (+11%) | 6mo | $312,500 | $147 | 55 |
| 401 8th Ave | 0.23mi | 2/1.0 (-1) | 1,630 (-15%) | 13mo | $140,000 | $86 | 47 |
Match score weights: distance 35% · size 25% · config 20% · recency 20%. Top-matched comps best support the ARV.
Projected returns pro-forma
-3.0% appreciation · 3.0% rent growth · sell at horizon
- IRR
- 1.0%
- Equity multiple
- 1.04×
- Total profit
- $1,085
- Equity at exit
- $14,895
- IRR
- 10.7%
- Equity multiple
- 1.83×
- Total profit
- $23,241
- Equity at exit
- $8,638
Cash invested: $27,972 (down + closing). Projections, not guarantees.
Landlord ↔ Tenant lean methodology
- Overall (STATE)
- 83 Strongly Landlord-Friendly
- State Iowa
- 83 Strongly Landlord-Friendly · R+6
- County
- — inherits STATE
- City
- — inherits STATE
ZIP-level market 52216
- Home prices YoY
- -21.9%
- Active inventory
- 9
- Price-to-rent
- 6.8×
Monthly cashflow live
- Estimated rent
- $1,219 medium interval (Pro) →
- Mortgage (P&I)
- −$524
- Tax from tax record
- −$126 /mo · $1,518/yr
- Insurance
- −$42
- HOA
- −$0
- Vacancy / Maint / Mgmt
- −$256
- Net cashflow
- $271
Break-even live
Sensitivity live
| Price | -10% $327 | -5% $299 | +0% $271 | +5% $243 | +10% $214 |
|---|---|---|---|---|---|
| Rent | -10% $175 | -5% $223 | +0% $271 | +5% $319 | +10% $367 |
| Rate | -1.0pp $321 | -0.5pp $296 | base $271 | +0.5pp $245 | +1.0pp $219 |
UW: 25.0% down · 7.5% · 30yr · 1.5% tax · 5.0% vac · 8.0% maint · 8.0% mgmt
Financing live
Cash to close
- Down payment
- $24,975
- Closing costs
- $2,997
- Reserves months
- —
- Total cash needed
- —
Loan-product check · same deal, 3 products live
Conventional
25% down · 7.5% · 30yr
- Down + closing
- —
- Monthly P&I
- —
- Monthly cashflow
- —
- DSCR
- —
- Eligible?
- —
Personal DTI + credit; lowest rate.
DSCR
20% down · 8.5% · 30yr
- Down + closing
- —
- Monthly P&I
- —
- Monthly cashflow
- —
- DSCR
- —
- Eligible?
- —
No personal income docs; deal must DSCR.
Hard money
10% down · 12.0% · 12mo
- Down + closing
- —
- Monthly P&I
- —
- Monthly cashflow
- —
- DSCR
- —
- Eligible?
- —
Short-term bridge; refi at stabilization.
Listing history 19 events
-
2026-06-21days on market $99,900 Active 64 DOM
-
2026-06-18days on market $99,900 Active 62 DOM
-
2026-06-17price $99,900 Active 61 DOM
-
2026-06-17days on market $109,900 Active 61 DOM
-
2026-06-16days on market $109,900 Active 60 DOM
-
2026-06-15days on market $109,900 Active 59 DOM
-
2026-06-13days on market $109,900 Active 57 DOM
-
2026-06-12days on market $109,900 Active 56 DOM
-
2026-06-09days on market $109,900 Active 53 DOM
-
2026-06-08days on market $109,900 Active 52 DOM
-
2026-06-07days on market $109,900 Active 51 DOM
-
2026-06-07days on market $109,900 Active 50 DOM
-
2026-06-04days on market $109,900 Active 47 DOM
-
2026-06-02days on market $109,900 Active 46 DOM
-
2026-06-01days on market $109,900 Active 45 DOM
-
2026-05-31days on market $109,900 Active 44 DOM
-
2026-05-31days on market $109,900 Active 43 DOM
-
2026-05-15price $109,900 946-char remark
Show marketing remark (946 chars)
This charming two-story home at 414 6th Ave blends timeless character with everyday comfort in the heart of Clarence. Featuring classic Folk Victorian influences, the home showcases a welcoming front porch, a distinctive bay window, and a beautifully balanced yet asymmetrical facade. Inside, you'll find spacious living areas filled with natural light, offering both functionality and warmth for daily living. The upper level provides comfortable bedrooms with charming architectural details, while the main floor offers flexible space for gathering and entertaining. Situated on a generous lot with mature trees and a well-kept yard, the property provides a peaceful small-town setting while remaining conveniently located. This home is a perfect blend of historic charm and livable space, ideal for those seeking character and comfort and offers a lot of opportunity for you to make it your own! THIS PROPERTY IS BEING SOLD "AS-IS".
-
2026-04-17$120,000 Active 946-char remark
Show marketing remark (946 chars)
This charming two-story home at 414 6th Ave blends timeless character with everyday comfort in the heart of Clarence. Featuring classic Folk Victorian influences, the home showcases a welcoming front porch, a distinctive bay window, and a beautifully balanced yet asymmetrical facade. Inside, you'll find spacious living areas filled with natural light, offering both functionality and warmth for daily living. The upper level provides comfortable bedrooms with charming architectural details, while the main floor offers flexible space for gathering and entertaining. Situated on a generous lot with mature trees and a well-kept yard, the property provides a peaceful small-town setting while remaining conveniently located. This home is a perfect blend of historic charm and livable space, ideal for those seeking character and comfort and offers a lot of opportunity for you to make it your own! THIS PROPERTY IS BEING SOLD "AS-IS".
ⓘ Source: listings_history table (triggers on properties + properties_extension) + one-shot
backfill from property_details.listing_events for pre-trigger history.
Tax reassessment forecast IA · Partial reset (capped growth)
- Current annual tax
- $1,518 · $126/mo
- Projected year-2 tax
- $1,543 · $129/mo
- Expected delta
- +$25/yr (+$2/mo · 1.7%)
ⓘ Screening estimate from a state-policy table — verify with the county assessor before closing.
Climate risk First Street
- Flood 1/10 Low FEMA zone X (unshaded) · 0% chance over 30 yrs
- Wildfire 1/10 Low
- Heat 3/10 Moderate 7 d/yr ≥102°F today · 15 d/yr by 30 yrs out
- Wind 2/10 Low
- Air quality 2/10 Low 1 unhealthy d/yr today · 2 by 30 yrs out
Nearby sold comps map
Loading sold comps map…
Walkable amenities ~0.75 mi
Loading nearby amenities…
Taxation est. · year 1
- Rental income
- $14,627
- − Mortgage interest
- −$5,596
- − Property taxes
- −$1,518
- − Insurance
- −$500
- − Repairs & maintenance
- −$1,170
- − Management
- −$1,170
- − Depreciation
- −$2,906
- Taxable income
- $1,767
- Est. tax owed @ 24.0%
- −$424
- After-tax cash flow
- $2,827/yr
For passive investors: Depreciation is non-cash, so a rental often shows a tax loss while cash-flowing — sheltering income. Rental losses are passive: they offset passive income freely, and up to $25,000/yr can offset ordinary (W-2) income if you actively participate and your MAGI is under $100k (phasing out to $0 by $150k); unused losses carry forward. On sale, claimed depreciation is recaptured at up to 25%, and gains may owe capital-gains tax (a 1031 exchange can defer both). Figures are a year-1 estimate at your 24.0% rate — not tax advice; consult a CPA.
Schools (NCES district)
- District
- North Cedar Community School District
- NCES district ID
- 1917100
- Math proficiency
- 61% ▼ -5.00%
- Reading proficiency
- 63% ▼ -7.00%
- Median HH income
- $54,549
- Composite
- 53.17/100
- National rank
- #1507
- State rank
- #219 of 289 in IA
Livability — Clarence
- Score
- 75/100
- State rank
- #212
- US rank
- #3902
Category grades
Schools grade is shown separately in the Schools card above.
Census & demographics
- Census place
- Clarence, IA
- Population (ZIP)
- 1,513
Population outlook (Cedar County) Hauer SSP2
- Today (2025)
- 18,416 people
- By 2030
- 18,294 · -0.7%
- By 2040
- 17,771 · -3.5%
- By 2050
- 16,841 · -8.6%
- By 2075
- 14,503 · -21.2%
- By 2100
- 11,301 · -38.6%
Race, ethnicity, and origin ACS 2023
- Neighborhood character
- Predominantly White (99%)
- Race & ethnicity
- White 99%
- Common ancestry
- Portuguese 2% Lithuanian 1% Italian 1%
Political lean MEDSL · Cedar
- 2024 margin
- Strong R (+21.8) · D 38.4% · R 60.1% · Other 1.5%
- 2008→2024 swing
- -31.4pp toward R · 2008: 9.6pp · 2024: -21.8pp
- All cycles
- 2024: R+21.8 2020: R+17.0 2016: R+18.1 2012: D+4.4 2008: D+9.6
Not yet ingested
- Civics
- —
Market trends
- HPI YoY
- ▼ -52.41%
- Current HPI
- 187.076
- Rent YoY
- —
- Metro
- —
- State GDP YoY
- ▲ 2.48%
- F500 in state
- 4
Industry mix (Fortune 500 HQ in IA)
| Industry | F500 HQs | Revenue |
|---|---|---|
| Financial Services | 1 | $16B |
|
||
| Retail / Convenience | 1 | $15B |
|
||
Price history
-8.4% since first listed2 events — show timeline
- 2026-05-15 Price Changed $109,900 MRED as Distributed by MLS Grid
- 2026-04-17 Listed $120,000 MRED as Distributed by MLS Grid
Property tax history
+3.4%/yrLatest (2025): $1,518 · +7.2% YoY. Source: county tax records.
Cash-flow waterfall
monthlySold comps — $/sqft
last 12 mo · ≤1 miLoading sold comps…