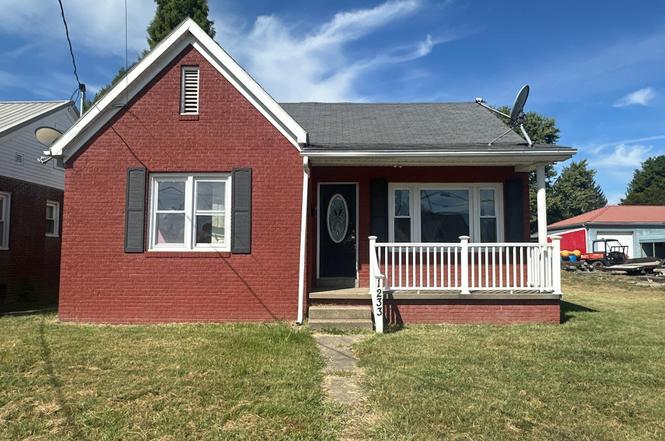
1233 11th St · Tell City, IN
Flood risk 1/10 · Minimal
- FEMA flood zone
- X (unshaded)
- Chance of flooding over 30 yrs
- 0.0%
- Est. flood insurance / yr
- $473 – $860
Fire risk 3/10 · Minor
- Est. fire insurance / yr
- $717 – $1,331
Heat risk 5/10 · Moderate
- Hot days now (above 105°F)
- 7 days/yr
- Hot days in 30 yrs
- 19 days/yr
Wind risk 2/10 · Minimal
- Chance of severe wind over 30 yrs
- 2.0%
Air-quality risk 3/10 · Minor
- Unhealthy air days now
- 2 days/yr
- Unhealthy air days in 30 yrs
- 5 days/yr
Risk factors via First Street. Map © Google.
Why this score? — see what drove the B- grade
The composite is a weighted blend of 9 inputs, each scored 0–100. Each bar is that input's sub-score; the figure is the points it added to the 100-point composite (weight × sub-score).
- Cash flow +26.1/30.0
- ARV discount +15.0/15.0
- DSCR +8.8/10.0
- 1% rule +6.1/10.0
- Livability +3.8/5.0
- Schools +3.7/10.0
- Rent growth +2.5/5.0
- Condition / age +2.5/5.0
- Appreciation +0.0/10.0
$78,800
🖨 Deal sheet (PDF) 📄 Offer letter ✓ Due diligence
Listing remarks MLS
Nice 3 bedroom, 2 Bath home. Full unfinished basement, electric fireplace, hardwood floors, replacement windows, recently painted exterior, large deck & fenced in backyard. Close to city park.
Key facts
- Full basement
- Hardwood floors
- Fenced rear yard
Tags
Property features AI
Exterior
- Utilities: Public water; Public sewer
- Home design: Single-family residence; Site-built home; One story
- Construction: Brick construction
- Exterior features: Deck; Porch; Level lot
Interior
- Bedrooms: Total rooms: 5
- Flooring: Hardwood
- Bathrooms: 2 full bathrooms; 1 main-level bathroom
- Heating & cooling: Natural gas forced-air heating; Central air conditioning
- Interior features: Hardwood flooring; Full unfinished basement
- Laundry & utility: Laundry located on lower level
Neighborhood map
What this means for you Summary
Snapshot
- This is a 2-bed/1.0-bath single-family listed at $79k.
Deal economics
- At list price, monthly cash flow is $198 ($2k/yr) — positive.
- The deal already cash-flows at list — no discount required.
- Meets the 1% rule at list price ($873 rent vs $79k).
- Recommended offer: $69k (12.0% below list) — sets the bar for market timing.
Location & tenants
- Location reads 75/100 on livability (#60 in IN, #4,053 nationally) — a middle-class / working-renter tenant base. Strengths: cost of living A+, housing A+, crime A; Watch: employment D, amenities F, commute F.
- Tell City-Troy Twp School Corporation (rural): math 37% / reading 51% proficiency, ranked #108 of 301 in IN (top 36%) — families likely to look elsewhere, expect single-tenant / working-renter base with shorter leases.
- Zoned schools: William Tell Elementary School (math 34% / reading 43%, grade F, #535 of 994 statewide, top 54%, 757 students, 52% FRL); Tell City Jr-Sr High School (math 39% / reading 61%, grade D+, #120 of 369 statewide, top 33%, 643 students, 47% FRL).
- Market conditions: 31 active listings in the ZIP; 2 comparable units currently listed for rent nearby; 31 units permitted in Perry County in 2024 (0 in 5+ unit buildings).
Forward outlook
- Local home prices are declining (-3.0%/yr); year-one equity from $545 of loan paydown is wiped out by about $2k of value loss. Plan a longer hold.
- Perry County population projected to shrink 9% by 2050 — rents likely to lag national; underwrite the cash flow, not the appreciation.
Negotiation context
- It's been on market 292 days — a 12% lower offer ($69k) is reasonable based on typical stale-listing flexibility.
- 3 sale attempts since 9y ago; this cycle's ask has dropped $51k (39%) from the opening price — seller is motivated, your offer sets the floor, not the list.
Risks & watch-outs
- Watch-outs: built in 1942 — expect roof / HVAC / electrical / plumbing capex.
- Climate carrying-cost: extreme-heat days projected 7→19/yr by 2055 (HVAC capex compounding) — expect insurance premiums to compound above CPI over the hold.
Questions for the listing agent
- It's been on market 292 days. Have you received any prior offers? Is the seller open to a 12% concession, seller financing, or rate buy-down credit?
- Built in 1942 — when were the roof, HVAC, electrical panel, plumbing, and water heater last replaced?
- Why hasn't it sold? Are there any deal-killer items the seller is aware of (foundation, flood, title, zoning, code violations)?
- Is there a deadline driving the sale (1031 exchange, divorce, estate, relocation)? That informs how much negotiation room exists.
- What's the average days-on-market for RENTAL listings here right now (not sales)? A rising rental-DOM trend means longer vacancies and softer asking-rent achievability than the comps imply.
- What's the recent tenant-quality profile in this submarket — average credit score on applications, eviction rate, late-payment / NSF rate, and stable-employment percentage? A property-management company in the area should have these aggregated.
- How much new for-sale + rental construction is in the pipeline within 1–3 miles? Heavy new supply typically softens prices + rents 12–24 months out; constrained supply supports both.
Investment metrics
- 1% rule
- 1.11% ✓
- Cap rate
- 9.31%
- Cash-on-cash
- 10.76%
- DSCR
- 1.48
- GRM
- 7.5
CMA / ARV
- ARV (on-the-fly)
- $131,610
- Comps found
- 7
Show comp detail 7 sales within ~0.75 mi
| Address | Dist | Beds/Ba | Sqft | Sold | Price | $/sf | Match |
|---|---|---|---|---|---|---|---|
| 1002 14th St | 0.36mi | 2/1.0 | 1,218 (-1%) | 4mo | $122,000 | $100 | 78 |
| 1401 10th St | 0.17mi | 2/1.0 | 1,350 (+10%) | 18mo | $145,000 | $107 | 61 |
| 1320 Main St | 0.20mi | 2/1.0 | 1,068 (-13%) | 21mo | $122,000 | $114 | 51 |
| 539 13th St | 0.73mi | 3/1.0 (+1) | 1,203 (-2%) | 9mo | $118,000 | $98 | 50 |
| 1014 12th St | 0.26mi | 2/1.0 | 1,048 (-15%) | 22mo | $61,000 | $58 | 45 |
| 916 19th St | 0.70mi | 3/1.5 (+1) | 1,184 (-4%) | 11mo | $157,000 | $133 | 45 |
| 1827 Fulton St | 0.70mi | 3/1.5 (+1) | 1,317 (+7%) | 11mo | $168,900 | $128 | 40 |
Match score weights: distance 35% · size 25% · config 20% · recency 20%. Top-matched comps best support the ARV.
Projected returns pro-forma
-3.0% appreciation · 3.0% rent growth · sell at horizon
- IRR
- -0.2%
- Equity multiple
- 0.99×
- Total profit
- $-186
- Equity at exit
- $11,749
- IRR
- 9.4%
- Equity multiple
- 1.72×
- Total profit
- $15,988
- Equity at exit
- $6,813
Cash invested: $22,064 (down + closing). Projections, not guarantees.
Landlord ↔ Tenant lean methodology
- Overall (STATE)
- 90 Strongly Landlord-Friendly
- State Indiana
- 90 Strongly Landlord-Friendly · R+11
- County
- — inherits STATE
- City
- — inherits STATE
ZIP-level market 47586
- Home prices YoY
- -22.5%
- Active inventory
- 31
- Price-to-rent
- 7.5×
Monthly cashflow live
- Estimated rent
- $873 medium interval (Pro) →
- Mortgage (P&I)
- −$413
- Tax from tax record
- −$46 /mo · $548/yr
- Insurance
- −$33
- HOA
- −$0
- Vacancy / Maint / Mgmt
- −$183
- Net cashflow
- $198
Break-even live
Sensitivity live
| Price | -10% $242 | -5% $220 | +0% $198 | +5% $176 | +10% $153 |
|---|---|---|---|---|---|
| Rent | -10% $129 | -5% $163 | +0% $198 | +5% $232 | +10% $267 |
| Rate | -1.0pp $238 | -0.5pp $218 | base $198 | +0.5pp $177 | +1.0pp $157 |
UW: 25.0% down · 7.5% · 30yr · 1.5% tax · 5.0% vac · 8.0% maint · 8.0% mgmt
Financing live
Cash to close
- Down payment
- $19,700
- Closing costs
- $2,364
- Reserves months
- —
- Total cash needed
- —
Loan-product check · same deal, 3 products live
Conventional
25% down · 7.5% · 30yr
- Down + closing
- —
- Monthly P&I
- —
- Monthly cashflow
- —
- DSCR
- —
- Eligible?
- —
Personal DTI + credit; lowest rate.
DSCR
20% down · 8.5% · 30yr
- Down + closing
- —
- Monthly P&I
- —
- Monthly cashflow
- —
- DSCR
- —
- Eligible?
- —
No personal income docs; deal must DSCR.
Hard money
10% down · 12.0% · 12mo
- Down + closing
- —
- Monthly P&I
- —
- Monthly cashflow
- —
- DSCR
- —
- Eligible?
- —
Short-term bridge; refi at stabilization.
Rent comps 2 comps
| Address | Beds | Baths | Sqft | Rent | $/sqft | DOM | Units | Dist |
|---|---|---|---|---|---|---|---|---|
| 602 12th St Unit A Tell City, IN | 1.0 | 1.0 | 900 | $975 | $1.08 | 23d | 1 | 0.67mi |
| 1002 20th St Tell City, IN | 2.0 | 1.0 | 805 | $750 | $0.93 | 45d | 1 | 0.72mi |
Listing history 31 events
-
2026-06-22days on market $78,800 Active 292 DOM
-
2026-06-21days on market $78,800 Active 291 DOM
-
2026-06-21days on market $78,800 Active 290 DOM
-
2026-06-18days on market $78,800 Active 288 DOM
-
2026-06-17days on market $78,800 Active 287 DOM
-
2026-06-17price $78,800 Active 286 DOM
-
2026-06-16days on market $82,900 Active 286 DOM
-
2026-06-15days on market $82,900 Active 285 DOM
-
2026-06-13days on market $82,900 Active 283 DOM
-
2026-06-12days on market $82,900 Active 282 DOM
-
2026-06-09days on market $82,900 Active 279 DOM
-
2026-06-08days on market $82,900 Active 278 DOM
-
2026-06-07days on market $82,900 Active 277 DOM
-
2026-06-04days on market $82,900 Active 273 DOM
-
2026-06-02days on market $82,900 Active 272 DOM
-
2026-06-01days on market $82,900 Active 271 DOM
-
2026-05-31days on market $82,900 Active 270 DOM
-
2026-05-31days on market $82,900 Active 269 DOM
-
2026-05-12price $82,900
-
2026-04-10price $89,900
-
2026-03-10price $99,900
-
2026-02-09price $106,000
-
2026-01-06price $111,500
-
2025-12-04price $117,000
-
2025-11-05price $122,000
-
2025-10-04price $127,000
-
2025-09-03$129,900 Active
-
2018-07-09soldstatus $80,200 198-char remark
Show marketing remark (198 chars)
Nice 3 bedroom, 2 Bath home. Full unfinished basement, electric fireplace, hardwood floors, replacement windows, recently painted exterior, large deck & fenced in backyard. Close to city park.
-
2018-01-18$79,900 198-char remark
Show marketing remark (198 chars)
Nice 3 bedroom, 2 Bath home. Full unfinished basement, electric fireplace, hardwood floors, replacement windows, recently painted exterior, large deck & fenced in backyard. Close to city park.
-
2017-07-14$79,900
-
2008-10-02soldstatus $69,500
ⓘ Source: listings_history table (triggers on properties + properties_extension) + one-shot
backfill from property_details.listing_events for pre-trigger history.
Tax reassessment forecast IN · Partial reset (capped growth)
- Current annual tax
- $548 · $46/mo
- Projected year-2 tax
- $609 · $51/mo
- Expected delta
- +$61/yr (+$5/mo · 11.1%)
ⓘ Screening estimate from a state-policy table — verify with the county assessor before closing.
Climate risk First Street
- Flood 1/10 Low FEMA zone X (unshaded) · 0% chance over 30 yrs
- Wildfire 3/10 Moderate
- Heat 5/10 Major 7 d/yr ≥105°F today · 19 d/yr by 30 yrs out
- Wind 2/10 Low 2% chance of damaging wind over 30 yrs
- Air quality 3/10 Moderate 2 unhealthy d/yr today · 5 by 30 yrs out
Nearby sold comps map
Loading sold comps map…
Walkable amenities ~0.75 mi
Loading nearby amenities…
Taxation est. · year 1
- Rental income
- $10,475
- − Mortgage interest
- −$4,414
- − Property taxes
- −$548
- − Insurance
- −$394
- − Repairs & maintenance
- −$838
- − Management
- −$838
- − Depreciation
- −$2,292
- Taxable income
- $1,151
- Est. tax owed @ 24.0%
- −$276
- After-tax cash flow
- $2,098/yr
For passive investors: Depreciation is non-cash, so a rental often shows a tax loss while cash-flowing — sheltering income. Rental losses are passive: they offset passive income freely, and up to $25,000/yr can offset ordinary (W-2) income if you actively participate and your MAGI is under $100k (phasing out to $0 by $150k); unused losses carry forward. On sale, claimed depreciation is recaptured at up to 25%, and gains may owe capital-gains tax (a 1031 exchange can defer both). Figures are a year-1 estimate at your 24.0% rate — not tax advice; consult a CPA.
Schools (NCES district)
- District
- Tell City-Troy Twp School Corporation
- NCES district ID
- 1811260
- Math proficiency
- 37% ▼ -19.00%
- Reading proficiency
- 51% ▼ -7.00%
- Median HH income
- $45,706
- Composite
- 37.35/100
- National rank
- #4435
- State rank
- #108 of 301 in IN
Livability — Tell City
- Score
- 75/100
- State rank
- #60
- US rank
- #4053
Category grades
Schools grade is shown separately in the Schools card above.
Census & demographics
- Census place
- Tell City, IN
- Population (ZIP)
- 10,994
Population outlook (Perry County) Hauer SSP2
- Today (2025)
- 19,125 people
- By 2030
- 18,912 · -1.1%
- By 2040
- 18,239 · -4.6%
- By 2050
- 17,402 · -9.0%
- By 2075
- 15,420 · -19.4%
- By 2100
- 11,987 · -37.3%
Race, ethnicity, and origin ACS 2023
- Neighborhood character
- Predominantly White (94%)
- Race & ethnicity
- White 94% Two or more races 3% Hispanic / Latino 1% Asian 1%
- Common ancestry
- Lithuanian 3% Italian 1% English 1%
- Foreign-born
- 1% · Canada
- Languages at home
- 98% English-only · Other Asian/Pacific 1% Spanish 1% German/W. Germanic 1%
Political lean MEDSL · Perry
- 2024 margin
- Strong R (+29.8) · D 34.3% · R 64.0% · Other 1.7%
- 2008→2024 swing
- -52.6pp toward R · 2008: 22.8pp · 2024: -29.8pp
- All cycles
- 2024: R+29.8 2020: R+24.6 2016: R+18.6 2012: D+11.6 2008: D+22.8
Not yet ingested
- Civics
- —
Market trends
- HPI YoY
- ▼ -56.86%
- Current HPI
- 196.1925
- Rent YoY
- —
- Metro
- —
- State GDP YoY
- ▲ 2.90%
- F500 in state
- 18
Industry mix (Fortune 500 HQ in IN)
| Industry | F500 HQs | Revenue |
|---|---|---|
| Industrial Machinery | 2 | $37B |
|
||
| Healthcare | 1 | $177B |
|
||
| Pharmaceuticals | 1 | $45B |
|
||
| Metals / Steel | 1 | $18B |
|
||
| Agriculture | 1 | $17B |
|
||
| Packaging | 1 | $12B |
|
||
Price history
+19.3% since first listed13 events — show timeline
- 2026-05-12 Price Changed $82,900 IRMLS
- 2026-04-10 Price Changed $89,900 IRMLS
- 2026-03-10 Price Changed $99,900 IRMLS
- 2026-02-09 Price Changed $106,000 IRMLS
- 2026-01-06 Price Changed $111,500 IRMLS
- 2025-12-04 Price Changed $117,000 IRMLS
- 2025-11-05 Price Changed $122,000 IRMLS
- 2025-10-04 Price Changed $127,000 IRMLS
- 2025-09-03 Listed $129,900 IRMLS
- 2018-07-09 Sold (MLS) $80,200 IRMLS
- 2018-01-18 Listed $79,900 IRMLS
- 2017-07-14 Listed $79,900 IRMLS
- 2008-10-02 Sold (Public Records) $69,500 Public Records
Property tax history
-12.7%/yrLatest (2024): $548 · +2.1% YoY. Source: county tax records.
Cash-flow waterfall
monthlySold comps — $/sqft
last 12 mo · ≤1 miLoading sold comps…