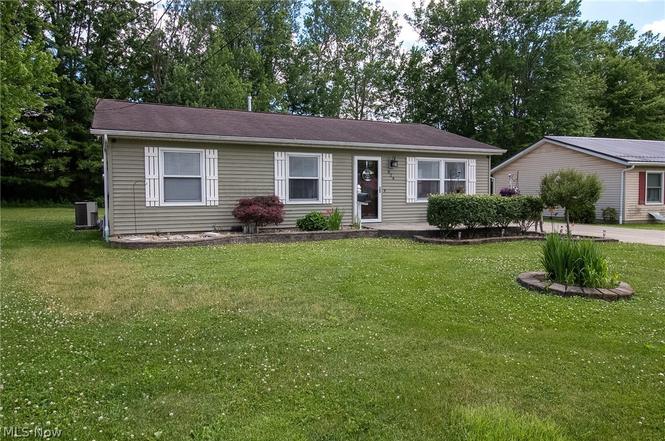
824 S Nearing Cir · Geneva, OH
Flood risk 1/10 · Minimal
- FEMA flood zone
- X (unshaded)
- Chance of flooding over 30 yrs
- 0.0%
- Est. flood insurance / yr
- $507 – $1,088
Fire risk 1/10 · Minimal
- Est. fire insurance / yr
- $713 – $1,323
Heat risk 3/10 · Minor
- Hot days now (above 94°F)
- 7 days/yr
- Hot days in 30 yrs
- 18 days/yr
Wind risk 1/10 · Minimal
- Chance of severe wind over 30 yrs
- —
Air-quality risk 3/10 · Minor
- Unhealthy air days now
- 2 days/yr
- Unhealthy air days in 30 yrs
- 5 days/yr
Risk factors via First Street. Map © Google.
Why this score? — see what drove the D- grade
The composite is a weighted blend of 9 inputs, each scored 0–100. Each bar is that input's sub-score; the figure is the points it added to the 100-point composite (weight × sub-score).
- Cash flow +14.2/30.0
- Schools +4.7/10.0
- DSCR +4.3/10.0
- Livability +3.7/5.0
- ARV discount +3.6/15.0
- 1% rule +3.4/10.0
- Rent growth +2.5/5.0
- Condition / age +2.5/5.0
- Appreciation +0.0/10.0
$185,000
🖨 Deal sheet (PDF) 📄 Offer letter ✓ Due diligence
Listing remarks MLS
Turn Key home. This 3 bedroom home offers large living room, Newly updated eat in Kitchen with hickory cabinets, Corian counter tops, and stainless steal appliances. Freshly painted and new carpet throughout, new cabinets in utility room an much more. Stamped concrete porch and patio along with concrete driveway that leads to a private back yard retreat. There is a 4 car outbuilding with concrete floors, 220 throughout, bath and tons of space for the car person, or hobbyist Newer vinyl siding, newer bath, too much too list. This is a must see
Key facts
- Spacious yard
- Walk-in shower
- Detached garage
Tags
Property features AI
Exterior
- Parking: Detached garage; Driveway; Garage with door opener; Heated garage; 3-car garage
- Utilities: Public water; Public sewer
- Home design: Single-story home; Vinyl siding
- Construction: Asphalt roof; Block foundation; Built with vinyl siding
- Exterior features: Front porch; Patio; Exterior storage; Shed(s); Front yard
Interior
- Kitchen: Dishwasher; Disposal; Microwave; Range; Refrigerator
- Bedrooms: 3 main-level bedrooms
- Bathrooms: 1 full bathroom (main level)
- Heating & cooling: Forced air heating; Central air; Ceiling fans
- Interior features: Total of 5 rooms
- Laundry & utility: Washer hookup; Electric dryer hookup
Neighborhood map
What this means for you Summary
Snapshot
- This is a 3-bed/1.0-bath single-family listed at $185k.
Deal economics
- At list price, monthly cash flow is $30 ($358/yr) — positive.
- The deal already cash-flows at list — no discount required.
- To meet the 1% rule (rent ≥ 1% of price), the offer needs to be $155k (16.3% below list).
- Recommended offer: $155k (16.3% below list) — sets the bar for 1% rule.
- Cap rate 6.5% vs local median 4.7% in Geneva — top-decile yield for the area; either an underpriced asset or a hidden risk that comps aren't pricing in. Stress-test before assuming the spread holds.
Location & tenants
- Location reads 74/100 on livability (#291 in OH, #4,770 nationally) — a middle-class / working-renter tenant base. Strengths: cost of living A+, housing A+, health & safety A+; Watch: commute F, employment F.
- Geneva Area City (town): math 52% / reading 60% proficiency, ranked #362 of 656 in OH (top 55%) — acceptable for families but not a draw, mixed tenant base, ~2y average lease.
- Zoned schools: Geneva Platt R. Spencer Elementary School (math 43% / reading 41%, grade F, #1,030 of 1,584 statewide, top 66%, 402 students, 0% FRL); Geneva Middle School (math 49% / reading 61%, grade B-, #335 of 654 statewide, top 52%, 511 students, 62% FRL); Geneva High School (math 47% / reading 62%, grade C-, #303 of 781 statewide, top 42%, 658 students, 63% FRL) — zoned schools at 42% FRL track the district average.
- Market conditions: 87 active listings in the ZIP; 1 comparable units currently listed for rent nearby; 155 units permitted in Ashtabula County in 2024 (0 in 5+ unit buildings).
- This rent runs 32% of the median local income ($58k/yr) — at the standard rent-burdened threshold; future hikes will face affordability resistance.
Forward outlook
- Local home prices are declining (-3.0%/yr); year-one equity from $1k of loan paydown is wiped out by about $6k of value loss. Plan a longer hold.
- Ashtabula County population projected at -22% by 2050 — secular population decline; favor cash flow + early exit over multi-decade hold.
Negotiation context
- Only 1 days on market — expect competitive offers; lowballing is unlikely to land.
- 5 sale attempts since 35y ago with the ask held roughly flat each time — persistent listings suggest the price (not the market) is what's stuck; bring a comps-based counter.
- Current owner paid $105k; list at $185k implies a 76% gain — meaningful room to come down on a strong offer.
Questions for the listing agent
- Built in 1975 — when were the roof, HVAC, electrical panel, plumbing, and water heater last replaced?
- Is there a deadline driving the sale (1031 exchange, divorce, estate, relocation)? That informs how much negotiation room exists.
- The area grade is low — what's the realistic commute time and amenity access for the typical tenant pool here? Any planned neighborhood developments (good or bad) we should know about?
- What's the average days-on-market for RENTAL listings here right now (not sales)? A rising rental-DOM trend means longer vacancies and softer asking-rent achievability than the comps imply.
- What's the recent tenant-quality profile in this submarket — average credit score on applications, eviction rate, late-payment / NSF rate, and stable-employment percentage? A property-management company in the area should have these aggregated.
- How much new for-sale + rental construction is in the pipeline within 1–3 miles? Heavy new supply typically softens prices + rents 12–24 months out; constrained supply supports both.
Investment metrics
- 1% rule
- 0.84% ✗
- Cap rate
- 6.49%
- Cash-on-cash
- 0.69%
- DSCR
- 1.03
- GRM
- 10.0
CMA / ARV
- ARV (on-the-fly)
- $170,240
- Comps found
- 12
Show comp detail 12 sales within ~0.75 mi
| Address | Dist | Beds/Ba | Sqft | Sold | Price | $/sf | Match |
|---|---|---|---|---|---|---|---|
| 315 Garfield St | 0.23mi | 3/1.0 | 1,184 (+6%) | 3mo | $135,000 | $114 | 77 |
| 417 Centennial St | 0.16mi | 4/1.5 (+1) | 1,068 (-5%) | 7mo | $250,000 | $234 | 72 |
| 356 Garfield St | 0.25mi | 4/1.0 (+1) | 1,155 (+3%) | 10mo | $230,000 | $199 | 70 |
| 104 S Cedar St | 0.49mi | 3/1.5 | 1,072 (-4%) | 3mo | $169,900 | $158 | 66 |
| 3123 Spencer Dr | 0.72mi | 3/1.0 | 1,152 (+3%) | 1mo | $175,000 | $152 | 61 |
| 88 Leslie St | 0.70mi | 3/1.0 | 1,056 (-6%) | 2mo | $134,900 | $128 | 56 |
| 4704 S Ridge Rd E | 0.56mi | 2/1.0 (-1) | 1,170 (+4%) | 8mo | $145,000 | $124 | 55 |
| 139 E Union St | 0.67mi | 3/1.0 | 1,040 (-7%) | 8mo | $161,000 | $155 | 50 |
| 171 Leslie St | 0.61mi | 2/2.0 (-1) | 1,044 (-7%) | 2mo | $155,000 | $148 | 50 |
| 98 Leslie St | 0.69mi | 3/1.0 | 1,056 (-6%) | 12mo | $149,900 | $142 | 49 |
| 830 Millwood Dr | 0.68mi | 3/2.0 | 1,200 (+7%) | 8mo | $204,000 | $170 | 45 |
| 585 Sherman St | 0.56mi | 4/1.0 (+1) | 1,232 (+10%) | 12mo | $142,977 | $116 | 42 |
Match score weights: distance 35% · size 25% · config 20% · recency 20%. Top-matched comps best support the ARV.
Projected returns pro-forma
-3.0% appreciation · 3.0% rent growth · sell at horizon
- IRR
- -15.2%
- Equity multiple
- 0.46×
- Total profit
- $-28,105
- Equity at exit
- $27,584
- IRR
- -6.7%
- Equity multiple
- 0.57×
- Total profit
- $-22,141
- Equity at exit
- $15,995
Cash invested: $51,800 (down + closing). Projections, not guarantees.
Landlord ↔ Tenant lean methodology
- Overall (STATE)
- 73 Landlord-Friendly
- State Ohio
- 73 Landlord-Friendly · R+6
- County
- — inherits STATE
- City
- — inherits STATE
ZIP-level market 44041
- Home prices YoY
- -31.3%
- Active inventory
- 87
- Price-to-rent
- 10.0×
Monthly cashflow live
- Estimated rent
- $1,549 medium interval (Pro) →
- Mortgage (P&I)
- −$970
- Tax from tax record
- −$147 /mo · $1,759/yr
- Insurance
- −$77
- HOA
- −$0
- Lot rent
- −$0
- Vacancy / Maint / Mgmt
- −$325
- Net cashflow
- $30
Break-even live
Sensitivity live
| Price | -10% $135 | -5% $82 | +0% $30 | +5% $-23 | +10% $-75 |
|---|---|---|---|---|---|
| Rent | -10% $-93 | -5% $-31 | +0% $30 | +5% $91 | +10% $152 |
| Rate | -1.0pp $123 | -0.5pp $77 | base $30 | +0.5pp $-18 | +1.0pp $-67 |
UW: 25.0% down · 7.5% · 30yr · 1.5% tax · 5.0% vac · 8.0% maint · 8.0% mgmt
Financing live
Cash to close
- Down payment
- $46,250
- Closing costs
- $5,550
- Reserves months
- —
- Total cash needed
- —
Loan-product check · same deal, 3 products live
Conventional
25% down · 7.5% · 30yr
- Down + closing
- —
- Monthly P&I
- —
- Monthly cashflow
- —
- DSCR
- —
- Eligible?
- —
Personal DTI + credit; lowest rate.
DSCR
20% down · 8.5% · 30yr
- Down + closing
- —
- Monthly P&I
- —
- Monthly cashflow
- —
- DSCR
- —
- Eligible?
- —
No personal income docs; deal must DSCR.
Hard money
10% down · 12.0% · 12mo
- Down + closing
- —
- Monthly P&I
- —
- Monthly cashflow
- —
- DSCR
- —
- Eligible?
- —
Short-term bridge; refi at stabilization.
Rent comps 1 comps
| Address | Beds | Baths | Sqft | Rent | $/sqft | DOM | Units | Dist |
|---|---|---|---|---|---|---|---|---|
| 430 Garfield St Geneva, OH | 4.0 | 1.0 | 1248 | $1,549 | $1.24 | 46d | 1 | 0.22mi |
Listing history 3 events
-
2026-06-18status $185,000 Pending 1 DOM
-
2026-06-17remarks 699-char remark
-
2026-06-17$185,000 Active 1 DOM
ⓘ Source: listings_history table (triggers on properties + properties_extension) + one-shot
backfill from property_details.listing_events for pre-trigger history.
Tax reassessment forecast OH · Partial reset (capped growth)
- Current annual tax
- $1,759 · $147/mo
- Projected year-2 tax
- $2,323 · $194/mo
- Expected delta
- +$563/yr (+$47/mo · 32.0%)
ⓘ Screening estimate from a state-policy table — verify with the county assessor before closing.
Climate risk First Street
- Flood 1/10 Low FEMA zone X (unshaded) · 0% chance over 30 yrs
- Wildfire 1/10 Low
- Heat 3/10 Moderate 7 d/yr ≥94°F today · 18 d/yr by 30 yrs out
- Wind 1/10 Low
- Air quality 3/10 Moderate 2 unhealthy d/yr today · 5 by 30 yrs out
Nearby sold comps map
Loading sold comps map…
Walkable amenities ~0.75 mi
Loading nearby amenities…
Taxation est. · year 1
- Rental income
- $18,588
- − Mortgage interest
- −$10,363
- − Property taxes
- −$1,759
- − Insurance
- −$925
- − Repairs & maintenance
- −$1,487
- − Management
- −$1,487
- − Depreciation
- −$5,382
- Taxable loss
- −$2,815
- Est. tax savings @ 24.0%
- +$676
- After-tax cash flow
- $1,034/yr
For passive investors: Depreciation is non-cash, so a rental often shows a tax loss while cash-flowing — sheltering income. Rental losses are passive: they offset passive income freely, and up to $25,000/yr can offset ordinary (W-2) income if you actively participate and your MAGI is under $100k (phasing out to $0 by $150k); unused losses carry forward. On sale, claimed depreciation is recaptured at up to 25%, and gains may owe capital-gains tax (a 1031 exchange can defer both). Figures are a year-1 estimate at your 24.0% rate — not tax advice; consult a CPA.
Schools (NCES district)
- District
- Geneva Area City
- NCES district ID
- 3904405
- Math proficiency
- 52% ▼ -16.00%
- Reading proficiency
- 60% ▼ -2.00%
- Median HH income
- $43,525
- Composite
- 47.12/100
- National rank
- #2328
- State rank
- #362 of 656 in OH
Livability — Geneva
- Score
- 74/100
- State rank
- #291
- US rank
- #4770
Category grades
Schools grade is shown separately in the Schools card above.
Census & demographics
- Census place
- Geneva, OH
- County
- Ashtabula · 97,617 people
- Metro
- Cleveland, OH
- Population (ZIP)
- 13,992
- Household income
- $58,438
- Rent vs Own
- Severe rent burden
- 12.5
Population outlook (Ashtabula County) Hauer SSP2
- Today (2025)
- 92,950 people
- By 2030
- 89,146 · -4.1%
- By 2040
- 80,715 · -13.2%
- By 2050
- 72,270 · -22.2%
- By 2075
- 55,780 · -40.0%
- By 2100
- 40,928 · -56.0%
Race, ethnicity, and origin ACS 2023
- Neighborhood character
- Predominantly White (85%)
- Race & ethnicity
- White 85% Hispanic / Latino 7% Two or more races 6% Black 4%
- Hispanic origin (detail)
- Mexican 1% Puerto Rican 4%
- Common ancestry
- Romanian 3% Slovak 2% Lithuanian 2%
- Foreign-born
- 1% · Canada
- Languages at home
- 96% English-only · Spanish 4%
Political lean MEDSL · Ashtabula
- 2024 margin
- Strong R (+28.4) · D 35.4% · R 63.8%
- 2008→2024 swing
- -41.9pp toward R · 2008: 13.5pp · 2024: -28.4pp
- All cycles
- 2024: R+28.4 2020: R+23.5 2016: R+19.0 2012: D+12.1 2008: D+13.5
Not yet ingested
- Civics
- —
Market trends
- HPI YoY
- ▼ -105.04%
- Current HPI
- 230.8747
- Rent YoY
- —
- Metro
- —
- State GDP YoY
- ▲ 1.98%
- F500 in state
- 48
Industry mix (Fortune 500 HQ in OH)
| Industry | F500 HQs | Revenue |
|---|---|---|
| Insurance | 3 | $145B |
|
||
| Industrial Machinery | 3 | $49B |
|
||
| Financial Services | 3 | $24B |
|
||
| Consumer Goods | 2 | $93B |
|
||
| Aerospace / Defense | 2 | $47B |
|
||
| Utilities | 2 | $33B |
|
||
Price history
+386.8% since first listed14 events — show timeline
- 2026-06-17 Listed $185,000 MLSNOW
- 2022-07-16 Listing Removed — MLSNOW
- 2022-07-09 Listed $164,900 MLSNOW
- 2015-11-03 Sold (MLS) $105,000 MLSNOW
- 2015-10-30 Sold (Public Records) $105,000 Public Records
- 2015-09-21 Pending — MLSNOW
- 2015-08-27 Price Changed $109,900 MLSNOW
- 2015-08-04 Listed $114,900 MLSNOW
- 2014-06-03 Listing Removed — MLSNOW
- 2014-05-06 Listed $129,900 MLSNOW
- 1992-01-28 Sold (Public Records) $50,900 Public Records
- 1992-01-28 Sold (MLS) $50,900 MLSNOW
- 1991-12-08 Listed $51,900 MLSNOW
- 1990-05-23 Sold (Public Records) $38,000 Public Records
Property tax history
+2.8%/yrLatest (2025): $1,759 · -2.9% YoY. Source: county tax records.
Cash-flow waterfall
monthlySold comps — $/sqft
last 12 mo · ≤1 miLoading sold comps…