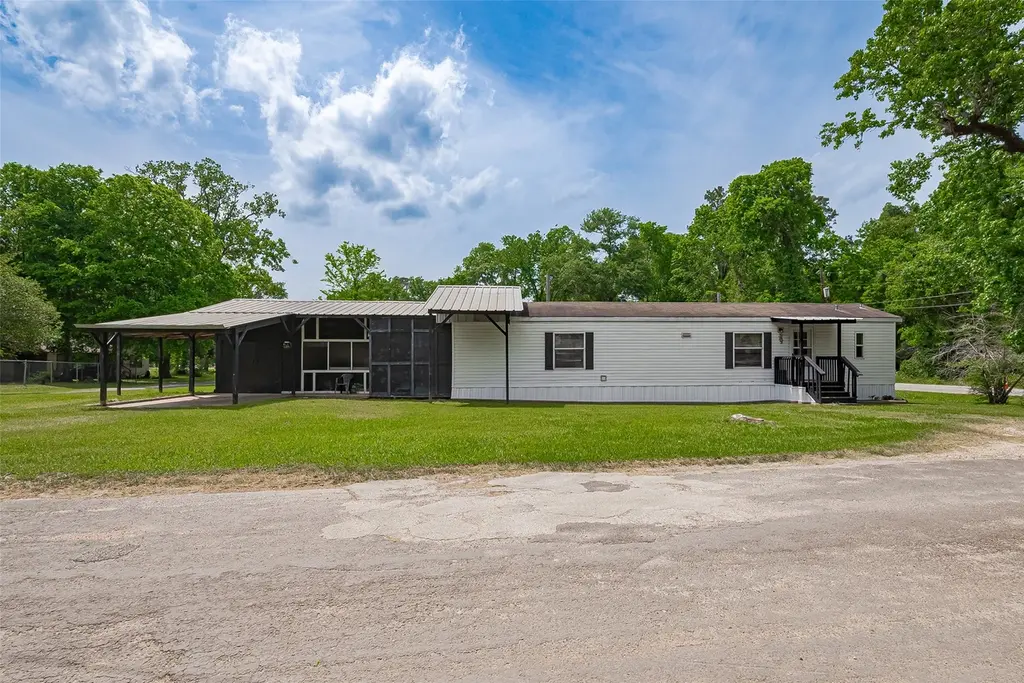
506 South Oakhurst Dr · Livingston, TX
Flood risk 9/10 · Severe
- FEMA flood zone
- X (unshaded)
- Chance of flooding over 30 yrs
- 0.99%
- Est. flood insurance / yr
- $507 – $1,088
Fire risk 4/10 · Minor
- Est. fire insurance / yr
- $1,222 – $2,270
Heat risk 8/10 · Major
- Hot days now (above 111°F)
- 7 days/yr
- Hot days in 30 yrs
- 24 days/yr
Wind risk 8/10 · Major
- Chance of severe wind over 30 yrs
- 99.0%
Air-quality risk 1/10 · Minimal
- Unhealthy air days now
- 0 days/yr
- Unhealthy air days in 30 yrs
- 0 days/yr
Risk factors via First Street. Map © Google.
Why this score? — see what drove the D- grade
The composite is a weighted blend of 9 inputs, each scored 0–100. Each bar is that input's sub-score; the figure is the points it added to the 100-point composite (weight × sub-score).
- Cash flow +10.8/30.0
- ARV discount +7.5/15.0
- 1% rule +3.2/10.0
- Schools +3.2/10.0
- DSCR +3.1/10.0
- Livability +3.0/5.0
- Rent growth +2.5/5.0
- Condition / age +2.5/5.0
- Appreciation +0.0/10.0
$115,000
🖨 Deal sheet (PDF) 📄 Offer letter ✓ Due diligence
Listing remarks MLS
Discover a charming opportunity at 506 S Oakhurst Drive in Livingston, Texas! This well-maintained 2-bedroom, 2-bathroom manufactured home, built in 2012, offers 896 square feet of comfortable living space on a 0.36-acre corner lot, plus an additional 0.26-acre restricted-use easement that adds extra open space and privacy. The home features a screened porch, garage spaces, a workshop, and ample storage. Recent updates include home leveling, new skirting, and an updated exterior air conditioning unit. Located near Matthews Street Park, residents can enjoy amenities such as a pool, playgrounds, tennis courts, and walking paths. Situated within the Livingston Independent School District, this property offers both comfort and convenience. Priced at $125,000, it presents an excellent opportunity for homeowners or investors alike.
Key facts
- Screened porch
- Workshop
- 0.36 acre lot
Tags
Property features AI
Finance
- Other: Lease not considered; Disclosures: Easement(s), Seller Disclosure
Exterior
- Parking: Detached garage; 1 garage space
- Utilities: Public water; Public sewer
- Home design: Farm property; Built in 2012; Single-level entry (first floor rooms listed)
- Construction: Pillar/post/pier foundation
- Exterior features: Cleared lot; Road frontage on a highway; Road surface: Other
Interior
- Kitchen: Electric oven; Electric range; Free-standing range; Microwave; Oven; Refrigerator
- Bedrooms: Primary bedroom on the first floor (approx. 14.10 x 11.10); Additional bedroom on the first floor (approx. 10.5 x 9.5)
- Bathrooms: 2 full bathrooms
- Heating & cooling: Central heating (electric); Central air (electric)
- Interior features: Ceiling fan(s); 5 total rooms
- Laundry & utility: Washer hookup; Electric dryer hookup; Washer
Neighborhood map
What this means for you Summary
Snapshot
- This is a 2-bed/2.0-bath single-family listed at $115k.
Deal economics
- At list price, monthly cash flow is $-119 ($-1k/yr) — negative.
- To cash-flow at today's rent, offer at most $98k (14.9% below list).
- To meet the 1% rule (rent ≥ 1% of price), the offer needs to be $94k (18.3% below list).
- Recommended offer: $94k (18.3% below list) — sets the bar for 1% rule.
- Cap rate 5.7% vs local median 2.9% in Livingston — top-decile yield for the area; either an underpriced asset or a hidden risk that comps aren't pricing in. Stress-test before assuming the spread holds.
Location & tenants
- Location reads 59/100 on livability (#1,113 in TX) — a working-class tenant base; expect higher turnover. Strengths: cost of living A+, housing A, health & safety A; Watch: crime F, amenities F, commute F.
- Livingston ISD (rural): math 38% / reading 39% proficiency, ranked #459 of 826 in TX (top 56%) — families likely to look elsewhere, expect single-tenant / working-renter base with shorter leases.
- Zoned schools: Timber Creek El (math 56% / reading 47%, grade C-, #808 of 4,322 statewide, top 19%, 522 students, 74% FRL); Livingston J H (math 30% / reading 32%, grade F, #1,015 of 1,662 statewide, top 62%, 893 students, 62% FRL); Livingston H S (math 35% / reading 46%, grade F, #798 of 1,632 statewide, top 49%, 1,128 students, 51% FRL) — zoned schools at 63% FRL track the district average.
- Market conditions: 1202 active listings in the ZIP; 4 comparable units currently listed for rent nearby; rentals at typical pace (median 15d on market — plan ~3-4 weeks tenant-placement turnaround); 769 units permitted in Polk County in 2024 (0 in 5+ unit buildings).
- This rent is only 17% of the median local income ($67k/yr) — well below the 30% rent-burden line; pricing power to push rent on renewal without tenant pushback.
Forward outlook
- Local home prices are declining (-3.0%/yr); year-one equity from $795 of loan paydown is wiped out by about $3k of value loss. Plan a longer hold.
- Polk County population projected at +16% by 2050 — long-run rental-demand tailwind backs the buy-and-hold thesis.
Negotiation context
- It's been on market 46 days — a 3% lower offer ($112k) is reasonable based on typical stale-listing flexibility.
- 10 sale attempts since 2y ago; this cycle's ask has dropped $10k (8%) from the opening price — seller is motivated, your offer sets the floor, not the list.
- Current owner paid $8k; list at $115k implies a 1433% gain — meaningful room to come down on a strong offer.
Risks & watch-outs
- Watch-outs: flood insurance adds $66/mo.
- Climate carrying-cost: severe flood risk; severe wind risk, 99% chance of damaging wind over 30y; extreme-heat days projected 7→24/yr by 2055 (HVAC capex compounding) — expect insurance premiums to compound above CPI over the hold.
Questions for the listing agent
- What do current leases actually rent for vs. the listed asking? Can we see a recent rent roll and the last 12 months of T-12 income?
- It's been on market 46 days. Have you received any prior offers? Is the seller open to a 18% concession, seller financing, or rate buy-down credit?
- What's the actual annual flood-insurance premium (NFIP or private), and is the property in a SFHA with mandatory coverage?
- Is there a deadline driving the sale (1031 exchange, divorce, estate, relocation)? That informs how much negotiation room exists.
- Schools are D-rated, which usually means shorter tenancies and higher turnover. Who's the typical renter profile here, and what's been the actual vacancy rate?
- Crime grade is F in this area — have there been break-ins, vandalism, or insurance claims at this property in the last 3 years? What carrier currently insures it and at what premium?
- The area grade is low — what's the realistic commute time and amenity access for the typical tenant pool here? Any planned neighborhood developments (good or bad) we should know about?
- What's the average days-on-market for RENTAL listings here right now (not sales)? A rising rental-DOM trend means longer vacancies and softer asking-rent achievability than the comps imply.
- What's the recent tenant-quality profile in this submarket — average credit score on applications, eviction rate, late-payment / NSF rate, and stable-employment percentage? A property-management company in the area should have these aggregated.
- How much new for-sale + rental construction is in the pipeline within 1–3 miles? Heavy new supply typically softens prices + rents 12–24 months out; constrained supply supports both.
Investment metrics
- 1% rule
- 0.82% ✗
- Cap rate
- 5.75%
- Cash-on-cash
- -1.95%
- DSCR
- 0.91
- GRM
- 10.2
CMA / ARV
No comps found within radius.
Projected returns pro-forma
-3.0% appreciation · 3.0% rent growth · sell at horizon
- IRR
- -23.7%
- Equity multiple
- 0.19×
- Total profit
- $-26,147
- Equity at exit
- $17,147
- IRR
- -18.5%
- Equity multiple
- -0.00×
- Total profit
- $-32,289
- Equity at exit
- $9,943
Cash invested: $32,200 (down + closing). Projections, not guarantees.
Landlord ↔ Tenant lean methodology
- Overall (STATE)
- 87 Strongly Landlord-Friendly
- State Texas
- 87 Strongly Landlord-Friendly · R+5
- County
- — inherits STATE
- City
- — inherits STATE
ZIP-level market 77351
- Home prices YoY
- -14.8%
- Active inventory
- 1202
- Price-to-rent
- 10.2×
Monthly cashflow live
- Estimated rent
- $940 medium interval (Pro) →
- Mortgage (P&I)
- −$603
- Tax est. 1.5%
- −$144 /mo · $1,725/yr
- Insurance
- −$48
- Flood insurance flood zone
- −$66 /mo · $798/yr
- HOA
- −$0
- Vacancy / Maint / Mgmt
- −$197
- Net cashflow
- $-119
Break-even live
Sensitivity live
| Price | -10% $-39 | -5% $-79 | +0% $-119 | +5% $-159 | +10% $-198 |
|---|---|---|---|---|---|
| Rent | -10% $-193 | -5% $-156 | +0% $-119 | +5% $-82 | +10% $-45 |
| Rate | -1.0pp $-61 | -0.5pp $-90 | base $-119 | +0.5pp $-149 | +1.0pp $-179 |
UW: 25.0% down · 7.5% · 30yr · 1.5% tax · 5.0% vac · 8.0% maint · 8.0% mgmt
Financing live
Cash to close
- Down payment
- $28,750
- Closing costs
- $3,450
- Reserves months
- —
- Total cash needed
- —
Loan-product check · same deal, 3 products live
Conventional
25% down · 7.5% · 30yr
- Down + closing
- —
- Monthly P&I
- —
- Monthly cashflow
- —
- DSCR
- —
- Eligible?
- —
Personal DTI + credit; lowest rate.
DSCR
20% down · 8.5% · 30yr
- Down + closing
- —
- Monthly P&I
- —
- Monthly cashflow
- —
- DSCR
- —
- Eligible?
- —
No personal income docs; deal must DSCR.
Hard money
10% down · 12.0% · 12mo
- Down + closing
- —
- Monthly P&I
- —
- Monthly cashflow
- —
- DSCR
- —
- Eligible?
- —
Short-term bridge; refi at stabilization.
Rent comps 4 comps
| Address | Beds | Baths | Sqft | Rent | $/sqft | DOM | Units | Dist |
|---|---|---|---|---|---|---|---|---|
| 111 S Drew St Unit 8 Livingston, TX | 2.0 | 1.0 | 810 | $600 | $0.74 | 5d | 1 | 0.21mi |
| 1416 Noblitt St Livingston, TX | 2.0 | 2.0 | 864 | $1,089 | $1.26 | 14d | 1 | 0.65mi |
| 205 Commerce St Unit 118 Livingston, TX | 2.0 | 1.0 | 800 | $950 | $1.19 | 0d | 1 | 1.22mi |
| 205 Commerce St Unit 100 Livingston, TX | 2.0 | 1.0 | 800 | $950 | $1.19 | 19d | 1 | 1.22mi |
Listing history 42 events
-
2026-06-21days on market $115,000 Active 46 DOM
-
2026-06-18days on market $115,000 Active 43 DOM
-
2026-06-17days on market $115,000 Active 42 DOM
-
2026-06-16days on market $115,000 Active 41 DOM
-
2026-06-15days on market $115,000 Active 40 DOM
-
2026-06-13days on market $115,000 Active 38 DOM
-
2026-06-09days on market $115,000 Active 34 DOM
-
2026-06-08days on market $115,000 Active 33 DOM
-
2026-06-07days on market $115,000 Active 32 DOM
-
2026-06-04days on market $115,000 Active 29 DOM
-
2026-06-03days on market $115,000 Active 28 DOM
-
2026-06-02days on market $115,000 Active 27 DOM
-
2026-06-01days on market $115,000 Active 26 DOM
-
2026-05-31days on market $115,000 Active 25 DOM
-
2026-05-06$125,000 Active 837-char remark
-
2026-05-05$125,000 Active 837-char remark
Show marketing remark (837 chars)
Discover a charming opportunity at 506 S Oakhurst Drive in Livingston, Texas! This well-maintained 2-bedroom, 2-bathroom manufactured home, built in 2012, offers 896 square feet of comfortable living space on a 0.36-acre corner lot, plus an additional 0.26-acre restricted-use easement that adds extra open space and privacy. The home features a screened porch, garage spaces, a workshop, and ample storage. Recent updates include home leveling, new skirting, and an updated exterior air conditioning unit. Located near Matthews Street Park, residents can enjoy amenities such as a pool, playgrounds, tennis courts, and walking paths. Situated within the Livingston Independent School District, this property offers both comfort and convenience. Priced at $125,000, it presents an excellent opportunity for homeowners or investors alike.
-
2026-05-05historical
Show marketing remark (837 chars)
Discover a charming opportunity at 506 S Oakhurst Drive in Livingston, Texas! This well-maintained 2-bedroom, 2-bathroom manufactured home, built in 2012, offers 896 square feet of comfortable living space on a 0.36-acre corner lot, plus an additional 0.26-acre restricted-use easement that adds extra open space and privacy. The home features a screened porch, garage spaces, a workshop, and ample storage. Recent updates include home leveling, new skirting, and an updated exterior air conditioning unit. Located near Matthews Street Park, residents can enjoy amenities such as a pool, playgrounds, tennis courts, and walking paths. Situated within the Livingston Independent School District, this property offers both comfort and convenience. Priced at $125,000, it presents an excellent opportunity for homeowners or investors alike.
-
2026-05-01price $125,000
-
2026-05-01status Active
-
2026-05-01price $95,000
-
2026-03-19soldstatus
-
2025-12-07status Pending
-
2025-10-29historical Active Under Contract
-
2025-10-02status Pending
-
2025-09-10$90,000 Active
-
2025-09-10historical
-
2025-08-28price $90,000
-
2025-08-12$100,000 Active
-
2025-08-12historical
-
2025-06-23$100,000 Active
-
2025-06-23historical
-
2025-04-21$120,000 Active
-
2025-04-07historical
-
2025-03-14status Active
-
2025-03-13historical
-
2024-09-15price $110,000
-
2024-09-10status Active
-
2024-09-09historical
-
2024-06-19price $119,900
-
2024-06-17price $119,000
-
2024-03-20$109,000 Active
-
1992-10-01soldstatus $7,500
ⓘ Source: listings_history table (triggers on properties + properties_extension) + one-shot
backfill from property_details.listing_events for pre-trigger history.
Climate risk First Street
- Flood 9/10 Extreme FEMA zone X (unshaded) · 99% chance over 30 yrs
- Wildfire 4/10 Moderate
- Heat 8/10 Severe 7 d/yr ≥111°F today · 24 d/yr by 30 yrs out
- Wind 8/10 Severe 99% chance of damaging wind over 30 yrs
- Air quality 1/10 Low 0 unhealthy d/yr today · 0 by 30 yrs out
Nearby sold comps map
Loading sold comps map…
Walkable amenities ~0.75 mi
Loading nearby amenities…
Taxation est. · year 1
- Rental income
- $11,277
- − Mortgage interest
- −$6,442
- − Property taxes
- −$1,725
- − Insurance
- −$1,372
- − Repairs & maintenance
- −$902
- − Management
- −$902
- − Depreciation
- −$3,345
- Taxable loss
- −$3,412
- Est. tax savings @ 24.0%
- +$819
- After-tax cash flow
- $-607/yr
For passive investors: Depreciation is non-cash, so a rental often shows a tax loss while cash-flowing — sheltering income. Rental losses are passive: they offset passive income freely, and up to $25,000/yr can offset ordinary (W-2) income if you actively participate and your MAGI is under $100k (phasing out to $0 by $150k); unused losses carry forward. On sale, claimed depreciation is recaptured at up to 25%, and gains may owe capital-gains tax (a 1031 exchange can defer both). Figures are a year-1 estimate at your 24.0% rate — not tax advice; consult a CPA.
Schools (NCES district)
- District
- Livingston ISD
- NCES district ID
- 4827780
- Math proficiency
- 38% ▼ -1.00%
- Reading proficiency
- 39% ▲ 3.00%
- Median HH income
- $39,531
- Composite
- 32.25/100
- National rank
- #5767
- State rank
- #459 of 826 in TX
Livability — Livingston
- Score
- 59/100
- State rank
- #1113
- US rank
- #19723
Category grades
Schools grade is shown separately in the Schools card above.
Census & demographics
- Census place
- Livingston, TX
- County
- Polk County · 37,143 people
- City population
- 37,143
- Metro
- nan
- Population (ZIP)
- 37,143
- Household income
- $66,834
- Rent vs Own
- Severe rent burden
- 608.0
Population outlook (Polk County) Hauer SSP2
- Today (2025)
- 51,049 people
- By 2030
- 53,243 · +4.3%
- By 2040
- 56,528 · +10.7%
- By 2050
- 59,243 · +16.1%
- By 2075
- 63,528 · +24.4%
- By 2100
- 60,376 · +18.3%
Race, ethnicity, and origin ACS 2023
- Neighborhood character
- Predominantly White (72%)
- Race & ethnicity
- White 72% Hispanic / Latino 14% Two or more races 9% Black 8% Native American 2%
- Hispanic origin (detail)
- Mexican 11%
- Common ancestry
- Lithuanian 2% Italian 2% Portuguese 2%
- Foreign-born
- 5% · Canada
- Languages at home
- 88% English-only · Spanish 10%
Political lean MEDSL · Polk
- 2024 margin
- Solid R (+58.9) · D 20.2% · R 79.1%
- 2008→2024 swing
- -21.7pp toward R · 2008: -37.2pp · 2024: -58.9pp
- All cycles
- 2024: R+58.9 2020: R+54.5 2016: R+56.5 2012: R+48.2 2008: R+37.2
Not yet ingested
- Civics
- —
Market trends
- HPI YoY
- ▼ -31.11%
- Current HPI
- 178.5316
- Rent YoY
- —
- Metro
- nan
- State GDP YoY
- ▲ 3.95%
- F500 in state
- 110
Industry mix (Fortune 500 HQ in TX)
| Industry | F500 HQs | Revenue |
|---|---|---|
| Energy | 16 | $1,198B |
|
||
| Technology | 5 | $198B |
|
||
| Engineering / Construction | 4 | $72B |
|
||
| Energy Services | 3 | $60B |
|
||
| Utilities | 3 | $41B |
|
||
| Healthcare | 2 | $330B |
|
||
Price history
+1433.3% since first listed30 events — show timeline
- 2026-05-20 Price Changed $115,000 HARMLS
- 2026-05-20 Price Changed $115,000 HARMLS
- 2026-05-06 Listed $125,000 HARMLS
- 2026-05-05 Listing Removed — HARMLS
- 2026-05-05 Listed $125,000 HARMLS
- 2026-05-01 Price Changed $125,000 HARMLS
- 2026-05-01 Relisted — HARMLS
- 2026-05-01 Price Changed $95,000 HARMLS
- 2026-03-19 Sold (Public Records) — Public Records
- 2025-12-07 Pending — HARMLS
- 2025-10-29 Contingent — HARMLS
- 2025-10-02 Pending — HARMLS
- 2025-09-10 Listing Removed — HARMLS
- 2025-09-10 Listed $90,000 HARMLS
- 2025-08-28 Price Changed $90,000 HARMLS
- 2025-08-12 Listing Removed — HARMLS
- 2025-08-12 Listed $100,000 HARMLS
- 2025-06-23 Listing Removed — HARMLS
- 2025-06-23 Listed $100,000 HARMLS
- 2025-04-21 Listed $120,000 HARMLS
- 2025-04-07 Listing Removed — HARMLS
- 2025-03-14 Relisted — HARMLS
- 2025-03-13 Listing Removed — HARMLS
- 2024-09-15 Price Changed $110,000 HARMLS
- 2024-09-10 Relisted — HARMLS
- 2024-09-09 Listing Removed — HARMLS
- 2024-06-19 Price Changed $119,900 HARMLS
- 2024-06-17 Price Changed $119,000 HARMLS
- 2024-03-20 Listed $109,000 HARMLS
- 1992-10-01 Sold (Public Records) $7,500 Public Records
Property tax history
-10.9%/yrLatest (2025): $176 · +17.1% YoY. Source: county tax records.
Cash-flow waterfall
monthlySold comps — $/sqft
last 12 mo · ≤1 miLoading sold comps…