 Multi-family
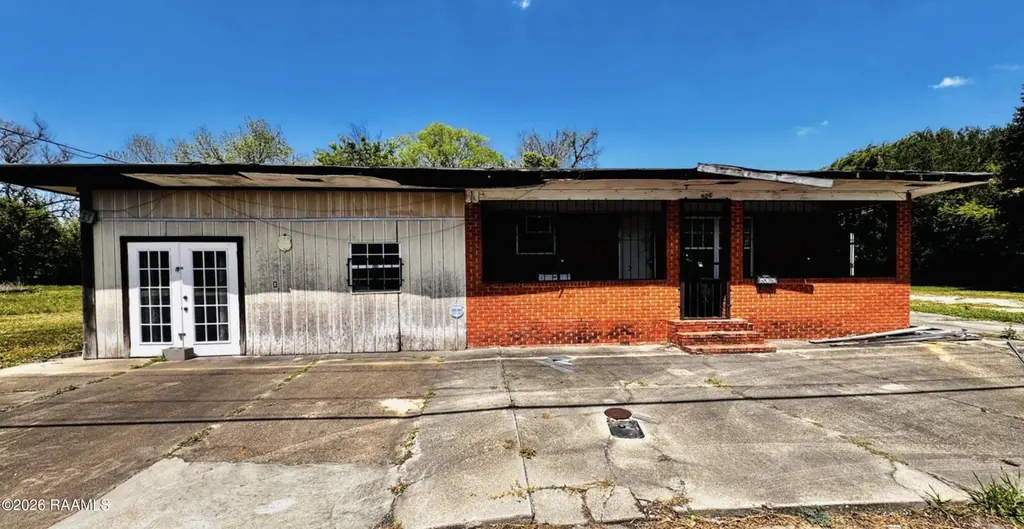
906 W Landry St · Opelousas, LA
Flood risk No data
- FEMA flood zone
- —
- Chance of flooding over 30 yrs
- —
- Est. flood insurance / yr
- —
Fire risk No data
- Est. fire insurance / yr
- —
Heat risk No data
- Hot days now (above threshold)
- —
- Hot days in 30 yrs
- —
Wind risk No data
- Chance of severe wind over 30 yrs
- —
Air-quality risk No data
- Unhealthy air days now
- —
- Unhealthy air days in 30 yrs
- —
Risk factors via First Street. Map © Google.
Why this score? — see what drove the B- grade
The composite is a weighted blend of 9 inputs, each scored 0–100. Each bar is that input's sub-score; the figure is the points it added to the 100-point composite (weight × sub-score).
- Cash flow +30.0/30.0
- 1% rule +10.0/10.0
- DSCR +10.0/10.0
- ARV discount +7.5/15.0
- Livability +3.2/5.0
- Rent growth +2.5/5.0
- Condition / age +2.5/5.0
- Schools +2.2/10.0
- Appreciation +0.0/10.0
$44,999
🖨 Deal sheet (PDF) 📄 Offer letter ✓ Due diligence
Multi-family units
County records classify this as Multi-Family (5+ Unit). Listing-text estimate: 1 unit. estimate disagrees with records
5+ unit building — per-unit beds/baths from public records are typically unavailable; the breakdown below (if shown) is an estimate from the listing text.
Listing remarks MLS
Redevelopment opportunity in a high-traffic location. Previously used as a duplex, this property offers flexible potential for residential or commercial use. Located near an auto dealership with excellent street exposure. Sold as-is. Investors welcome!!
Key facts
- 0.37 acre lot
- Parking
- Listed 18 days
Tags
Neighborhood map
What this means for you Summary
Snapshot
- This is a 4-bed/2.0-bath multifamily listed at $45k.
Deal economics
- At list price, monthly cash flow is $792 ($10k/yr) — positive.
- The deal already cash-flows at list — no discount required.
- Meets the 1% rule at list price ($1k rent vs $45k).
- Recommended offer: $44k (1.5% below list) — sets the bar for market timing.
- Cap rate 27.4% vs local median 4.0% in Opelousas — top-decile yield for the area; either an underpriced asset or a hidden risk that comps aren't pricing in. Stress-test before assuming the spread holds.
Location & tenants
- Location reads 63/100 on livability (#187 in LA) — a middle-class / working-renter tenant base. Strengths: cost of living A+, housing A+, health & safety A+; Watch: crime F, amenities F, commute F.
- St. Landry Parish (town): math 20% / reading 33% proficiency, ranked #54 of 98 in LA (top 55%) — low school quality limits family demand, transient renter base, plan for 1-2y turnover; 73% free/reduced lunch — lower-income household profile, screen leases tightly.
- Zoned schools: Opelousas Middle School (math 5% / reading 16%, grade F, #197 of 218 statewide, top 91%, 246 students, 92% FRL); Opelousas Junior High School (math 4% / reading 12%, grade F, #205 of 218 statewide, top 94%, 456 students, 84% FRL); Opelousas Senior High School (math 11% / reading 18%, grade F, #224 of 265 statewide, top 86%, 840 students, 77% FRL).
- Zoned-school proficiency averages 11% at this address vs 26% district-wide (-16 pts) — the specific schools serving this property underperform the St. Landry Parish average; the district grade overstates school quality for this exact location.
- Market conditions: 313 active listings in the ZIP; 142 units permitted in St. Landry Parish in 2024 (0 in 5+ unit buildings).
Forward outlook
- Local home prices are declining (-3.0%/yr); year-one equity from $311 of loan paydown is wiped out by about $1k of value loss. Plan a longer hold.
- St. Landry County population projected to shrink 9% by 2050 — rents likely to lag national; underwrite the cash flow, not the appreciation.
- At projected returns (-3.0% appreciation + 3.0% rent growth), your $13k cash investment doubles in ~2 years — after that, you're playing with house money.
Negotiation context
- It's been on market 18 days — a 2% lower offer ($44k) is reasonable based on typical stale-listing flexibility.
- 3 sale attempts since 17y ago; this cycle's ask has dropped $10k (18%) from the opening price — seller is motivated, your offer sets the floor, not the list.
Questions for the listing agent
- Is there a deadline driving the sale (1031 exchange, divorce, estate, relocation)? That informs how much negotiation room exists.
- Crime grade is F in this area — have there been break-ins, vandalism, or insurance claims at this property in the last 3 years? What carrier currently insures it and at what premium?
- What's the average days-on-market for RENTAL listings here right now (not sales)? A rising rental-DOM trend means longer vacancies and softer asking-rent achievability than the comps imply.
- What's the recent tenant-quality profile in this submarket — average credit score on applications, eviction rate, late-payment / NSF rate, and stable-employment percentage? A property-management company in the area should have these aggregated.
- How much new apartment / multifamily construction is in the pipeline within 1–3 miles? Heavy new supply (>2% of stock underway) typically softens rents 12–24 months out; light construction supports rent growth.
Investment metrics
- 1% rule
- 3.14% ✓
- Cap rate
- 27.42%
- Cash-on-cash
- 75.46%
- DSCR
- 4.36
- GRM
- 2.7
CMA / ARV
- ARV (median comp)
- $362,207
- List price
- $44,999
- Delta
- -87.58%
- Verdict
- UNDERPRICED
- Comps
- 2 within 1.0 mi
Projected returns pro-forma
-3.0% appreciation · 3.0% rent growth · sell at horizon
- IRR
- 75.4%
- Equity multiple
- 4.43×
- Total profit
- $43,201
- Equity at exit
- $6,709
- IRR
- 79.1%
- Equity multiple
- 9.15×
- Total profit
- $102,718
- Equity at exit
- $3,891
Cash invested: $12,600 (down + closing). Projections, not guarantees.
Landlord ↔ Tenant lean methodology
- Overall (STATE)
- 90 Strongly Landlord-Friendly
- State Louisiana
- 90 Strongly Landlord-Friendly · R+12
- County
- — inherits STATE
- City
- — inherits STATE
ZIP-level market 70570
- Home prices YoY
- -34.7%
- Active inventory
- 313
- Price-to-rent
- 2.7×
Monthly cashflow live
- Estimated rent
- $1,413 medium interval (Pro) →
- Mortgage (P&I)
- −$236
- Tax from tax record
- −$70 /mo · $834/yr
- Insurance
- −$19
- HOA
- −$0
- Vacancy / Maint / Mgmt
- −$297
- Net cashflow
- $792
Break-even live
Sensitivity live
| Price | -10% $818 | -5% $805 | +0% $792 | +5% $780 | +10% $767 |
|---|---|---|---|---|---|
| Rent | -10% $681 | -5% $736 | +0% $792 | +5% $848 | +10% $904 |
| Rate | -1.0pp $815 | -0.5pp $804 | base $792 | +0.5pp $781 | +1.0pp $769 |
UW: 25.0% down · 7.5% · 30yr · 1.5% tax · 5.0% vac · 8.0% maint · 8.0% mgmt
Financing live
Cash to close
- Down payment
- $11,250
- Closing costs
- $1,350
- Reserves months
- —
- Total cash needed
- —
Loan-product check · same deal, 3 products live
Conventional
25% down · 7.5% · 30yr
- Down + closing
- —
- Monthly P&I
- —
- Monthly cashflow
- —
- DSCR
- —
- Eligible?
- —
Personal DTI + credit; lowest rate.
DSCR
20% down · 8.5% · 30yr
- Down + closing
- —
- Monthly P&I
- —
- Monthly cashflow
- —
- DSCR
- —
- Eligible?
- —
No personal income docs; deal must DSCR.
Hard money
10% down · 12.0% · 12mo
- Down + closing
- —
- Monthly P&I
- —
- Monthly cashflow
- —
- DSCR
- —
- Eligible?
- —
Short-term bridge; refi at stabilization.
Listing history 9 events
-
2026-06-17remarks 214-char remark
-
2026-05-04status Pending 253-char remark
Show marketing remark (188 chars)
Investor Special!! Redevelopment opportunity in a high-traffic location. Previously used as a duplex, this property offers flexible potential for residential or commercial use. Sold as-is.
-
2026-05-04status Pending 188-char remark
Show marketing remark (188 chars)
Investor Special!! Redevelopment opportunity in a high-traffic location. Previously used as a duplex, this property offers flexible potential for residential or commercial use. Sold as-is.
-
2026-04-20price $44,999 188-char remark
Show marketing remark (188 chars)
Investor Special!! Redevelopment opportunity in a high-traffic location. Previously used as a duplex, this property offers flexible potential for residential or commercial use. Sold as-is.
-
2026-04-17price $44,999 253-char remark
Show marketing remark (253 chars)
Redevelopment opportunity in a high-traffic location. Previously used as a duplex, this property offers flexible potential for residential or commercial use. Located near an auto dealership with excellent street exposure. Sold as-is. Investors welcome!!
-
2026-04-16$54,999 Active 188-char remark
Show marketing remark (188 chars)
Investor Special!! Redevelopment opportunity in a high-traffic location. Previously used as a duplex, this property offers flexible potential for residential or commercial use. Sold as-is.
-
2026-04-07$54,999 Active 253-char remark
Show marketing remark (253 chars)
Redevelopment opportunity in a high-traffic location. Previously used as a duplex, this property offers flexible potential for residential or commercial use. Located near an auto dealership with excellent street exposure. Sold as-is. Investors welcome!!
-
2014-05-08soldstatus $175,000
-
2009-08-24$85,000
ⓘ Source: listings_history table (triggers on properties + properties_extension) + one-shot
backfill from property_details.listing_events for pre-trigger history.
Tax reassessment forecast LA · Resets to sale price
- Current annual tax
- $834 · $70/mo
- Projected year-2 tax
- $834 · $70/mo
- Expected delta
- $0/yr ($0/mo · 0.0%)
ⓘ Screening estimate from a state-policy table — verify with the county assessor before closing.
Nearby sold comps map
Loading sold comps map…
Walkable amenities ~0.75 mi
Loading nearby amenities…
Taxation est. · year 1
- Rental income
- $16,961
- − Mortgage interest
- −$2,521
- − Property taxes
- −$834
- − Insurance
- −$225
- − Repairs & maintenance
- −$1,357
- − Management
- −$1,357
- − Depreciation
- −$1,309
- Taxable income
- $9,358
- Est. tax owed @ 24.0%
- −$2,246
- After-tax cash flow
- $7,262/yr
For passive investors: Depreciation is non-cash, so a rental often shows a tax loss while cash-flowing — sheltering income. Rental losses are passive: they offset passive income freely, and up to $25,000/yr can offset ordinary (W-2) income if you actively participate and your MAGI is under $100k (phasing out to $0 by $150k); unused losses carry forward. On sale, claimed depreciation is recaptured at up to 25%, and gains may owe capital-gains tax (a 1031 exchange can defer both). Figures are a year-1 estimate at your 24.0% rate — not tax advice; consult a CPA.
Schools (NCES district)
- District
- St. Landry Parish
- NCES district ID
- 2201560
- Math proficiency
- 20% ▼ -43.00%
- Reading proficiency
- 33% ▼ -35.00%
- Median HH income
- $32,635
- Composite
- 21.59/100
- National rank
- #8303
- State rank
- #54 of 98 in LA
Livability — Opelousas
- Score
- 63/100
- State rank
- #187
- US rank
- #14928
Category grades
Schools grade is shown separately in the Schools card above.
Census & demographics
- Census place
- Opelousas, LA
- Population (ZIP)
- 37,188
Population outlook (St. Landry County) Hauer SSP2
- Today (2025)
- 83,114 people
- By 2030
- 82,110 · -1.2%
- By 2040
- 79,445 · -4.4%
- By 2050
- 75,855 · -8.7%
- By 2075
- 65,684 · -21.0%
- By 2100
- 51,739 · -37.7%
Race, ethnicity, and origin ACS 2023
- Neighborhood character
- Diverse neighborhood (Simpson 0.56)
- Race & ethnicity
- Black 55% White 37% Two or more races 4% Hispanic / Latino 4%
- Common ancestry
- Lithuanian 8%
- Foreign-born
- 1% · Canada
- Languages at home
- 92% English-only · French/Haitian/Cajun 5% Spanish 3%
Political lean MEDSL · St. Landry
- 2024 margin
- R (+18.8) · D 40.0% · R 58.9% · Other 1.1%
- 2008→2024 swing
- -15.6pp toward R · 2008: -3.2pp · 2024: -18.8pp
- All cycles
- 2024: R+18.8 2020: R+14.1 2016: R+11.9 2012: R+4.3 2008: R+3.2
Not yet ingested
- Civics
- —
Market trends
- HPI YoY
- ▼ -52.38%
- Current HPI
- 98.4256
- Rent YoY
- —
- Metro
- —
- State GDP YoY
- ▲ 3.29%
- F500 in state
- 10
Industry mix (Fortune 500 HQ in LA)
| Industry | F500 HQs | Revenue |
|---|---|---|
| Telecommunications | 2 | $23B |
|
||
| Utilities | 1 | $12B |
|
||
| Wholesale / Distribution | 1 | $5B |
|
||
| Advertising | 1 | $2B |
|
||
Price history
-47.1% since first listed8 events — show timeline
- 2026-05-04 Pending — AcadianaMLS
- 2026-05-04 Pending — AcadianaMLS
- 2026-04-20 Price Changed $44,999 AcadianaMLS
- 2026-04-17 Price Changed $44,999 AcadianaMLS
- 2026-04-16 Listed $54,999 AcadianaMLS
- 2026-04-07 Listed $54,999 AcadianaMLS
- 2014-05-08 Sold (Public Records) $175,000 Public Records
- 2009-08-24 Listed $85,000 AcadianaMLS
Property tax history
+3.9%/yrLatest (2025): $834 · +0.0% YoY. Source: county tax records.
Cash-flow waterfall
monthlySold comps — $/sqft
last 12 mo · ≤1 miLoading sold comps…