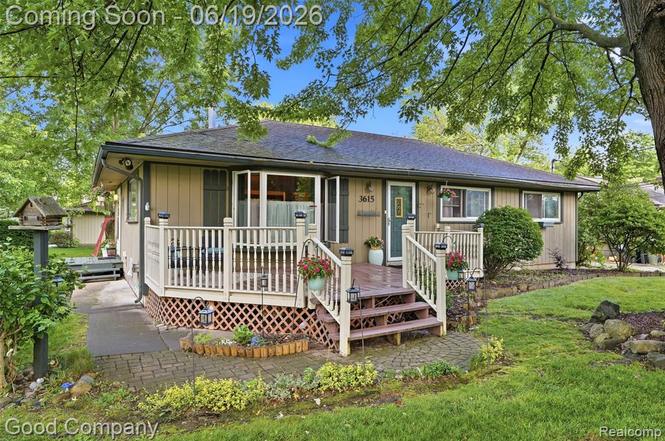
3615 Hazelton Ave · Rochester Hills, MI
Flood risk 1/10 · Minimal
- FEMA flood zone
- X (unshaded)
- Chance of flooding over 30 yrs
- 0.0%
- Est. flood insurance / yr
- $473 – $860
Fire risk 1/10 · Minimal
- Est. fire insurance / yr
- $784 – $1,456
Heat risk 2/10 · Minimal
- Hot days now (above 97°F)
- 7 days/yr
- Hot days in 30 yrs
- 15 days/yr
Wind risk 2/10 · Minimal
- Chance of severe wind over 30 yrs
- —
Air-quality risk 3/10 · Minor
- Unhealthy air days now
- 3 days/yr
- Unhealthy air days in 30 yrs
- 4 days/yr
Risk factors via First Street. Map © Google.
Why this score? — see what drove the F grade
The composite is a weighted blend of 9 inputs, each scored 0–100. Each bar is that input's sub-score; the figure is the points it added to the 100-point composite (weight × sub-score).
- Cash flow +13.3/30.0
- DSCR +4.0/10.0
- Livability +3.9/5.0
- 1% rule +3.7/10.0
- Schools +3.7/10.0
- Rent growth +2.9/5.0
- Condition / age +2.5/5.0
- ARV discount +0.0/15.0
- Appreciation +0.0/10.0
$299,900
🖨 Deal sheet (PDF) 📄 Offer letter ✓ Due diligence
Listing remarks
Welcome to this charming Rochester Hills ranch, offering 3 bedrooms, 2 full bathrooms, and a corner lot setting. With a functional layout, plenty of living space, and room to make it your own, this home is ready for its next chapter. The main level features a bright living room, a charming kitchen with dining space, three bedrooms, and a full bathroom. The partially finished basement adds additional living space, a second full bath, bonus room, laundry area, and plenty of storage. Whether you're hosting family and friends, working from home, or simply looking for extra room to spread out, this home offers the flexibility to fit your lifestyle. Don't miss this opportunity to call this place
Key facts
- 0.26 acre lot
- Built 1958
- Listed 2 days
Property features AI
Finance
- Other: Property type: Residential; Lot size approx. 0.26 acre
Exterior
- Parking: No parking details provided
- Security: No security features listed
- Utilities: Public water; Natural gas
- Home design: Residential, single-story; Built in 1958; Facing/frontage approximately 112'
- Construction: Wood exterior; Foundation: basement and piers
- Exterior features: Deck; Patio; Porch; Paved street access
Interior
- Kitchen: Dishwasher; Range/Oven; Refrigerator
- Bedrooms: Bedroom 1 (Entry): 12 x 14, vinyl flooring; Bedroom 2 (Entry): 12 x 11, wood flooring; Bedroom 3 (Entry): approx. 10' wide, wood flooring
- Flooring: Vinyl and wood flooring throughout; ceramic in lower-level bathroom
- Bathrooms: 2 full bathrooms; Bathroom 1 (Entry): approx. 9 x 10, wood flooring; Bathroom 2 (Basement): approx. 11 x 7, ceramic flooring
- Heating & cooling: Natural gas heat; Baseboard hot water heating
- Interior features: Total of 5 rooms; Unfinished basement
- Laundry & utility: Basement present (unfinished)
Neighborhood map
What this means for you Summary
Snapshot
- This is a 3-bed/1.0-bath single-family listed at $300k.
Deal economics
- At list price, monthly cash flow is $-2 ($-24/yr) — negative.
- To cash-flow at today's rent, offer at most $300k (0.1% below list).
- To meet the 1% rule (rent ≥ 1% of price), the offer needs to be $262k (12.6% below list).
- Recommended offer: $262k (12.6% below list) — sets the bar for 1% rule.
- Cap rate 6.3% vs local median 2.8% in Rochester Hills — top-decile yield for the area; either an underpriced asset or a hidden risk that comps aren't pricing in. Stress-test before assuming the spread holds.
Location & tenants
- Location reads 77/100 on livability (#127 in MI, #3,163 nationally) — a middle-class / working-renter tenant base. Strengths: crime A+, employment A+, housing A+; Watch: health & safety D, amenities F, commute F.
- Avondale School District (suburban): math 34% / reading 48% proficiency, ranked #162 of 540 in MI (top 30%) — families likely to look elsewhere, expect single-tenant / working-renter base with shorter leases.
- Zoned schools: Woodland Elementary School (math 22% / reading 42%, grade F, #814 of 1,397 statewide, top 61%, 352 students, 35% FRL); Avondale Middle School (math 30% / reading 43%, grade F, #264 of 493 statewide, top 54%, 630 students, 58% FRL); Avondale High School (math 37% / reading 67%, grade D+, #128 of 713 statewide, top 19%, 1,004 students, 48% FRL) — zoned schools average 47% FRL vs 28% district-wide (19 pts higher); higher-poverty schools than district average — tighter screening recommended.
- Market conditions: Rents rising (+1.8%/yr); 216 active listings in the ZIP; 6 comparable units currently listed for rent nearby; rentals leasing fast (median 5d on market — plan ~1-2 weeks tenant-placement turnaround); solid renter incomes; 2,614 units permitted in Oakland County in 2024 (721 in 5+ unit buildings).
Forward outlook
- Local home prices are declining (-3.0%/yr); year-one equity from $2k of loan paydown is wiped out by about $9k of value loss. Plan a longer hold.
- Oakland County population projected at +10% by 2050 — modest demand growth; plan on rents tracking national, not racing it.
Negotiation context
- Only 3 days on market — expect competitive offers; lowballing is unlikely to land.
- 4 sale attempts since 23y ago with the ask held roughly flat each time — persistent listings suggest the price (not the market) is what's stuck; bring a comps-based counter.
- Current owner paid $174k; list at $300k implies a 72% gain — meaningful room to come down on a strong offer.
Risks & watch-outs
- Watch-outs: built in 1958 — expect roof / HVAC / electrical / plumbing capex.
Questions for the listing agent
- What do current leases actually rent for vs. the listed asking? Can we see a recent rent roll and the last 12 months of T-12 income?
- Built in 1958 — when were the roof, HVAC, electrical panel, plumbing, and water heater last replaced?
- Is there a deadline driving the sale (1031 exchange, divorce, estate, relocation)? That informs how much negotiation room exists.
- Schools are A-rated — typically a magnet for longer-tenancy family renters. What's the average tenant stay here, and is there a school-zone premium baked into asking?
- The area grade is low — what's the realistic commute time and amenity access for the typical tenant pool here? Any planned neighborhood developments (good or bad) we should know about?
- What's the average days-on-market for RENTAL listings here right now (not sales)? A rising rental-DOM trend means longer vacancies and softer asking-rent achievability than the comps imply.
- What's the recent tenant-quality profile in this submarket — average credit score on applications, eviction rate, late-payment / NSF rate, and stable-employment percentage? A property-management company in the area should have these aggregated.
- How much new for-sale + rental construction is in the pipeline within 1–3 miles? Heavy new supply typically softens prices + rents 12–24 months out; constrained supply supports both.
Investment metrics
- 1% rule
- 0.87% ✗
- Cap rate
- 6.29%
- Cash-on-cash
- -0.03%
- DSCR
- 1.00
- GRM
- 9.5
CMA / ARV
- ARV (on-the-fly)
- $238,004
- Comps found
- 10
Show comp detail 10 sales within ~0.75 mi
| Address | Dist | Beds/Ba | Sqft | Sold | Price | $/sf | Match |
|---|---|---|---|---|---|---|---|
| 3681 Orchard View Ave | 0.12mi | 2/1.0 (-1) | 1,158 (-3%) | 13mo | $230,000 | $199 | 73 |
| 3794 Hazelton Ave | 0.20mi | 3/1.5 | 1,280 (+7%) | 9mo | $232,650 | $182 | 70 |
| 3480 Hazelton Ave | 0.34mi | 3/1.0 | 1,104 (-8%) | 9mo | $275,000 | $249 | 64 |
| 819 Francis St | 0.55mi | 3/1.0 | 1,214 (+2%) | 19mo | $190,000 | $157 | 56 |
| 322 Michelson Rd | 0.63mi | 3/1.0 | 1,292 (+8%) | 8mo | $219,999 | $170 | 51 |
| 920 Grace Ave | 0.67mi | 3/1.5 | 1,296 (+8%) | 5mo | $313,000 | $242 | 48 |
| 351 North Squirrel Rd #205 Rd | 0.49mi | 3/2.0 | 1,056 (-12%) | 6mo | $43,000 | $41 | 48 |
| 135 Eastlawn Dr | 0.47mi | 3/1.0 | 1,040 (-13%) | 16mo | $268,900 | $259 | 43 |
| 735 Grace Ave | 0.51mi | 3/2.0 | 1,342 (+12%) | 22mo | $266,000 | $198 | 34 |
| 896 Grace Ave | 0.65mi | 2/1.0 (-1) | 1,030 (-14%) | 15mo | $242,500 | $235 | 29 |
Match score weights: distance 35% · size 25% · config 20% · recency 20%. Top-matched comps best support the ARV.
Projected returns pro-forma
-3.0% appreciation · 1.78% rent growth · sell at horizon
- IRR
- -17.7%
- Equity multiple
- 0.38×
- Total profit
- $-51,861
- Equity at exit
- $44,716
- IRR
- -12.3%
- Equity multiple
- 0.31×
- Total profit
- $-57,887
- Equity at exit
- $25,930
Cash invested: $83,972 (down + closing). Projections, not guarantees.
Landlord ↔ Tenant lean methodology
- Overall (STATE)
- 62 Landlord-Friendly
- State Michigan
- 62 Landlord-Friendly · EVEN
- County
- — inherits STATE
- City
- — inherits STATE
ZIP-level market 48307
- Rents YoY
- 1.8%
- Active inventory
- 216
- Price-to-rent
- 9.5×
Monthly cashflow live
- Estimated rent
- $2,621 high interval (Pro) →
- Mortgage (P&I)
- −$1,573
- Tax est. 1.5%
- −$375 /mo · $4,498/yr
- Insurance
- −$125
- HOA
- −$0
- Vacancy / Maint / Mgmt
- −$550
- Net cashflow
- $-2
Break-even live
Sensitivity live
| Price | -10% $205 | -5% $102 | +0% $-2 | +5% $-106 | +10% $-209 |
|---|---|---|---|---|---|
| Rent | -10% $-209 | -5% $-105 | +0% $-2 | +5% $102 | +10% $205 |
| Rate | -1.0pp $149 | -0.5pp $74 | base $-2 | +0.5pp $-80 | +1.0pp $-159 |
UW: 25.0% down · 7.5% · 30yr · 1.5% tax · 5.0% vac · 8.0% maint · 8.0% mgmt
Financing live
Cash to close
- Down payment
- $74,975
- Closing costs
- $8,997
- Reserves months
- —
- Total cash needed
- —
Loan-product check · same deal, 3 products live
Conventional
25% down · 7.5% · 30yr
- Down + closing
- —
- Monthly P&I
- —
- Monthly cashflow
- —
- DSCR
- —
- Eligible?
- —
Personal DTI + credit; lowest rate.
DSCR
20% down · 8.5% · 30yr
- Down + closing
- —
- Monthly P&I
- —
- Monthly cashflow
- —
- DSCR
- —
- Eligible?
- —
No personal income docs; deal must DSCR.
Hard money
10% down · 12.0% · 12mo
- Down + closing
- —
- Monthly P&I
- —
- Monthly cashflow
- —
- DSCR
- —
- Eligible?
- —
Short-term bridge; refi at stabilization.
Rent comps 6 comps
| Address | Beds | Baths | Sqft | Rent | $/sqft | DOM | Units | Dist |
|---|---|---|---|---|---|---|---|---|
| 3465 Hazelton Ave Rochester Hills, MI | 3.0 | 1.5 | 1240 | $3,690 | $2.98 | 4d | 1 | 0.45mi |
| 1128 Alameda Blvd Unit 1128 Troy, MI | 2.0 | 2.0 | 1457 | $2,150 | $1.48 | 23d | 1 | 0.80mi |
| 2800 Overlook Dr Rochester Hills, MI | 1.0–2.0 | 1.0–2.0 | 853 | $1,833 | $2.15 | 1d | 12 | 1.02mi |
| 2740 Upper Ridge Dr Rochester Hills, MI | 2.0 | 2.0 | 1093 | $3,480 | $3.18 | 4d | 1 | 1.15mi |
| 1070 Villa Park Dr Troy, MI | 3.0 | 1.5 | 1200 | $1,748 | $1.46 | 1d | 3 | 1.17mi |
| 501 Plymouth Ct #28 Rochester Hills, MI | 2.0 | 2.5 | 1416 | $2,450 | $1.73 | 1d | 1 | 1.23mi |
Listing history 3 events
-
2026-06-21statusdays on market $299,900 Active 3 DOM
-
2026-06-18remarks 699-char remark
-
2026-06-18$299,900 Coming Soon 1 DOM
ⓘ Source: listings_history table (triggers on properties + properties_extension) + one-shot
backfill from property_details.listing_events for pre-trigger history.
Climate risk First Street
- Flood 1/10 Low FEMA zone X (unshaded) · 0% chance over 30 yrs
- Wildfire 1/10 Low
- Heat 2/10 Low 7 d/yr ≥97°F today · 15 d/yr by 30 yrs out
- Wind 2/10 Low
- Air quality 3/10 Moderate 3 unhealthy d/yr today · 4 by 30 yrs out
Nearby sold comps map
Loading sold comps map…
Walkable amenities ~0.75 mi
Loading nearby amenities…
Taxation est. · year 1
- Rental income
- $31,452
- − Mortgage interest
- −$16,799
- − Property taxes
- −$4,498
- − Insurance
- −$1,500
- − Repairs & maintenance
- −$2,516
- − Management
- −$2,516
- − Depreciation
- −$8,724
- Taxable loss
- −$5,102
- Est. tax savings @ 24.0%
- +$1,224
- After-tax cash flow
- $1,201/yr
For passive investors: Depreciation is non-cash, so a rental often shows a tax loss while cash-flowing — sheltering income. Rental losses are passive: they offset passive income freely, and up to $25,000/yr can offset ordinary (W-2) income if you actively participate and your MAGI is under $100k (phasing out to $0 by $150k); unused losses carry forward. On sale, claimed depreciation is recaptured at up to 25%, and gains may owe capital-gains tax (a 1031 exchange can defer both). Figures are a year-1 estimate at your 24.0% rate — not tax advice; consult a CPA.
Schools (NCES district)
- District
- Avondale School District
- NCES district ID
- 2603690
- Math proficiency
- 34% ▼ -8.00%
- Reading proficiency
- 48% ▼ -4.00%
- Median HH income
- $71,549
- Composite
- 37.33/100
- National rank
- #4442
- State rank
- #162 of 540 in MI
Livability — Rochester Hills
- Score
- 77/100
- State rank
- #127
- US rank
- #3163
Category grades
Schools grade is shown separately in the Schools card above.
Census & demographics
- Census place
- Rochester Hills, MI
- County
- Oakland County · 1,009,092 people
- City population
- 44,714
- Metro
- Detroit-Warren-Dearborn, MI
- Population (ZIP)
- 44,714
- Household income
- $106,576
- Rent vs Own
- Severe rent burden
- 926.0
Population outlook (Oakland County) Hauer SSP2
- Today (2025)
- 1,335,747 people
- By 2030
- 1,375,100 · +2.9%
- By 2040
- 1,435,385 · +7.5%
- By 2050
- 1,469,250 · +10.0%
- By 2075
- 1,531,946 · +14.7%
- By 2100
- 1,450,485 · +8.6%
Race, ethnicity, and origin ACS 2023
- Neighborhood character
- Predominantly White (74%)
- Race & ethnicity
- White 74% Asian 14% Two or more races 6% Black 4% Hispanic / Latino 4%
- Common ancestry
- Romanian 9% Lithuanian 3% Slovak 2%
- Foreign-born
- 19% · Canada, China, South Korea
- Languages at home
- 76% English-only · Other Indo-European 9% Spanish 3% Arabic 2%
Political lean MEDSL · Oakland
- 2024 margin
- D (+10.6) · D 54.4% · R 43.8% · Other 1.9%
- 2008→2024 swing
- -3.9pp toward R · 2008: 14.5pp · 2024: 10.6pp
- All cycles
- 2024: D+10.6 2020: D+14.1 2016: D+8.1 2012: D+8.1 2008: D+14.5
Not yet ingested
- Civics
- —
Market trends
- HPI YoY
- ▼ -339.13%
- Current HPI
- 188.8794
- Rent YoY
- ▲ 1.78%
- Metro
- Detroit-Warren-Dearborn, MI
- State GDP YoY
- ▲ 1.37%
- F500 in state
- 28
Industry mix (Fortune 500 HQ in MI)
| Industry | F500 HQs | Revenue |
|---|---|---|
| Automotive Parts | 3 | $48B |
|
||
| Automotive | 2 | $372B |
|
||
| Chemicals | 1 | $45B |
|
||
| Automotive Retail | 1 | $29B |
|
||
| Healthcare / Medical Devices | 1 | $23B |
|
||
| Automotive Technology | 1 | $20B |
|
||
Price history
+2399.2% since first listed15 events — show timeline
- 2026-06-17 Coming Soon $299,900 MiRealSource-MiMLS
- 2025-12-08 Listing Removed — MiRealSource-MiMLS
- 2025-10-15 Price Changed $307,500 MiRealSource-MiMLS
- 2025-10-15 Price Changed $307,500 REALCOMP
- 2025-09-06 Listed $315,000 MiRealSource-MiMLS
- 2025-09-06 Listed $315,000 REALCOMP
- 2025-09-04 Coming Soon — MiRealSource-MiMLS
- 2004-01-27 Sold (Public Records) $174,000 Public Records
- 2003-11-21 Sold (MLS) $174,000 MiRealSource-MiMLS
- 2003-11-21 Sold (MLS) $174,000 REALCOMP
- 2003-10-07 Listing Removed — MiRealSource-MiMLS
- 2003-07-07 Listed $179,900 REALCOMP
- 2003-06-10 Listed $179,900 MiRealSource-MiMLS
- 1996-01-24 Sold (Public Records) $70,000 Public Records
- 1987-03-01 Sold (Public Records) $12,000 Public Records
Property tax history
-34.0%/yrLatest (2025): $35 · -96.6% YoY. Source: county tax records.
Cash-flow waterfall
monthlySold comps — $/sqft
last 12 mo · ≤1 miLoading sold comps…