 🔨 Auction
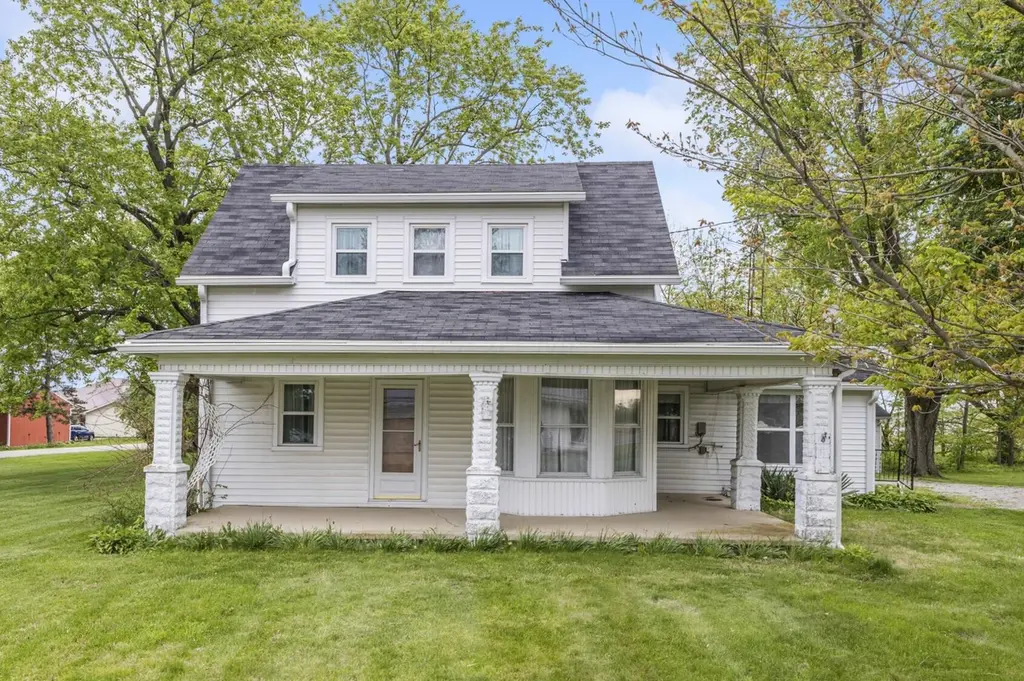
4002 Radnor Rd · Radnor, OH
Flood risk 1/10 · Minimal
- FEMA flood zone
- X (unshaded)
- Chance of flooding over 30 yrs
- 0.0%
- Est. flood insurance / yr
- $507 – $1,088
Fire risk 1/10 · Minimal
- Est. fire insurance / yr
- $713 – $1,323
Heat risk 3/10 · Minor
- Hot days now (above 99°F)
- 7 days/yr
- Hot days in 30 yrs
- 18 days/yr
Wind risk 2/10 · Minimal
- Chance of severe wind over 30 yrs
- 1.0%
Air-quality risk 2/10 · Minimal
- Unhealthy air days now
- 0 days/yr
- Unhealthy air days in 30 yrs
- 1 days/yr
Risk factors via First Street. Map © Google.
Why this score? — see what drove the F grade
The composite is a weighted blend of 9 inputs, each scored 0–100. Each bar is that input's sub-score; the figure is the points it added to the 100-point composite (weight × sub-score).
- Cash flow +7.9/30.0
- ARV discount +7.5/15.0
- Schools +5.6/10.0
- Livability +2.8/5.0
- Rent growth +2.5/5.0
- 1% rule +2.4/10.0
- Condition / age +2.2/5.0
- DSCR +2.0/10.0
- Appreciation +0.0/10.0
$1
🖨 Deal sheet (PDF) 📄 Offer letter ✓ Due diligence
Listing remarks
Auction June 18th at 6PM - Set on a spacious 2.5+ acre corner lot in Radnor, this 3-bedroom, 1.5-bath home offers the perfect blend of comfort and country living. Relax on the large front porch while taking in the peaceful rural surroundings, with plenty of room to expand, entertain, or simply enjoy the open space. The property also features an additional detached two-car garage with a workshop, ideal for hobbies, storage, or extra workspace. Conveniently located just 5 minutes from U. S. Route 23 and only 10 minutes from Delaware. Terms: The property sells with Trustee's Confirmation in AS-IS condition. A $10,000 non-refundable down payment is due auction day with balance due at closing wi
Key facts
- Large front porch
- Spacious corner lot
- Workshop
Tags
Property features AI
Finance
- Other: Property offered via auction and standard listing
- Financial info: Taxes listed for 2025
Exterior
- Parking: Detached 2-car garage with garage door opener
- Utilities: Public water; Private sewer
- Home design: Single family residence; Two levels; No shared/common walls; Originally built in 1901
- Construction: Block foundation; Built in 1901
- Exterior features: Block foundation; Lot of about 2.76 acres
Interior
- Bedrooms: One bedroom on the main level
- Bathrooms: One full bathroom; One half bathroom
- Interior features: Living area approximately 1,413
Neighborhood map
What this means for you Summary
Snapshot
- This is a 3-bed/1.5-bath single-family listed at $1. Condition is rated fair.
Deal economics
- At list price, monthly cash flow is $-281 ($-3k/yr) — negative.
- The deal already cash-flows at list — no discount required.
- Meets the 1% rule at list price ($2k rent vs $1).
Location & tenants
- Location reads 55/100 on livability (#1,136 in OH) — a working-class tenant base; expect higher turnover. Strengths: cost of living A+, crime A, employment B; Watch: amenities F, commute F, housing F.
- Buckeye Valley Local (rural): math 57% / reading 68% proficiency, ranked #203 of 656 in OH (top 31%) — acceptable for families but not a draw, mixed tenant base, ~2y average lease; only 20% free/reduced lunch — higher-income household profile.
- Zoned schools: Buckeye Valley East Elementary School (math 47% / reading 57%, grade C-, #851 of 1,584 statewide, top 56%, 422 students, 28% FRL); Buckeye Valley Local Middle School (math 51% / reading 63%, grade B, #305 of 654 statewide, top 48%, 451 students, 17% FRL); Buckeye Valley Local High School (math 57% / reading 77%, grade B, #137 of 781 statewide, top 19%, 654 students, 14% FRL) — zoned schools at 19% FRL track the district average.
- Market conditions: 7 active listings in the ZIP; 1 comparable units currently listed for rent nearby; high-income renter base; 2,233 units permitted in Delaware County in 2024 (304 in 5+ unit buildings).
Forward outlook
- Local home prices are declining (-3.0%/yr); year-one equity from $2k of loan paydown is wiped out by about $8k of value loss. Plan a longer hold.
- Delaware County population projected at +37% by 2050 — long-run rental-demand tailwind backs the buy-and-hold thesis.
Negotiation context
- It's been on market 36 days — a 3% lower offer ($0) is reasonable based on typical stale-listing flexibility.
Risks & watch-outs
- Watch-outs: property tax is 395346.5% of price; built in 1901 — expect roof / HVAC / electrical / plumbing capex.
Questions for the listing agent
- What do current leases actually rent for vs. the listed asking? Can we see a recent rent roll and the last 12 months of T-12 income?
- It's been on market 36 days. Have you received any prior offers? Is the seller open to a 5% concession, seller financing, or rate buy-down credit?
- Have any recent inspections been done? Can we get a copy of the seller's disclosures and any deferred-maintenance estimates?
- Built in 1901 — when were the roof, HVAC, electrical panel, plumbing, and water heater last replaced?
- Property tax is high relative to price — has the assessment been appealed recently, and will the sale trigger a re-assessment?
- Is there a deadline driving the sale (1031 exchange, divorce, estate, relocation)? That informs how much negotiation room exists.
- Schools are F-rated, which usually means shorter tenancies and higher turnover. Who's the typical renter profile here, and what's been the actual vacancy rate?
- The area grade is low — what's the realistic commute time and amenity access for the typical tenant pool here? Any planned neighborhood developments (good or bad) we should know about?
- What's the average days-on-market for RENTAL listings here right now (not sales)? A rising rental-DOM trend means longer vacancies and softer asking-rent achievability than the comps imply.
- What's the recent tenant-quality profile in this submarket — average credit score on applications, eviction rate, late-payment / NSF rate, and stable-employment percentage? A property-management company in the area should have these aggregated.
- How much new for-sale + rental construction is in the pipeline within 1–3 miles? Heavy new supply typically softens prices + rents 12–24 months out; constrained supply supports both.
Investment metrics
- 1% rule
- 0.74% ✗
- Cap rate
- 5.01%
- Cash-on-cash
- -4.57%
- DSCR
- 0.80
- GRM
- 11.3
CMA / ARV
- ARV (median comp)
- $263,564
- List price
- $1
- Delta
- -100.00%
- Verdict
- UNDERPRICED
- Comps
- 9 within 1.0 mi
Show comp detail 4 sales within ~0.75 mi
| Address | Dist | Beds/Ba | Sqft | Sold | Price | $/sf | Match |
|---|---|---|---|---|---|---|---|
| 4389 State Route 203 | 0.28mi | 3/2.0 | 1,326 (-6%) | 2mo | $149,600 | $113 | 72 |
| 4341 Main St | 0.31mi | 3/2.0 | 1,456 (+3%) | 9mo | $240,000 | $165 | 71 |
| 4005 OH-203 | 0.52mi | 3/2.0 | 1,589 (+12%) | 1mo | $429,900 | $271 | 52 |
| 4380 Baker St | 0.16mi | 2/1.0 (-1) | 1,234 (-13%) | 23mo | $241,500 | $196 | 45 |
Match score weights: distance 35% · size 25% · config 20% · recency 20%. Top-matched comps best support the ARV.
Projected returns pro-forma
-3.0% appreciation · 3.0% rent growth · sell at horizon
- IRR
- -24.0%
- Equity multiple
- 0.18×
- Total profit
- $-60,572
- Equity at exit
- $39,298
- IRR
- -19.2%
- Equity multiple
- -0.03×
- Total profit
- $-75,665
- Equity at exit
- $22,788
Cash invested: $73,798 (down + closing). Projections, not guarantees.
Landlord ↔ Tenant lean methodology
- Overall (STATE)
- 73 Landlord-Friendly
- State Ohio
- 73 Landlord-Friendly · R+6
- County
- — inherits STATE
- City
- — inherits STATE
ZIP-level market 43066
- Home prices YoY
- -18.1%
- Active inventory
- 7
Monthly cashflow live
- Estimated rent
- $1,950 medium interval (Pro) →
- Mortgage (P&I)
- −$1,382
- Tax est. 1.5%
- −$329 /mo · $3,953/yr
- Insurance
- −$110
- HOA
- −$0
- Vacancy / Maint / Mgmt
- −$410
- Net cashflow
- $-281
Break-even live
Sensitivity live
| Price | -10% $-99 | -5% $-190 | +0% $-281 | +5% $-372 | +10% $-463 |
|---|---|---|---|---|---|
| Rent | -10% $-435 | -5% $-358 | +0% $-281 | +5% $-204 | +10% $-127 |
| Rate | -1.0pp $-148 | -0.5pp $-214 | base $-281 | +0.5pp $-349 | +1.0pp $-419 |
UW: 25.0% down · 7.5% · 30yr · 1.5% tax · 5.0% vac · 8.0% maint · 8.0% mgmt
Financing live
Cash to close
- Down payment
- $65,891
- Closing costs
- $7,907
- Reserves months
- —
- Total cash needed
- —
Loan-product check · same deal, 3 products live
Conventional
25% down · 7.5% · 30yr
- Down + closing
- —
- Monthly P&I
- —
- Monthly cashflow
- —
- DSCR
- —
- Eligible?
- —
Personal DTI + credit; lowest rate.
DSCR
20% down · 8.5% · 30yr
- Down + closing
- —
- Monthly P&I
- —
- Monthly cashflow
- —
- DSCR
- —
- Eligible?
- —
No personal income docs; deal must DSCR.
Hard money
10% down · 12.0% · 12mo
- Down + closing
- —
- Monthly P&I
- —
- Monthly cashflow
- —
- DSCR
- —
- Eligible?
- —
Short-term bridge; refi at stabilization.
Rent comps 1 comps
| Address | Beds | Baths | Sqft | Rent | $/sqft | DOM | Units | Dist |
|---|---|---|---|---|---|---|---|---|
| 4030 Radnor Rd Radnor, OH | 3.0 | 2.0 | 1700 | $1,950 | $1.15 | 45d | 1 | 0.05mi |
Listing history 15 events
-
2026-06-19status $1 Pending 36 DOM
-
2026-06-18days on market $1 Active 36 DOM
-
2026-06-17days on market $1 Active 35 DOM
-
2026-06-16days on market $1 Active 34 DOM
-
2026-06-15days on market $1 Active 33 DOM
-
2026-06-13days on market $1 Active 31 DOM
-
2026-06-09days on market $1 Active 27 DOM
-
2026-06-08days on market $1 Active 26 DOM
-
2026-06-07days on market $1 Active 25 DOM
-
2026-06-05days on market $1 Active 22 DOM
-
2026-06-03days on market $1 Active 21 DOM
-
2026-06-02days on market $1 Active 20 DOM
-
2026-06-01days on market $1 Active 19 DOM
-
2026-05-31days on market $1 Active 18 DOM
-
2026-05-13$1 Active 1009-char remark
ⓘ Source: listings_history table (triggers on properties + properties_extension) + one-shot
backfill from property_details.listing_events for pre-trigger history.
Climate risk First Street
- Flood 1/10 Low FEMA zone X (unshaded) · 0% chance over 30 yrs
- Wildfire 1/10 Low
- Heat 3/10 Moderate 7 d/yr ≥99°F today · 18 d/yr by 30 yrs out
- Wind 2/10 Low 100% chance of damaging wind over 30 yrs
- Air quality 2/10 Low 0 unhealthy d/yr today · 1 by 30 yrs out
Nearby sold comps map
Loading sold comps map…
Walkable amenities ~0.75 mi
Loading nearby amenities…
Taxation est. · year 1
- Rental income
- $23,400
- − Mortgage interest
- −$14,764
- − Property taxes
- −$3,953
- − Insurance
- −$1,318
- − Repairs & maintenance
- −$1,872
- − Management
- −$1,872
- − Depreciation
- −$7,667
- Taxable loss
- −$8,046
- Est. tax savings @ 24.0%
- +$1,931
- After-tax cash flow
- $-1,440/yr
For passive investors: Depreciation is non-cash, so a rental often shows a tax loss while cash-flowing — sheltering income. Rental losses are passive: they offset passive income freely, and up to $25,000/yr can offset ordinary (W-2) income if you actively participate and your MAGI is under $100k (phasing out to $0 by $150k); unused losses carry forward. On sale, claimed depreciation is recaptured at up to 25%, and gains may owe capital-gains tax (a 1031 exchange can defer both). Figures are a year-1 estimate at your 24.0% rate — not tax advice; consult a CPA.
Condition & rehab AI · 30 photos
This home requires moderate renovations to update the kitchen and bathrooms, and paint the interior walls. The property has a good roof and foundation, and a decent exterior. Landscaping and curb appeal improvements would also enhance its value.
Repairs flagged
- Major kitchen flooring — dated and worn
- Major bathroom fixtures — outdated and worn
- Minor exterior siding — some discoloration
Value-add opportunities
- Resale update kitchen flooring — modern flooring improves curb appeal
- Resale update bathroom fixtures — modern fixtures improve functionality and appeal
- Both paint interior walls — fresh paint improves appearance and value
- Both landscaping — improved landscaping enhances curb appeal and value
Renovation cost estimate screening
| Repair item | Severity | Est. cost |
|---|---|---|
| kitchen flooring · dated and worn | Major | $15,000–50,000 |
| bathroom fixtures · outdated and worn | Major | $15,000–50,000 |
| exterior siding · some discoloration | Minor | $500–3,000 |
| Total estimated repair cost · 3 items | $30,500–103,000 |
Value-add ROI direction
- Resale update kitchen flooring — modern flooring improves curb appeal ↑
- Resale update bathroom fixtures — modern fixtures improve functionality and appeal ↑
- Both paint interior walls — fresh paint improves appearance and value ↑
- Both landscaping — improved landscaping enhances curb appeal and value ↑
ⓘ Cost ranges are severity-bucket heuristics (US national rule-of-thumb). Get contractor quotes + a written scope before underwriting a rehab budget.
Schools (NCES district)
- District
- Buckeye Valley Local
- NCES district ID
- 3904675
- Math proficiency
- 57% ▼ -15.00%
- Reading proficiency
- 68% ▼ -6.00%
- Median HH income
- $76,222
- Composite
- 55.61/100
- National rank
- #1232
- State rank
- #203 of 656 in OH
Livability — Radnor
- Score
- 55/100
- State rank
- #1136
- US rank
- #23578
Category grades
Schools grade is shown separately in the Schools card above.
Census & demographics
- Census place
- Radnor, OH
- County
- Delaware · 221,676 people
- Metro
- Columbus, OH
- Population (ZIP)
- 1,170
- Household income
- $110,333
- Rent vs Own
Population outlook (Delaware County) Hauer SSP2
- Today (2025)
- 230,854 people
- By 2030
- 249,294 · +8.0%
- By 2040
- 284,223 · +23.1%
- By 2050
- 315,314 · +36.6%
- By 2075
- 379,462 · +64.4%
- By 2100
- 403,158 · +74.6%
Race, ethnicity, and origin ACS 2023
- Neighborhood character
- Predominantly White (96%)
- Race & ethnicity
- White 96% Two or more races 4%
- Common ancestry
- Slovak 4% Serbian 3% Iranian 2%
Political lean MEDSL · Delaware
- 2024 margin
- Lean R (+6.6) · D 46.2% · R 52.8%
- 2008→2024 swing
- +13.0pp toward D · 2008: -19.6pp · 2024: -6.6pp
- All cycles
- 2024: R+6.6 2020: R+6.8 2016: R+16.1 2012: R+23.7 2008: R+19.6
Not yet ingested
- Civics
- —
Market trends
- HPI YoY
- ▼ -58.00%
- Current HPI
- 263.1657
- Rent YoY
- —
- Metro
- —
- State GDP YoY
- ▲ 1.98%
- F500 in state
- 48
Industry mix (Fortune 500 HQ in OH)
| Industry | F500 HQs | Revenue |
|---|---|---|
| Insurance | 3 | $145B |
|
||
| Industrial Machinery | 3 | $49B |
|
||
| Financial Services | 3 | $24B |
|
||
| Consumer Goods | 2 | $93B |
|
||
| Aerospace / Defense | 2 | $47B |
|
||
| Utilities | 2 | $33B |
|
||
Property tax history
+7.7%/yrLatest (2025): $2,016 · +1.0% YoY. Source: county tax records.
Cash-flow waterfall
monthlySold comps — $/sqft
last 12 mo · ≤1 miLoading sold comps…