340 Old Mill Rd #221 · Eastern Goleta Valley, CA
Flood risk 9/10 · Severe
- FEMA flood zone
- X (unshaded)
- Chance of flooding over 30 yrs
- 0.99%
- Est. flood insurance / yr
- $507 – $1,088
Fire risk 6/10 · Moderate
- Est. fire insurance / yr
- $659 – $1,223
Heat risk 7/10 · Major
- Hot days now (above 83°F)
- 11 days/yr
- Hot days in 30 yrs
- 30 days/yr
Wind risk 1/10 · Minimal
- Chance of severe wind over 30 yrs
- —
Air-quality risk 6/10 · Moderate
- Unhealthy air days now
- 10 days/yr
- Unhealthy air days in 30 yrs
- 10 days/yr
Risk factors via First Street. Map © Google.
Why this score? — see what drove the D grade
The composite is a weighted blend of 9 inputs, each scored 0–100. Each bar is that input's sub-score; the figure is the points it added to the 100-point composite (weight × sub-score).
- Cash flow +10.1/30.0
- ARV discount +7.5/15.0
- Appreciation +7.0/10.0
- Schools +5.0/10.0
- 1% rule +3.0/10.0
- DSCR +2.9/10.0
- Rent growth +2.5/5.0
- Livability +2.5/5.0
- Condition / age +2.5/5.0
$560,000
🖨 Deal sheet (PDF) 📄 Offer letter ✓ Due diligence
Listing remarks MLS
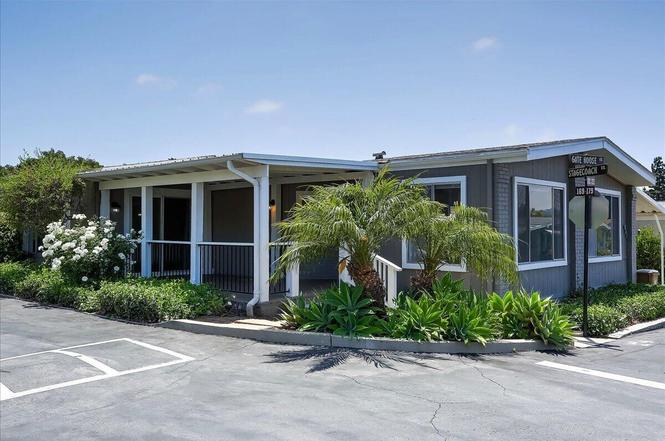
San Vicente Triplewide home on a corner lot with great mountain views! This gated community for adults 55+ has a year-round heated pool & spa, tennis & pickleball courts, clubhouse with library and private gym. This home offers over 1,650 sq. ft. of living space on one level. Front living & dining rooms with vaulted ceilings & mountain views. Spacious kitchen with breakfast bar opens to a large family room with sliding door to view deck. Primary suite with walk-in closet and bath with dual vanities. Second bedroom has its own access to guest bath. Separate laundry room. New storage building. Space rent is $779 per month and includes water, sewer, trash & recycling and use of all park amenities. Taxes just $122 per year to the buyer!!! Occupied, by appt. only.
Key facts
- Premium corner lot
- View deck
- Updated kitchen
Tags
Property features AI
Finance
- Other: Pets allowed with limitations
- HOA & community: Association present; Community amenities include pool, spa/hot tub, clubhouse, gym, tennis courts, game room, greenbelt, guest parking, and RV/boat storage; Association fees include water, trash, and common area maintenance
Exterior
- Parking: Attached carport with 3 carport spaces; Inside entrance; Attached garage
- Utilities: Private water system; Sewer hookup
- Home design: Contemporary style; Single-story; Triple-wide manufactured home (Golden West)
- Construction: Wood siding and other exterior materials; Composition roof; Pier and post foundation; Manufactured home dimensions approximately 24 + 8 ft wide by 60 ft long
- Exterior features: Drought-tolerant landscaping; Shed(s); Mountain and setting views; Level and sloped-up areas; Corner lot; Near public transit
Interior
- Kitchen: Refrigerator; Gas range / gas stove
- Bedrooms: Primary bedroom on the ground floor; Additional family room
- Flooring: Laminate flooring
- Bathrooms: 2 full bathrooms
- Interior features: In-unit laundry room with gas hookup
- Laundry & utility: Laundry room (in unit) with gas hookup
Neighborhood map
What this means for you Summary
Snapshot
- This is a 2-bed/2.0-bath manufactured listed at $560k.
Deal economics
- At list price, monthly cash flow is $-389 ($-5k/yr) — negative.
- To cash-flow at today's rent, offer at most $504k (10.1% below list).
- To meet the 1% rule (rent ≥ 1% of price), the offer needs to be $449k (19.8% below list).
- Recommended offer: $449k (19.8% below list) — sets the bar for 1% rule.
- Cap rate 5.6% vs local median 1.2% in Eastern Goleta Valley — top-decile yield for the area; either an underpriced asset or a hidden risk that comps aren't pricing in. Stress-test before assuming the spread holds.
Location & tenants
- Location reads: area grade D — affects rentability + tenant quality, not the cash-flow math above.
- Zoned schools: Hope Elementary (269 students, 43% FRL); La Colina Junior High (900 students, 42% FRL).
- Market conditions: 49 active listings in the ZIP; 3 comparable units currently listed for rent nearby; rentals at typical pace (median 16d on market — plan ~3-4 weeks tenant-placement turnaround); high-income renter base; 719 units permitted in Santa Barbara County in 2024 (217 in 5+ unit buildings).
- This rent runs 42% of the median local income ($129k/yr) — at the standard rent-burdened threshold; future hikes will face affordability resistance.
Forward outlook
- In year one you build about $26k of equity ($4k loan paydown + $22k appreciation (4.0% local appreciation)).
- Santa Barbara County population projected at +20% by 2050 — long-run rental-demand tailwind backs the buy-and-hold thesis.
- By year 2, paydown + projected appreciation supports a ~$42k cash-out refi (75% LTV) — recoverable capital for the next deal without selling this one.
Negotiation context
- Only 1 days on market — expect competitive offers; lowballing is unlikely to land.
- 8 sale attempts since 33y ago with the ask held roughly flat each time — persistent listings suggest the price (not the market) is what's stuck; bring a comps-based counter.
- Current owner paid $435k; 29% above their basis — modest negotiation headroom, anchor on the comps not their cost.
Risks & watch-outs
- Watch-outs: flood insurance adds $66/mo.
- Climate carrying-cost: severe flood risk; major wildfire risk; extreme-heat days projected 11→30/yr by 2055 (HVAC capex compounding) — expect insurance premiums to compound above CPI over the hold.
Questions for the listing agent
- What do current leases actually rent for vs. the listed asking? Can we see a recent rent roll and the last 12 months of T-12 income?
- Built in 1978 — when were the roof, HVAC, electrical panel, plumbing, and water heater last replaced?
- What's the actual annual flood-insurance premium (NFIP or private), and is the property in a SFHA with mandatory coverage?
- Is there a deadline driving the sale (1031 exchange, divorce, estate, relocation)? That informs how much negotiation room exists.
- The area grade is low — what's the realistic commute time and amenity access for the typical tenant pool here? Any planned neighborhood developments (good or bad) we should know about?
- What's the average days-on-market for RENTAL listings here right now (not sales)? A rising rental-DOM trend means longer vacancies and softer asking-rent achievability than the comps imply.
- What's the recent tenant-quality profile in this submarket — average credit score on applications, eviction rate, late-payment / NSF rate, and stable-employment percentage? A property-management company in the area should have these aggregated.
- How much new for-sale + rental construction is in the pipeline within 1–3 miles? Heavy new supply typically softens prices + rents 12–24 months out; constrained supply supports both.
Investment metrics
- 1% rule
- 0.80% ✗
- Cap rate
- 5.60%
- Cash-on-cash
- -2.47%
- DSCR
- 0.89
- GRM
- 10.4
CMA / ARV
No comps found within radius.
Projected returns pro-forma
3.96% appreciation · 3.0% rent growth · sell at horizon
- IRR
- 7.5%
- Equity multiple
- 1.46×
- Total profit
- $71,620
- Equity at exit
- $282,492
- IRR
- 9.8%
- Equity multiple
- 2.63×
- Total profit
- $255,720
- Equity at exit
- $460,897
Cash invested: $156,800 (down + closing). Projections, not guarantees.
Landlord ↔ Tenant lean methodology
- Overall (STATE)
- 18 Strongly Tenant-Friendly
- State California
- 18 Strongly Tenant-Friendly · D+13
- County
- — inherits STATE
- City
- — inherits STATE
ZIP-level market 93110
- Home prices YoY
- 1.2%
- Active inventory
- 49
- Price-to-rent
- 10.4×
Monthly cashflow live
- Estimated rent
- $4,490 medium interval (Pro) →
- Mortgage (P&I)
- −$2,937
- Tax est. 1.5%
- −$700 /mo · $8,400/yr
- Insurance
- −$233
- Flood insurance flood zone
- −$66 /mo · $798/yr
- HOA
- −$0
- Vacancy / Maint / Mgmt
- −$943
- Net cashflow
- $-389
Break-even live
Sensitivity live
| Price | -10% $-2 | -5% $-196 | +0% $-389 | +5% $-583 | +10% $-776 |
|---|---|---|---|---|---|
| Rent | -10% $-744 | -5% $-567 | +0% $-389 | +5% $-212 | +10% $-35 |
| Rate | -1.0pp $-107 | -0.5pp $-247 | base $-389 | +0.5pp $-534 | +1.0pp $-682 |
UW: 25.0% down · 7.5% · 30yr · 1.5% tax · 5.0% vac · 8.0% maint · 8.0% mgmt
Financing live
Cash to close
- Down payment
- $140,000
- Closing costs
- $16,800
- Reserves months
- —
- Total cash needed
- —
Loan-product check · same deal, 3 products live
Conventional
25% down · 7.5% · 30yr
- Down + closing
- —
- Monthly P&I
- —
- Monthly cashflow
- —
- DSCR
- —
- Eligible?
- —
Personal DTI + credit; lowest rate.
DSCR
20% down · 8.5% · 30yr
- Down + closing
- —
- Monthly P&I
- —
- Monthly cashflow
- —
- DSCR
- —
- Eligible?
- —
No personal income docs; deal must DSCR.
Hard money
10% down · 12.0% · 12mo
- Down + closing
- —
- Monthly P&I
- —
- Monthly cashflow
- —
- DSCR
- —
- Eligible?
- —
Short-term bridge; refi at stabilization.
Rent comps 3 comps
| Address | Beds | Baths | Sqft | Rent | $/sqft | DOM | Units | Dist |
|---|---|---|---|---|---|---|---|---|
| 4099 Foothill Rd Santa Barbara, CA | 2.0–3.0 | 1.5–2.5 | 1450 | $4,200 | $2.90 | 15d | 2 | 0.34mi |
| 4120 Via Andorra Unit A Santa Barbara, CA | 3.0 | 2.5 | 1456 | $5,950 | $4.09 | 25d | 1 | 0.39mi |
| 4632 Tajo Dr Santa Barbara, CA | 3.0 | 2.0 | 1251 | $5,150 | $4.12 | 15d | 1 | 1.24mi |
Listing history 2 events
-
2026-06-21remarks 699-char remark
-
2026-06-21$560,000 Active 1 DOM
ⓘ Source: listings_history table (triggers on properties + properties_extension) + one-shot
backfill from property_details.listing_events for pre-trigger history.
Climate risk First Street
- Flood 9/10 Extreme FEMA zone X (unshaded) · 99% chance over 30 yrs
- Wildfire 6/10 Major
- Heat 7/10 Severe 11 d/yr ≥83°F today · 30 d/yr by 30 yrs out
- Wind 1/10 Low
- Air quality 6/10 Major 10 unhealthy d/yr today · 10 by 30 yrs out
Nearby sold comps map
Loading sold comps map…
Walkable amenities ~0.75 mi
Loading nearby amenities…
Taxation est. · year 1
- Rental income
- $53,880
- − Mortgage interest
- −$31,369
- − Property taxes
- −$8,400
- − Insurance
- −$3,598
- − Repairs & maintenance
- −$4,310
- − Management
- −$4,310
- − Depreciation
- −$16,291
- Taxable loss
- −$14,398
- Est. tax savings @ 24.0%
- +$3,455
- After-tax cash flow
- $-1,217/yr
For passive investors: Depreciation is non-cash, so a rental often shows a tax loss while cash-flowing — sheltering income. Rental losses are passive: they offset passive income freely, and up to $25,000/yr can offset ordinary (W-2) income if you actively participate and your MAGI is under $100k (phasing out to $0 by $150k); unused losses carry forward. On sale, claimed depreciation is recaptured at up to 25%, and gains may owe capital-gains tax (a 1031 exchange can defer both). Figures are a year-1 estimate at your 24.0% rate — not tax advice; consult a CPA.
Schools (NCES district)
No district data.
Livability — Eastern Goleta Valley
No livability data for this city. (Only ~50 U.S. cities are tracked.)
Census & demographics
- Census place
- Eastern Goleta Valley, CA
- County
- Santa Barbara County · 410,380 people
- City population
- 34,619
- Metro
- Santa Maria-Santa Barbara, CA
- Population (ZIP)
- 15,436
- Household income
- $129,209
- Rent vs Own
- Severe rent burden
- 415.0
Population outlook (Santa Barbara County) Hauer SSP2
- Today (2025)
- 484,679 people
- By 2030
- 505,323 · +4.3%
- By 2040
- 545,783 · +12.6%
- By 2050
- 584,263 · +20.5%
- By 2075
- 682,586 · +40.8%
- By 2100
- 723,188 · +49.2%
Race, ethnicity, and origin ACS 2023
- Neighborhood character
- Diverse neighborhood (Simpson 0.56)
- Race & ethnicity
- White 59% Hispanic / Latino 32% Two or more races 14% Asian 5% Black 1%
- Hispanic origin (detail)
- Mexican 25%
- Common ancestry
- Italian 3% Romanian 3% Lithuanian 2%
- Foreign-born
- 17% · Canada, China
- Languages at home
- 76% English-only · Spanish 17% Other Indo-European 3% Other Asian/Pacific 2%
Political lean MEDSL · Santa Barbara
- 2024 margin
- Strong D (+26.7) · D 61.8% · R 35.1% · Other 3.1%
- 2008→2024 swing
- +3.8pp toward D · 2008: 22.9pp · 2024: 26.7pp
- All cycles
- 2024: D+26.7 2020: D+32.1 2016: D+28.2 2012: D+17.1 2008: D+22.9
Not yet ingested
- Civics
- —
Market trends
- HPI YoY
- ▲ 3.96%
- Current HPI
- 323.0805
- Rent YoY
- —
- Metro
- Santa Maria-Santa Barbara, CA
- State GDP YoY
- ▲ 3.21%
- F500 in state
- 116
Industry mix (Fortune 500 HQ in CA)
| Industry | F500 HQs | Revenue |
|---|---|---|
| Technology | 27 | $1,492B |
|
||
| Financial Services | 3 | $174B |
|
||
| Retail | 3 | $44B |
|
||
| Insurance | 3 | $26B |
|
||
| Media / Entertainment | 2 | $115B |
|
||
| Pharmaceuticals / Biotech | 2 | $62B |
|
||
Price history
+543.7% since first listed22 events — show timeline
- 2026-06-20 Listed $560,000 SBMLS
- 2024-05-15 Sold (MLS) $435,000 SBMLS
- 2024-05-06 Pending — SBMLS
- 2024-05-01 Contingent — SBMLS
- 2024-03-18 Listed $479,000 SBMLS
- 2021-05-19 Sold (MLS) $270,000 SBMLS
- 2021-03-03 Contingent — SBMLS
- 2021-01-22 Listed $289,000 SBMLS
- 2021-01-01 Listing Removed — SBMLS
- 2020-09-29 Price Changed $279,000 SBMLS
- 2020-08-25 Price Changed $289,900 SBMLS
- 2020-08-23 Relisted — SBMLS
- 2020-08-17 Listing Removed — SBMLS
- 2020-02-16 Listed $299,000 SBMLS
- 2019-12-24 Listing Removed — SBMLS
- 2019-10-03 Relisted — SBMLS
- 2019-10-02 Listing Removed — SBMLS
- 2019-07-10 Price Changed $299,000 SBMLS
- 2019-05-06 Listed $324,500 SBMLS
- 1996-03-15 Sold (MLS) $81,000 SBMLS
- 1996-03-08 Listing Removed — SBMLS
- 1993-12-11 Listed $87,000 SBMLS
Property tax history
-24.7%/yrLatest (2021): $57 · +1.1% YoY. Source: county tax records.
Cash-flow waterfall
monthlySold comps — $/sqft
last 12 mo · ≤1 miLoading sold comps…